Downloaded 149 times


![Amount of each phase present (Lever Rule):
Lever Rule states that,” The relative amount of each phase is directly proportional to the length of
opposite lever arm”.
The tie-line OMP has two arms OM and MP which intersects the liquidus and solidus curves.
According to Lever Rule, the length MP touching the solidus proportional to the amount of liquid
present at M and the length OM touching the liquidus is proportional to the amount of solid phase
present at M.
Therefore,
Amount of liquid phase at M =
𝑴𝑷
𝑶𝑷
× 100 =
[𝟗𝟎−𝟒𝟎]
[𝟗𝟎−𝟐𝟎]
× 100 = 71.42% .
Amount of solid phase at M =
𝑶𝑴
𝑶𝑷
× 100 =
[𝟒𝟎−𝟐𝟎]
[𝟗𝟎−𝟐𝟎]
× 100 = 28.58% .
MTE/III SEMESTER/MSE/MTE 2101 12](https://image.slidesharecdn.com/lecture16-161223032450/75/Phase-Diagram-Two-Component-System-12-2048.jpg)
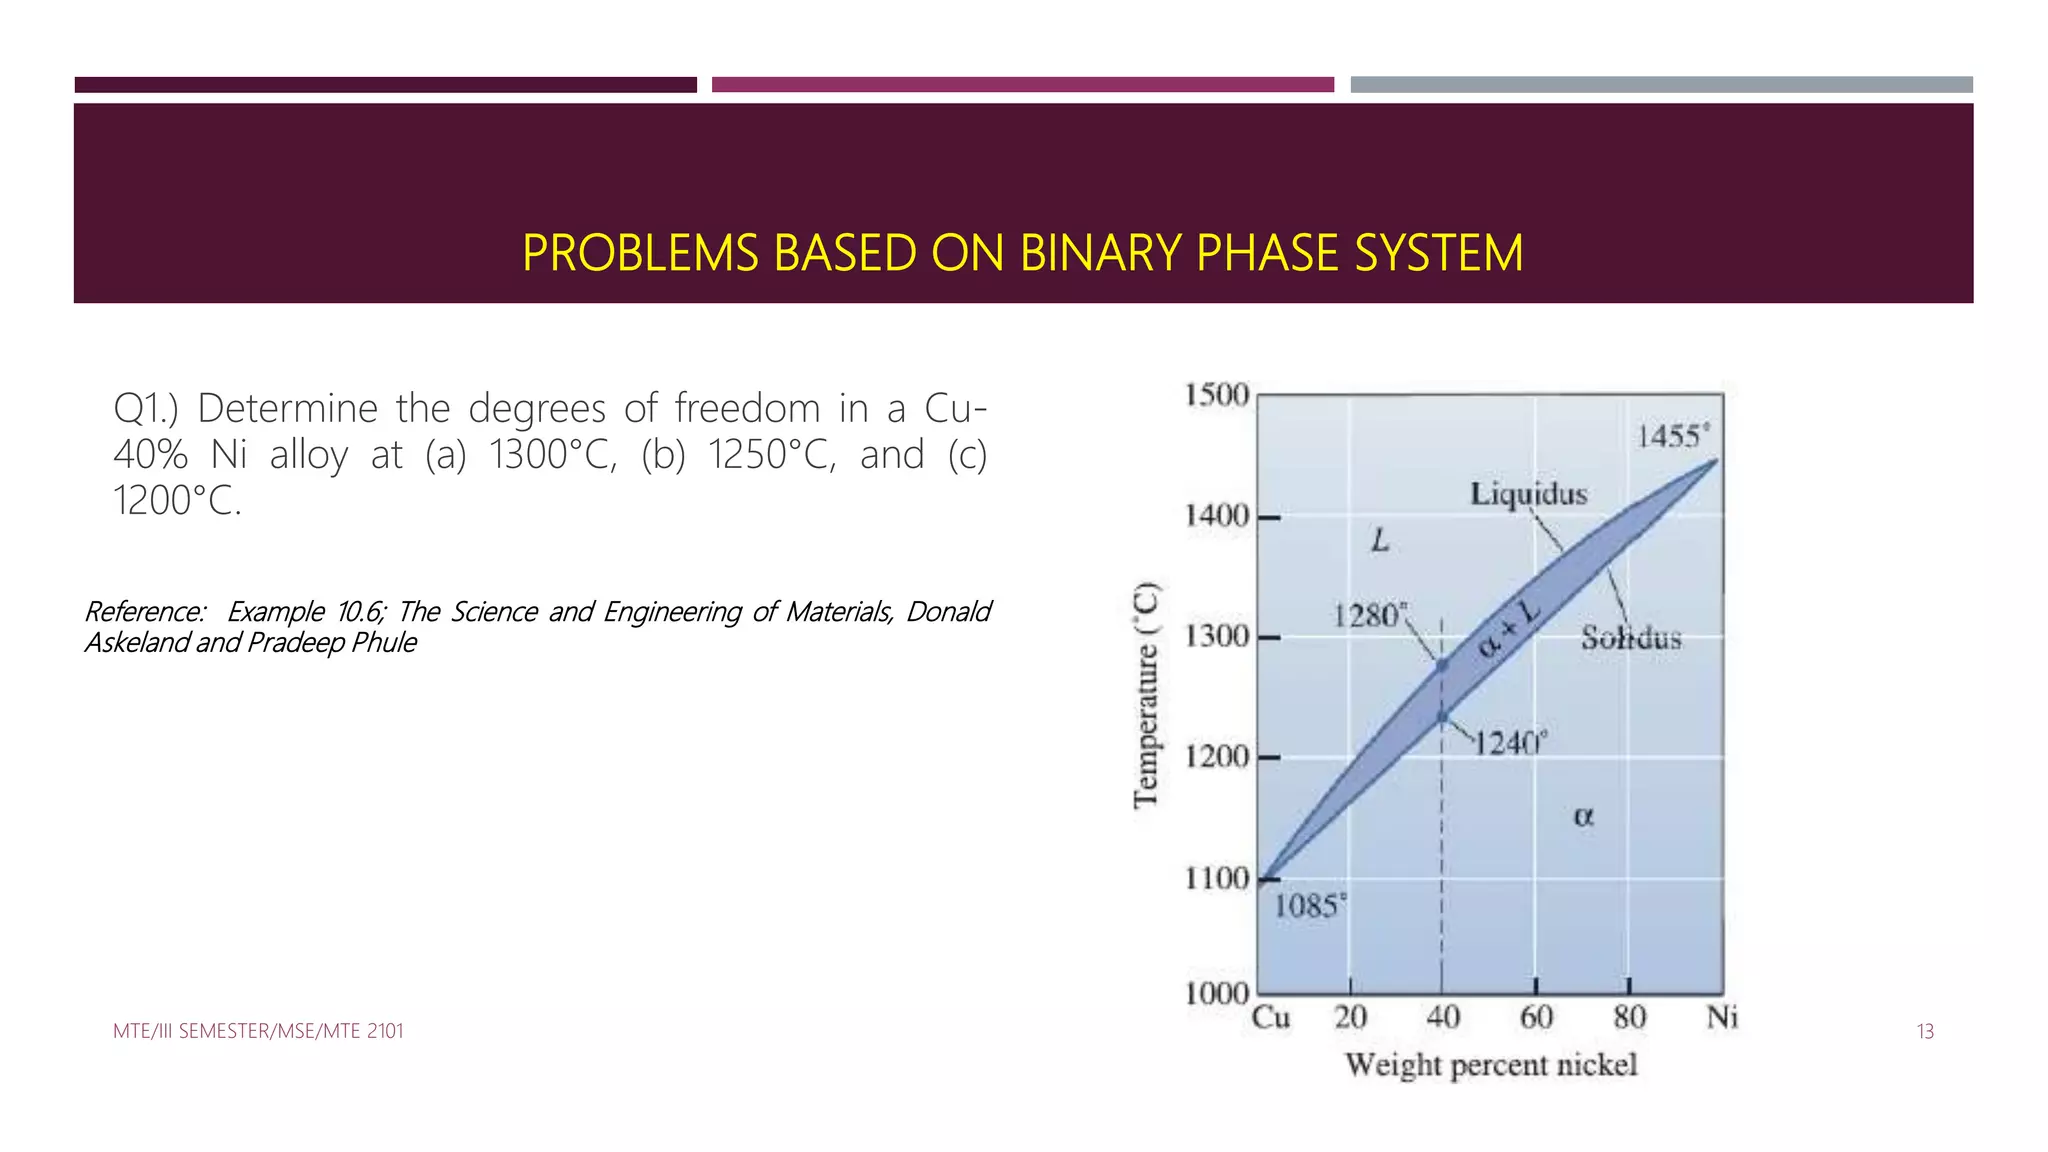

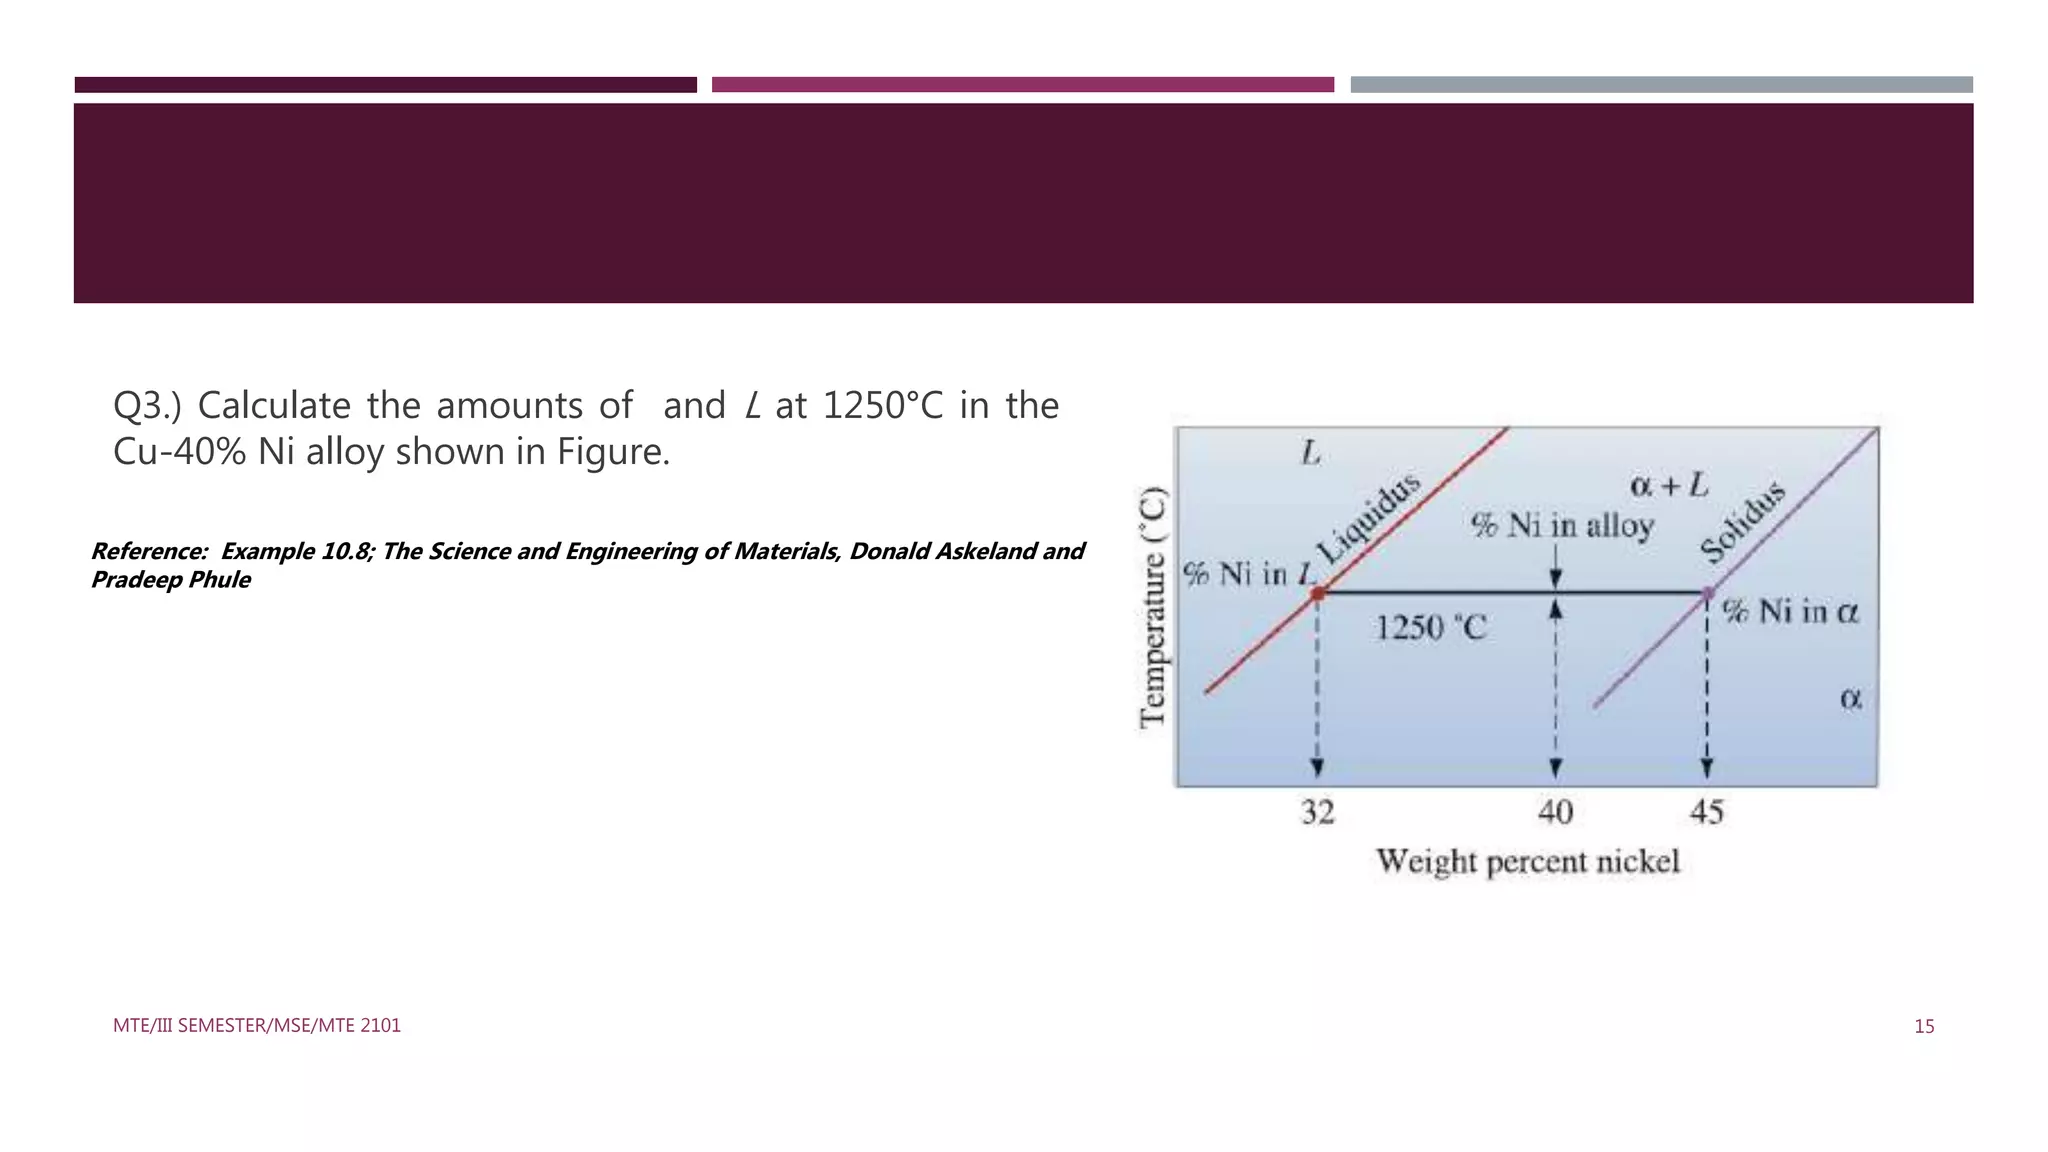

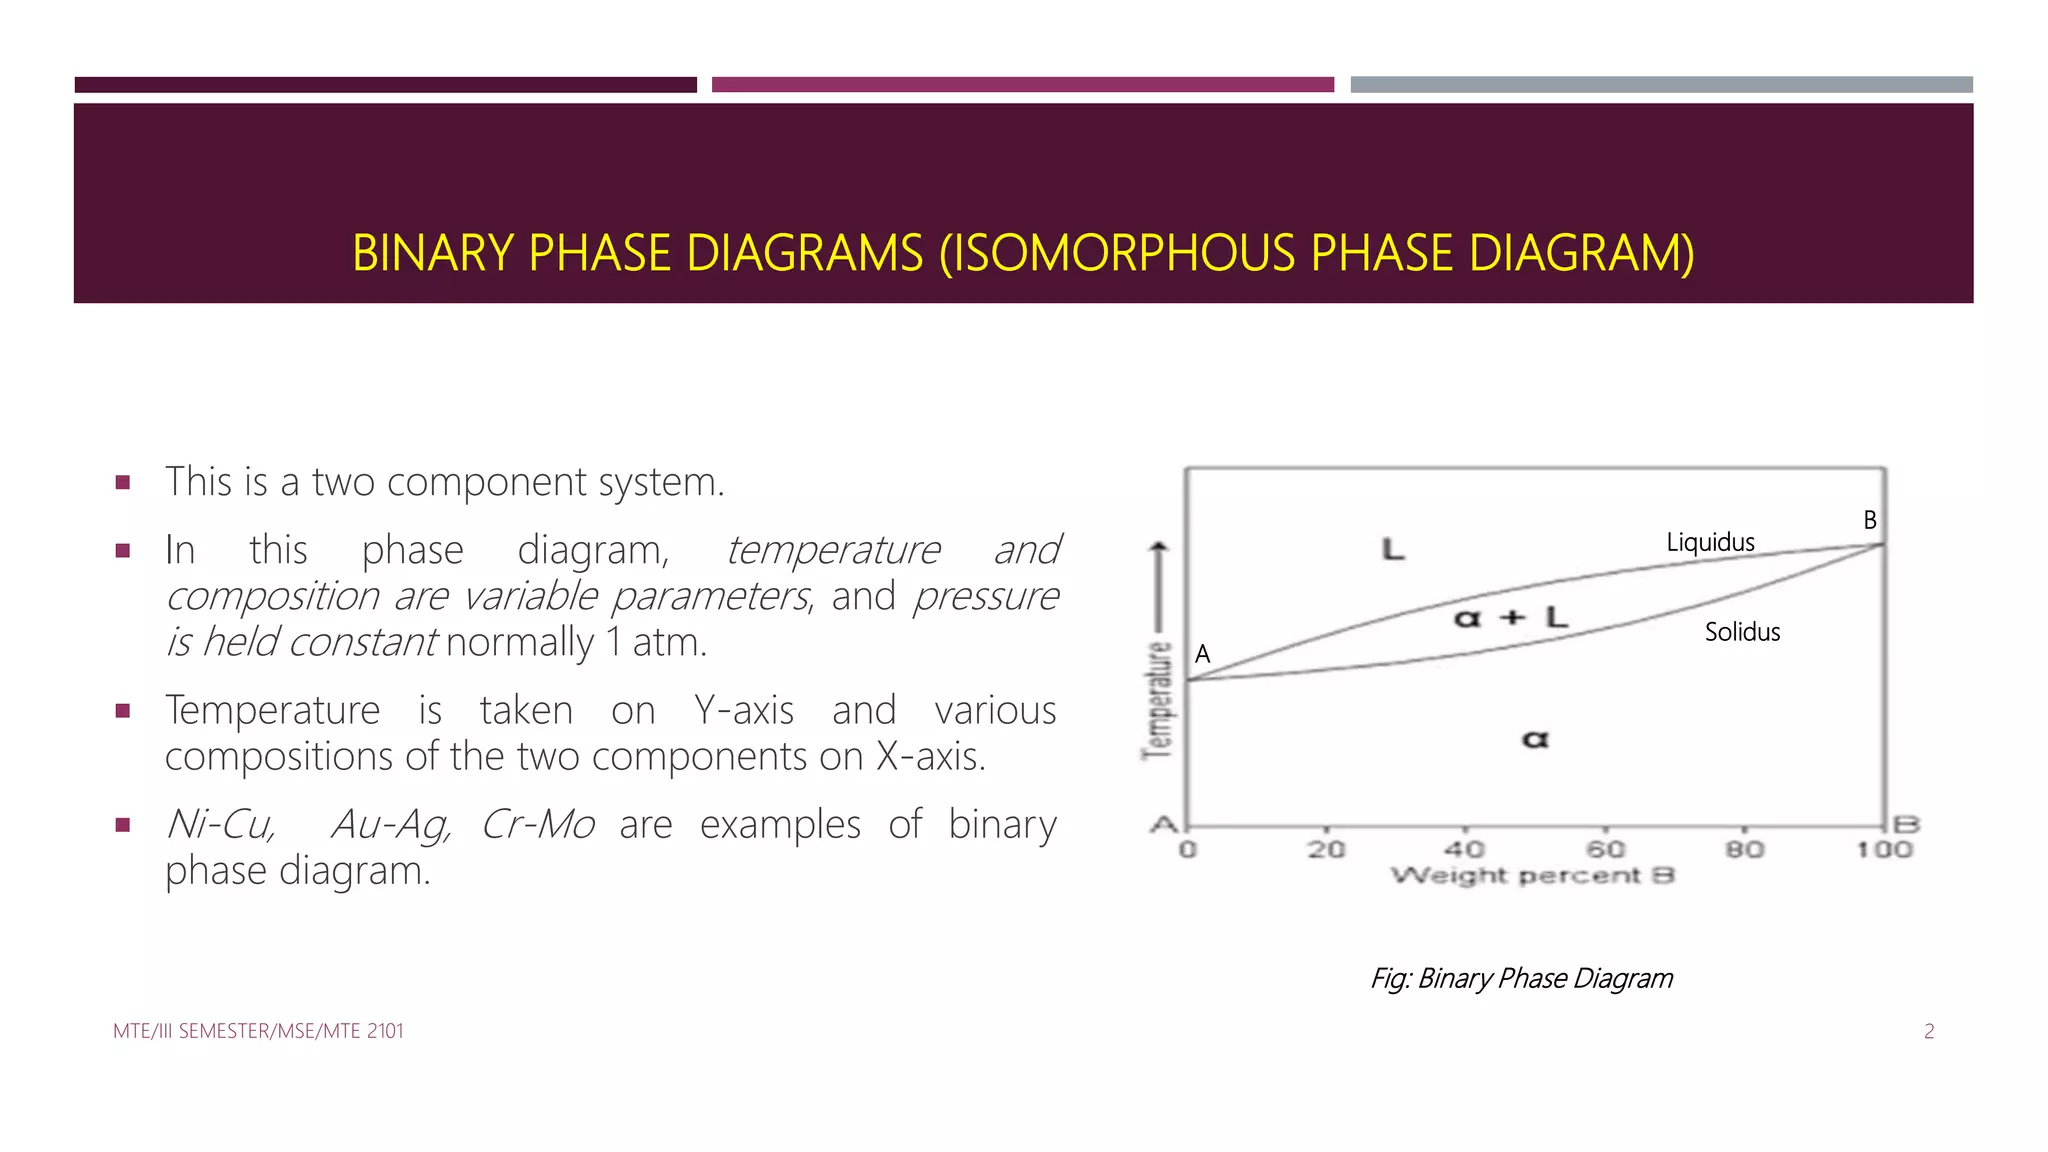
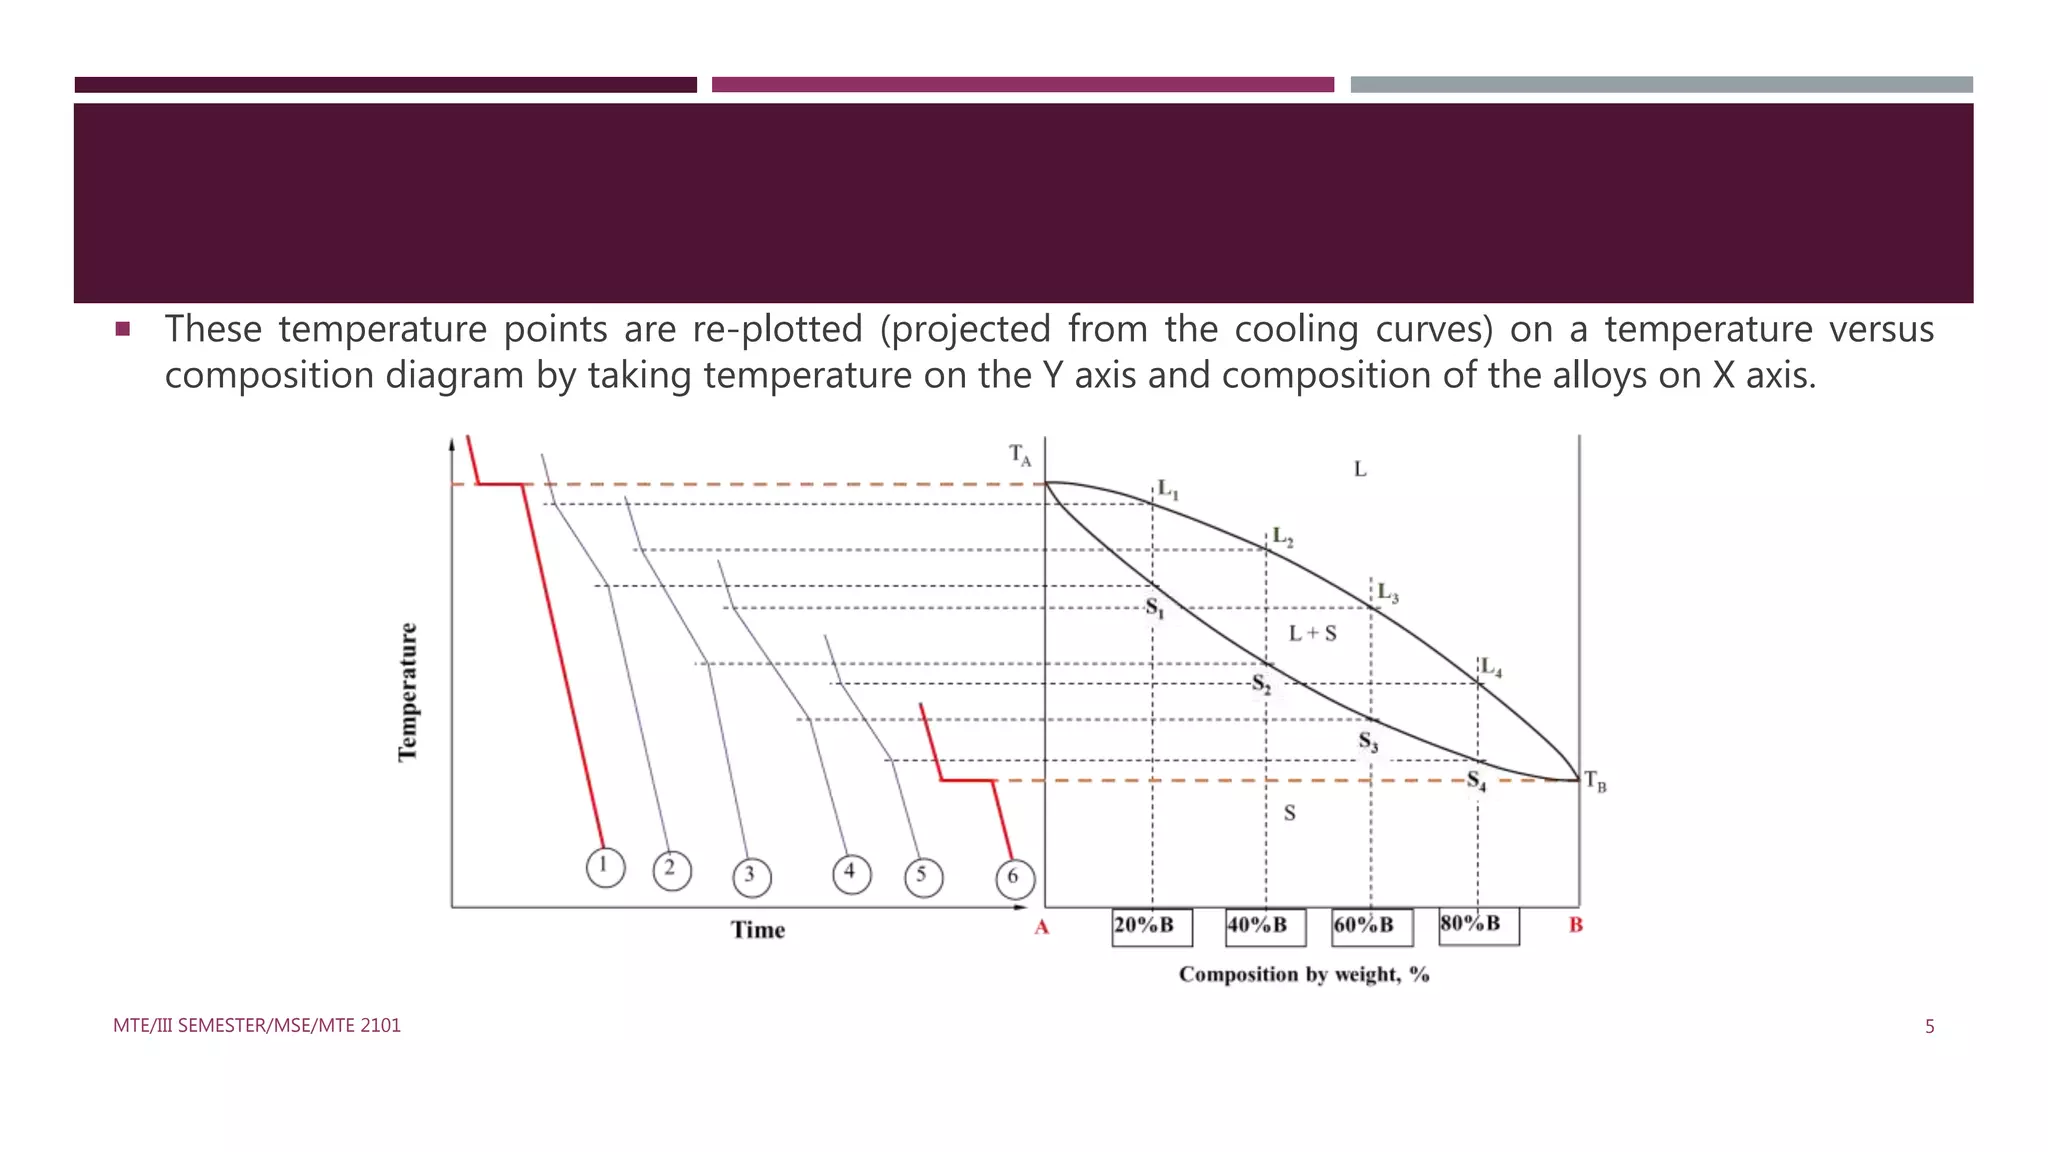
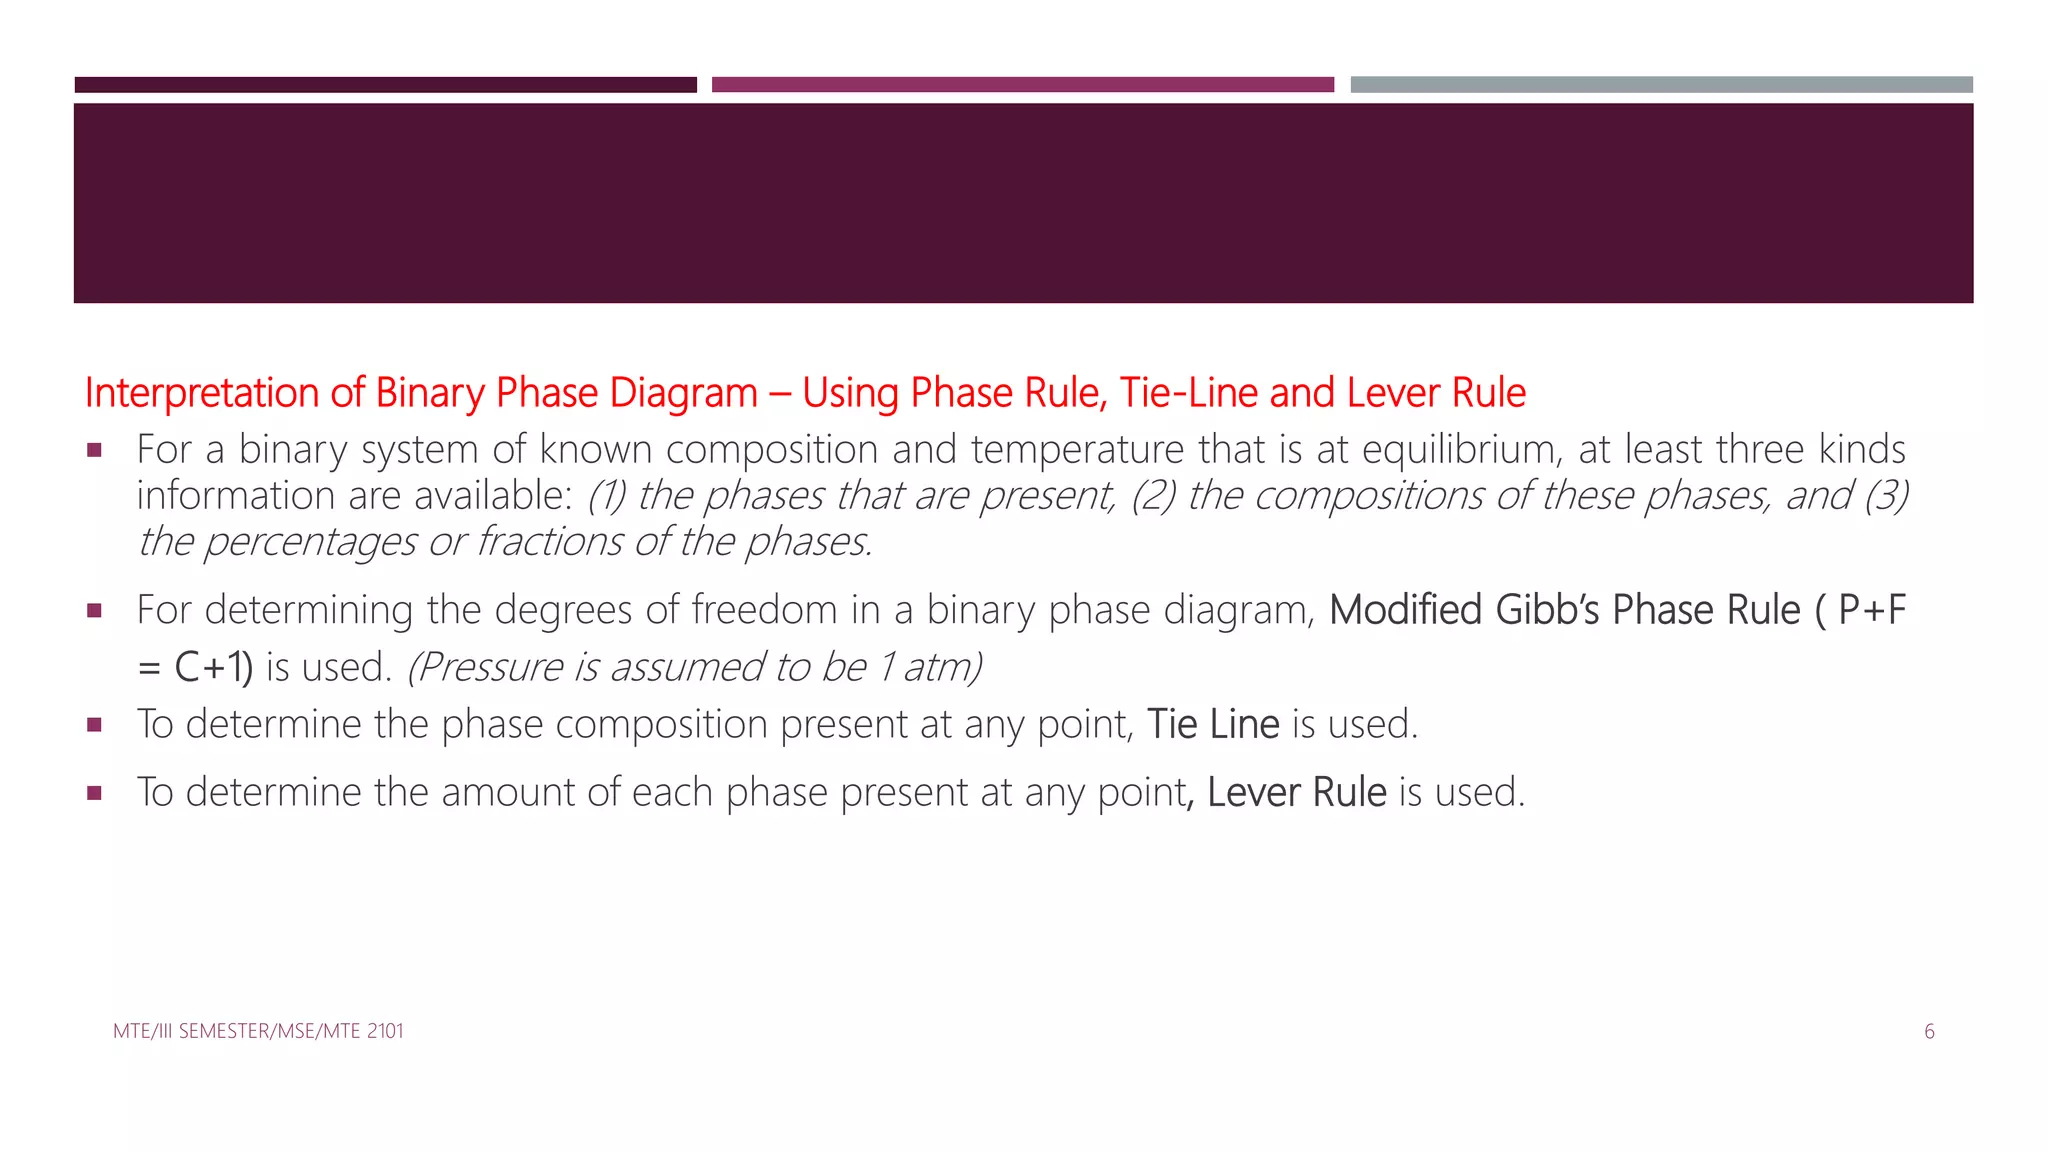
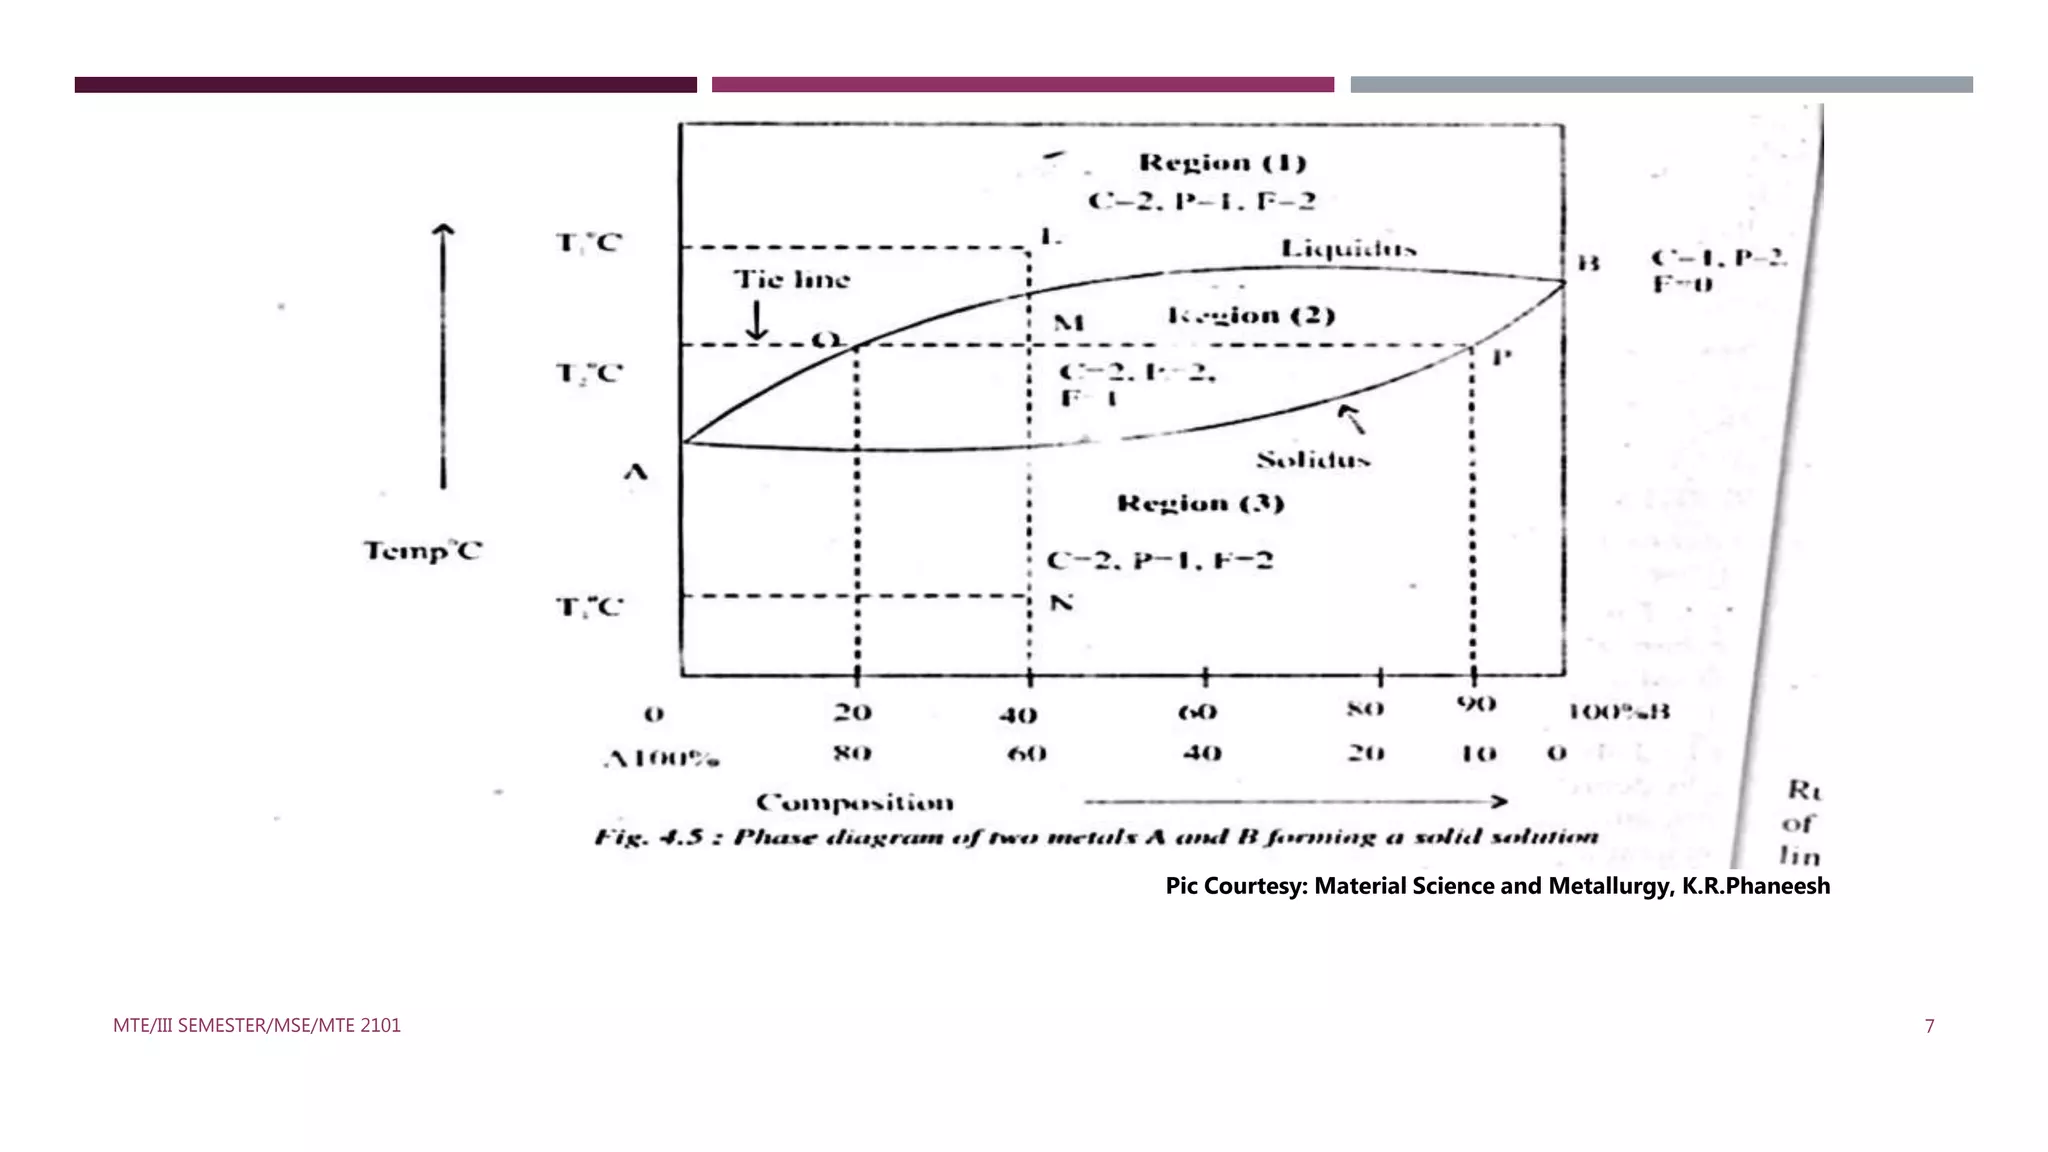
This document discusses binary phase diagrams in materials science, focusing on their description, construction, and interpretation. It explains key concepts such as liquidus and solidus curves, Gibb's phase rule, tie-lines, and lever rules for determining phase compositions and amounts. Problems related to binary phase systems, particularly involving Cu-Ni alloys, are also presented for practical understanding.


