Download as PDF, PPTX
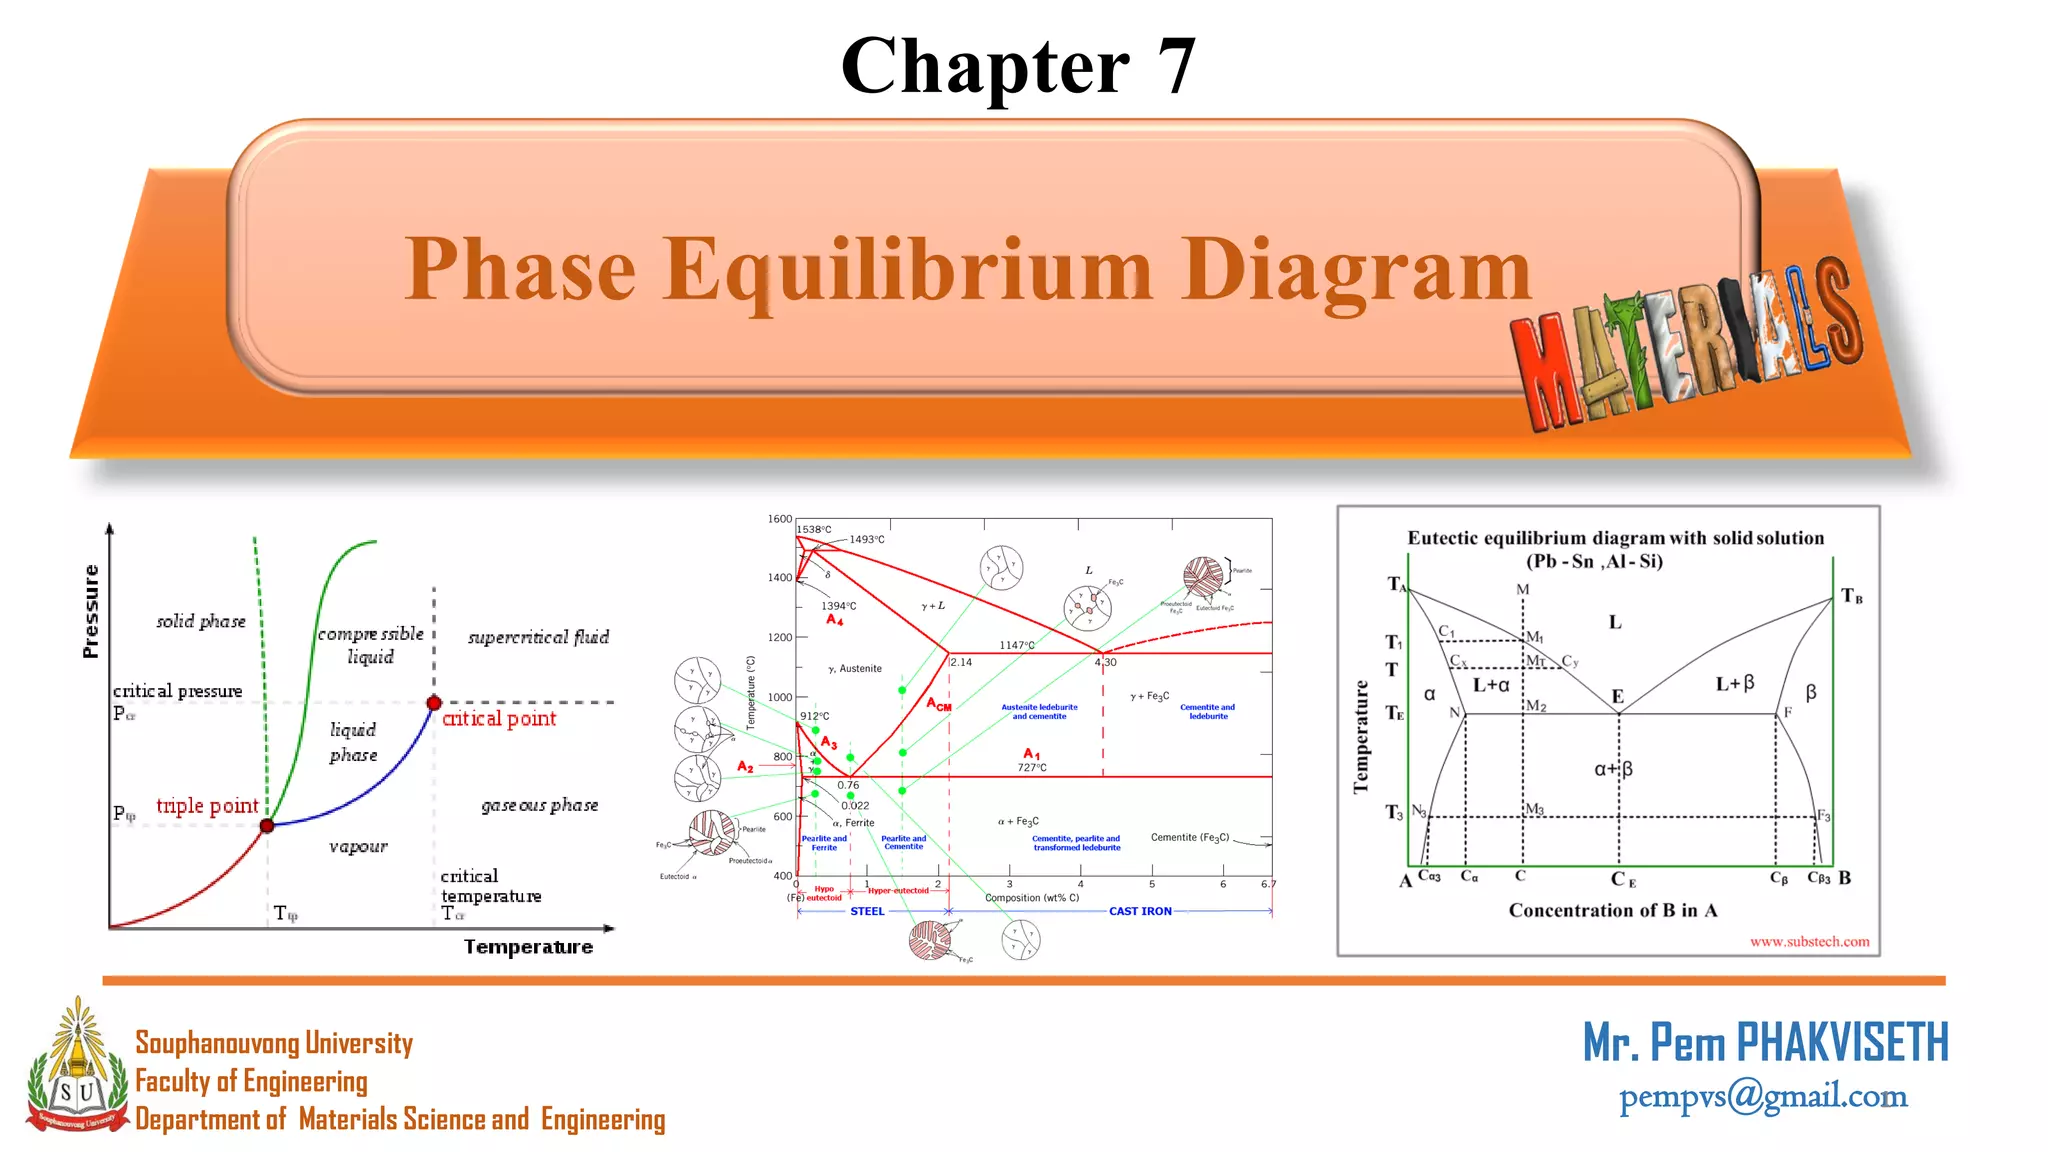
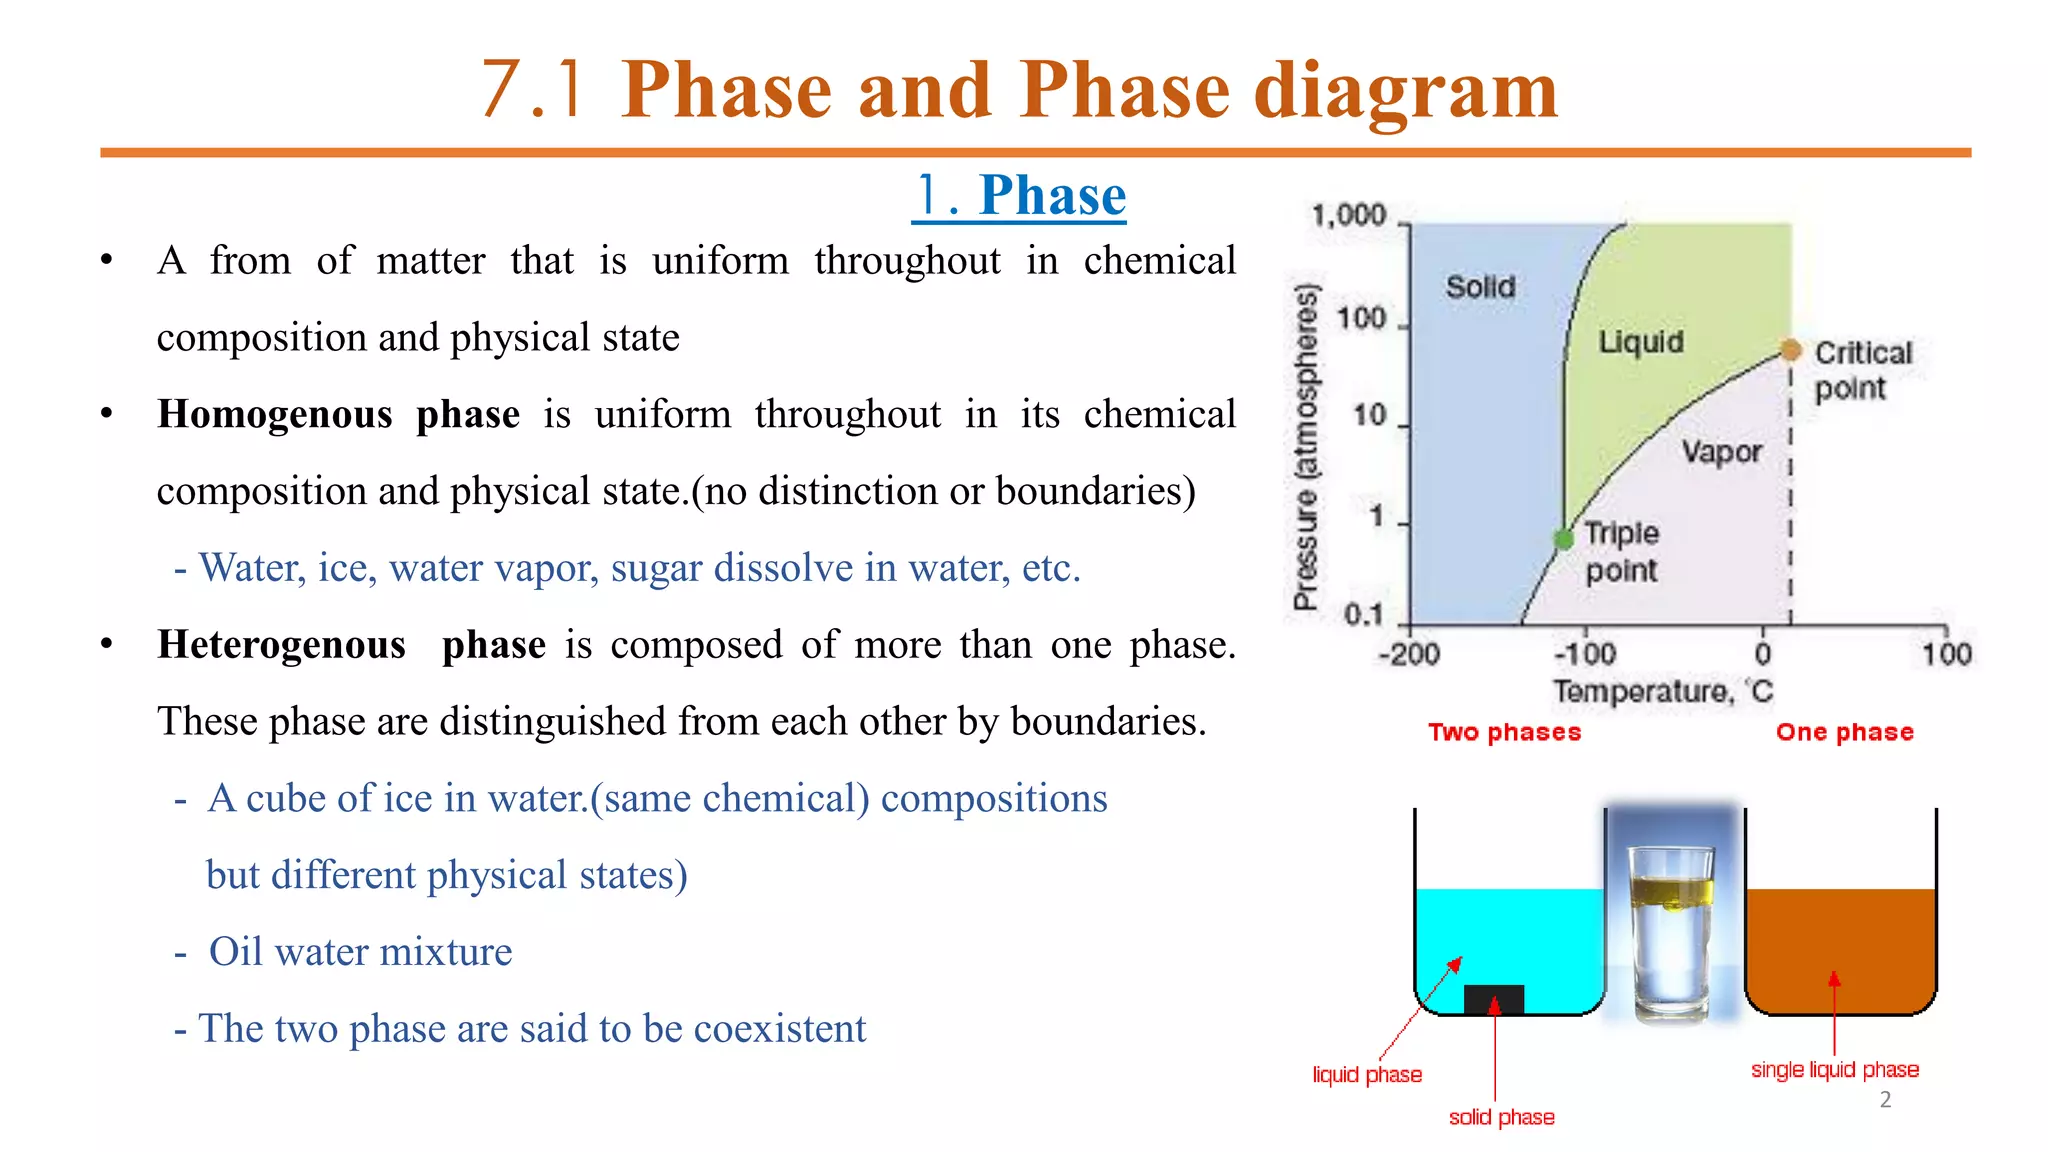
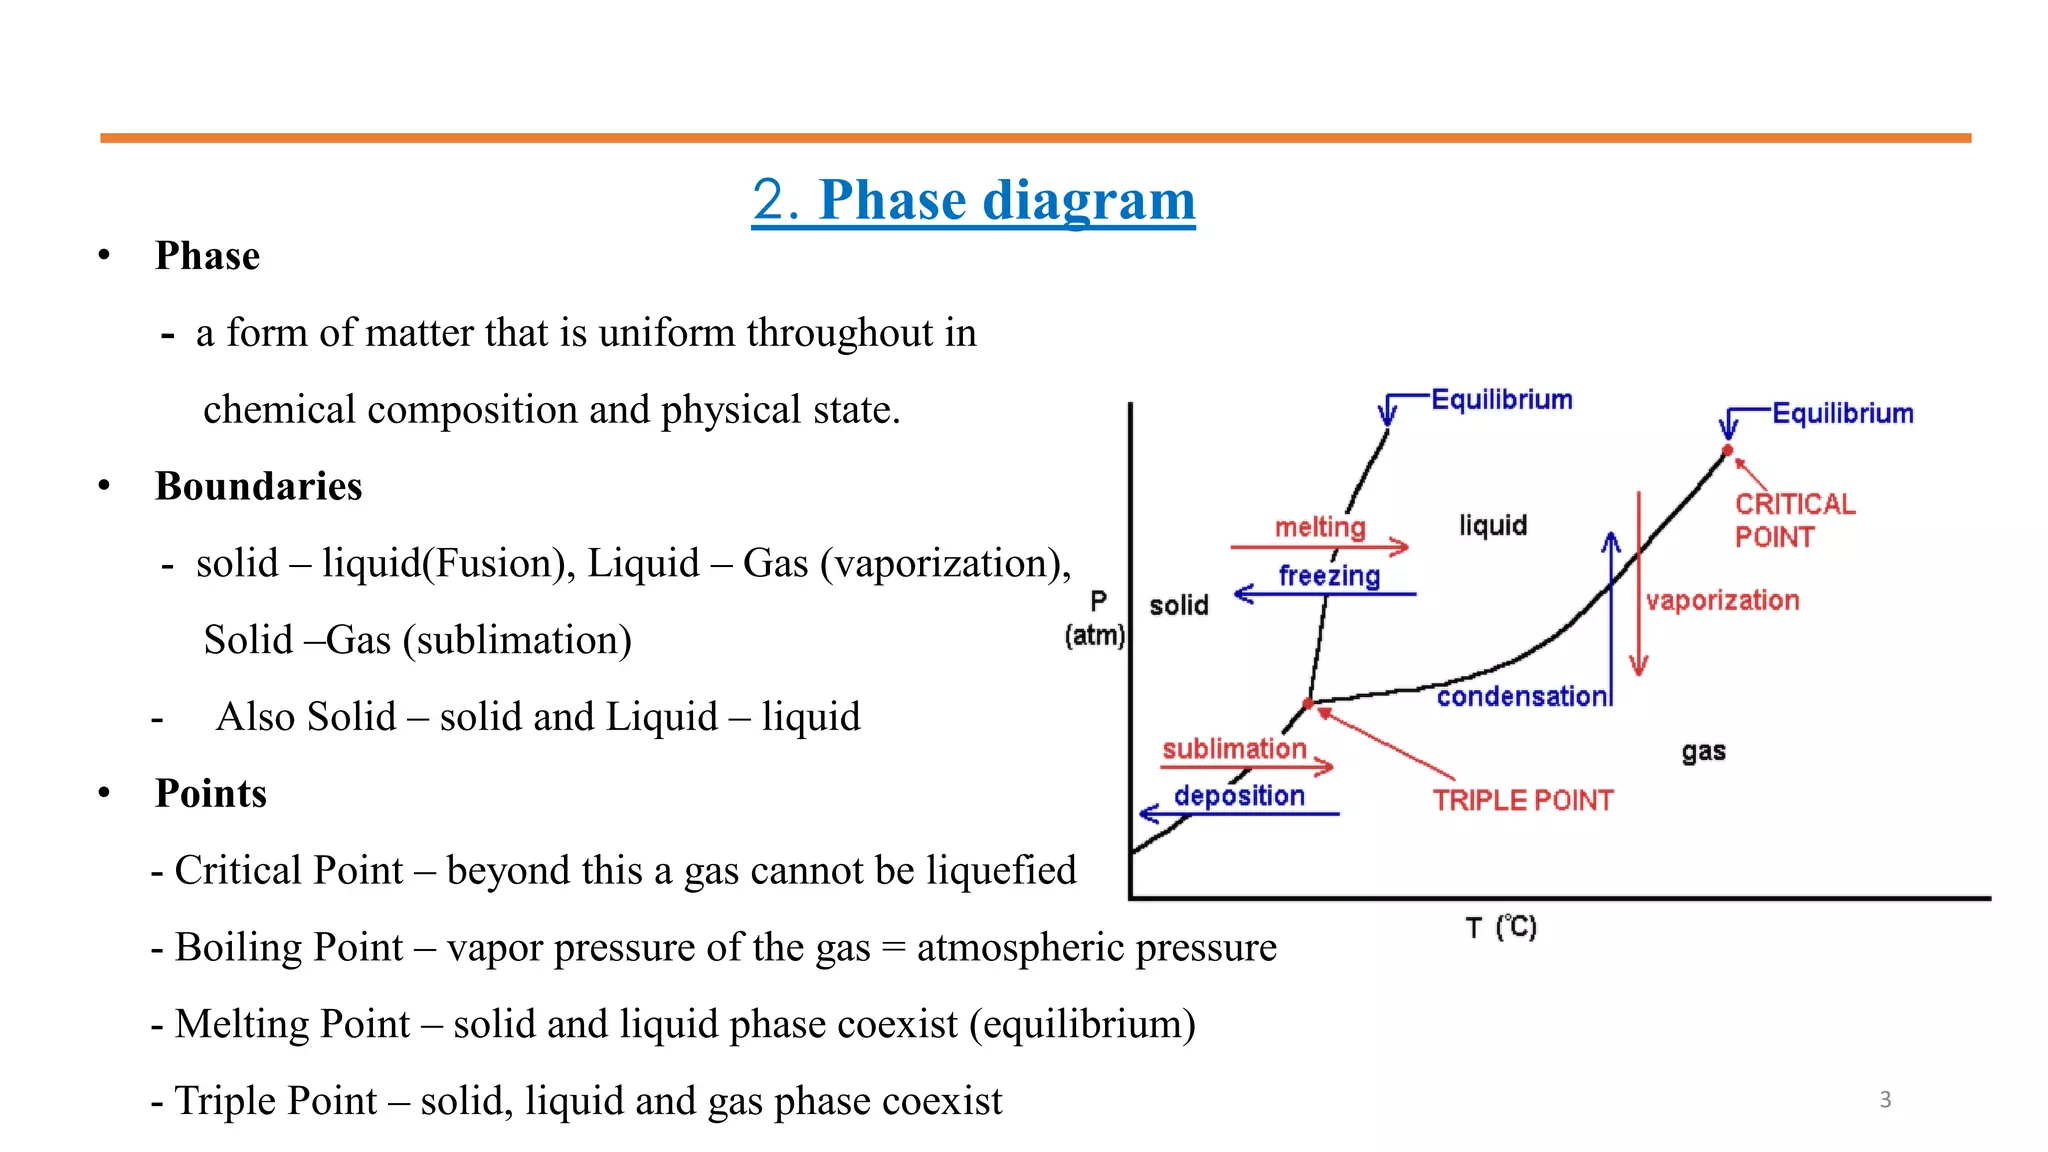
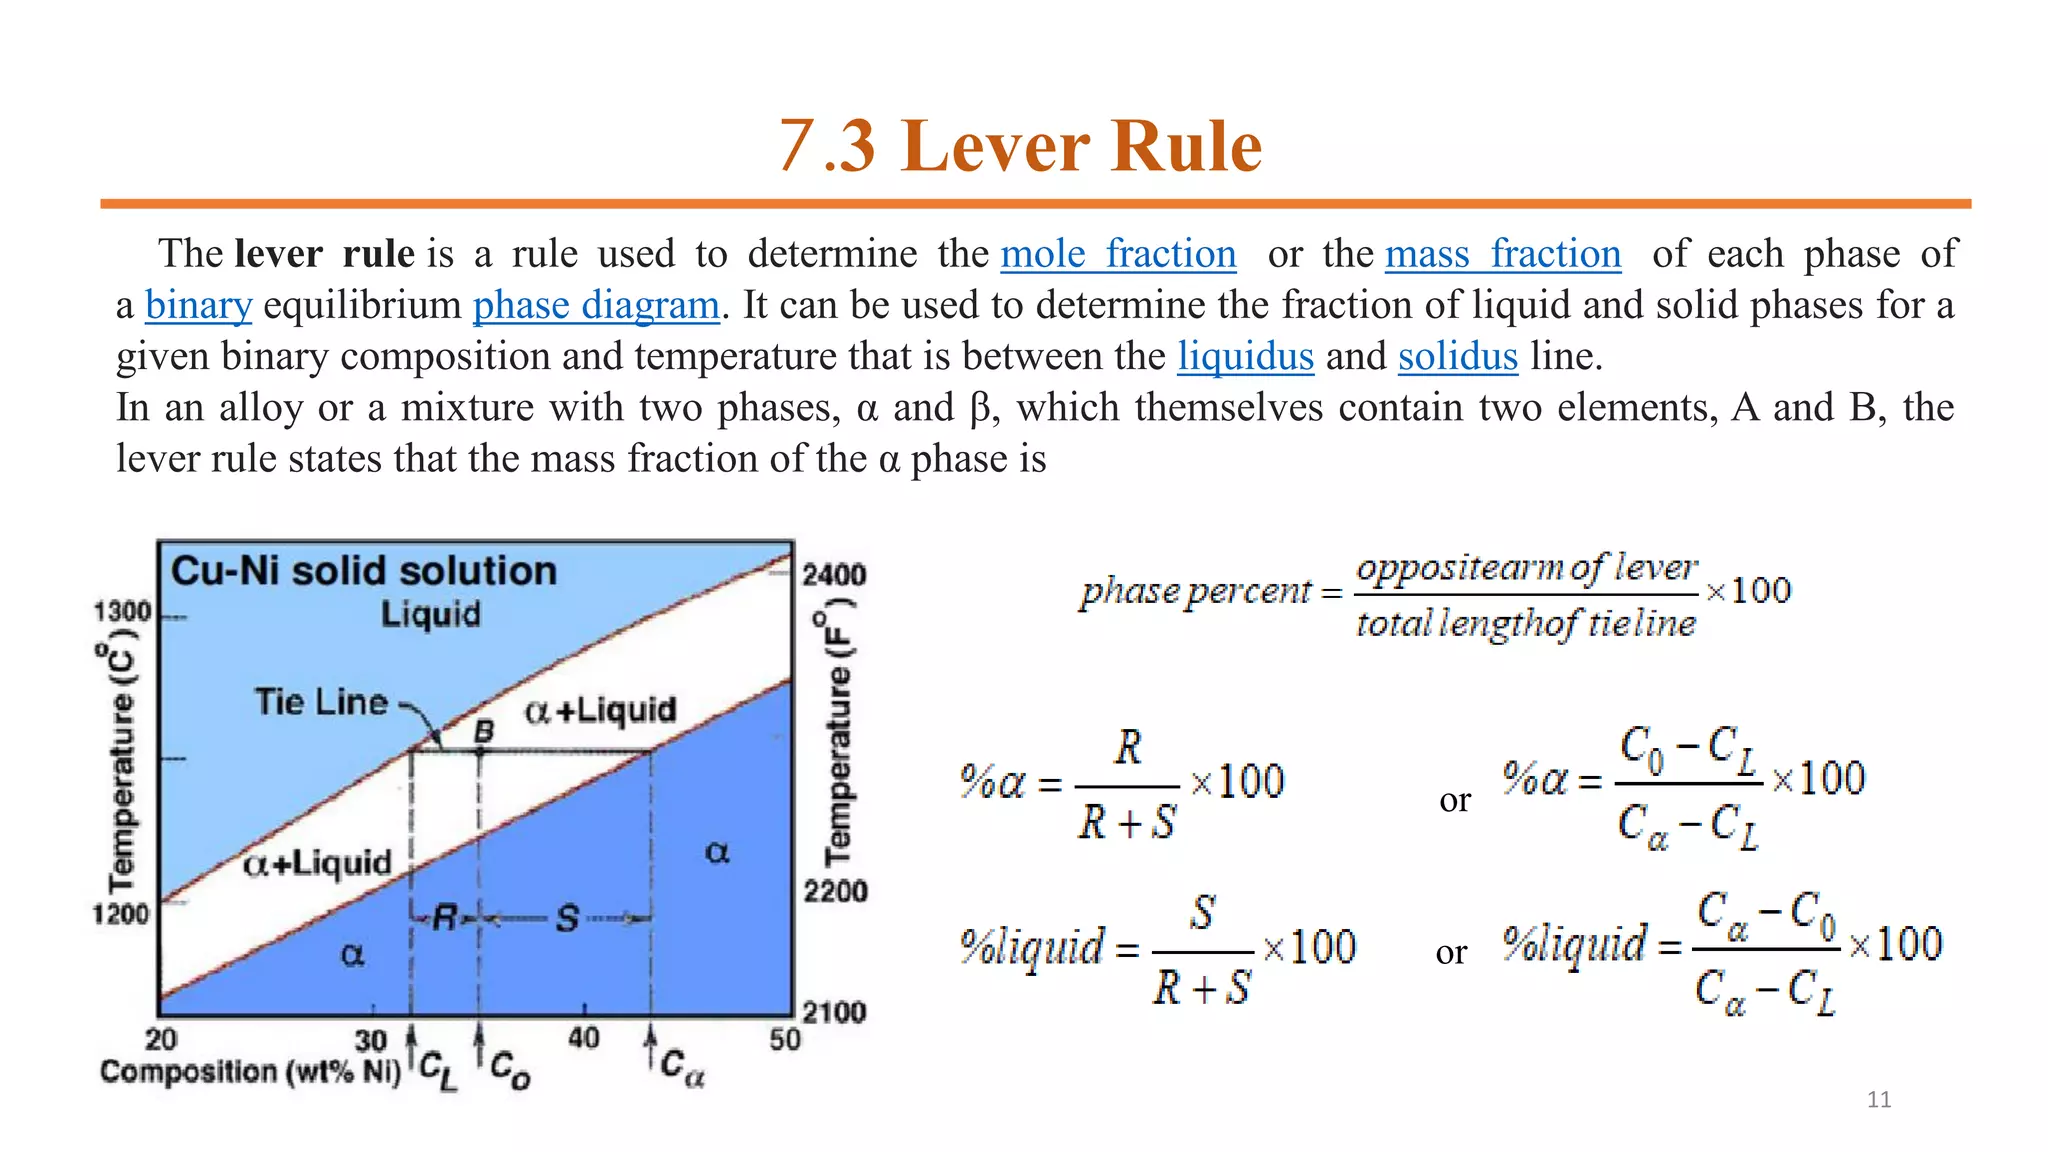

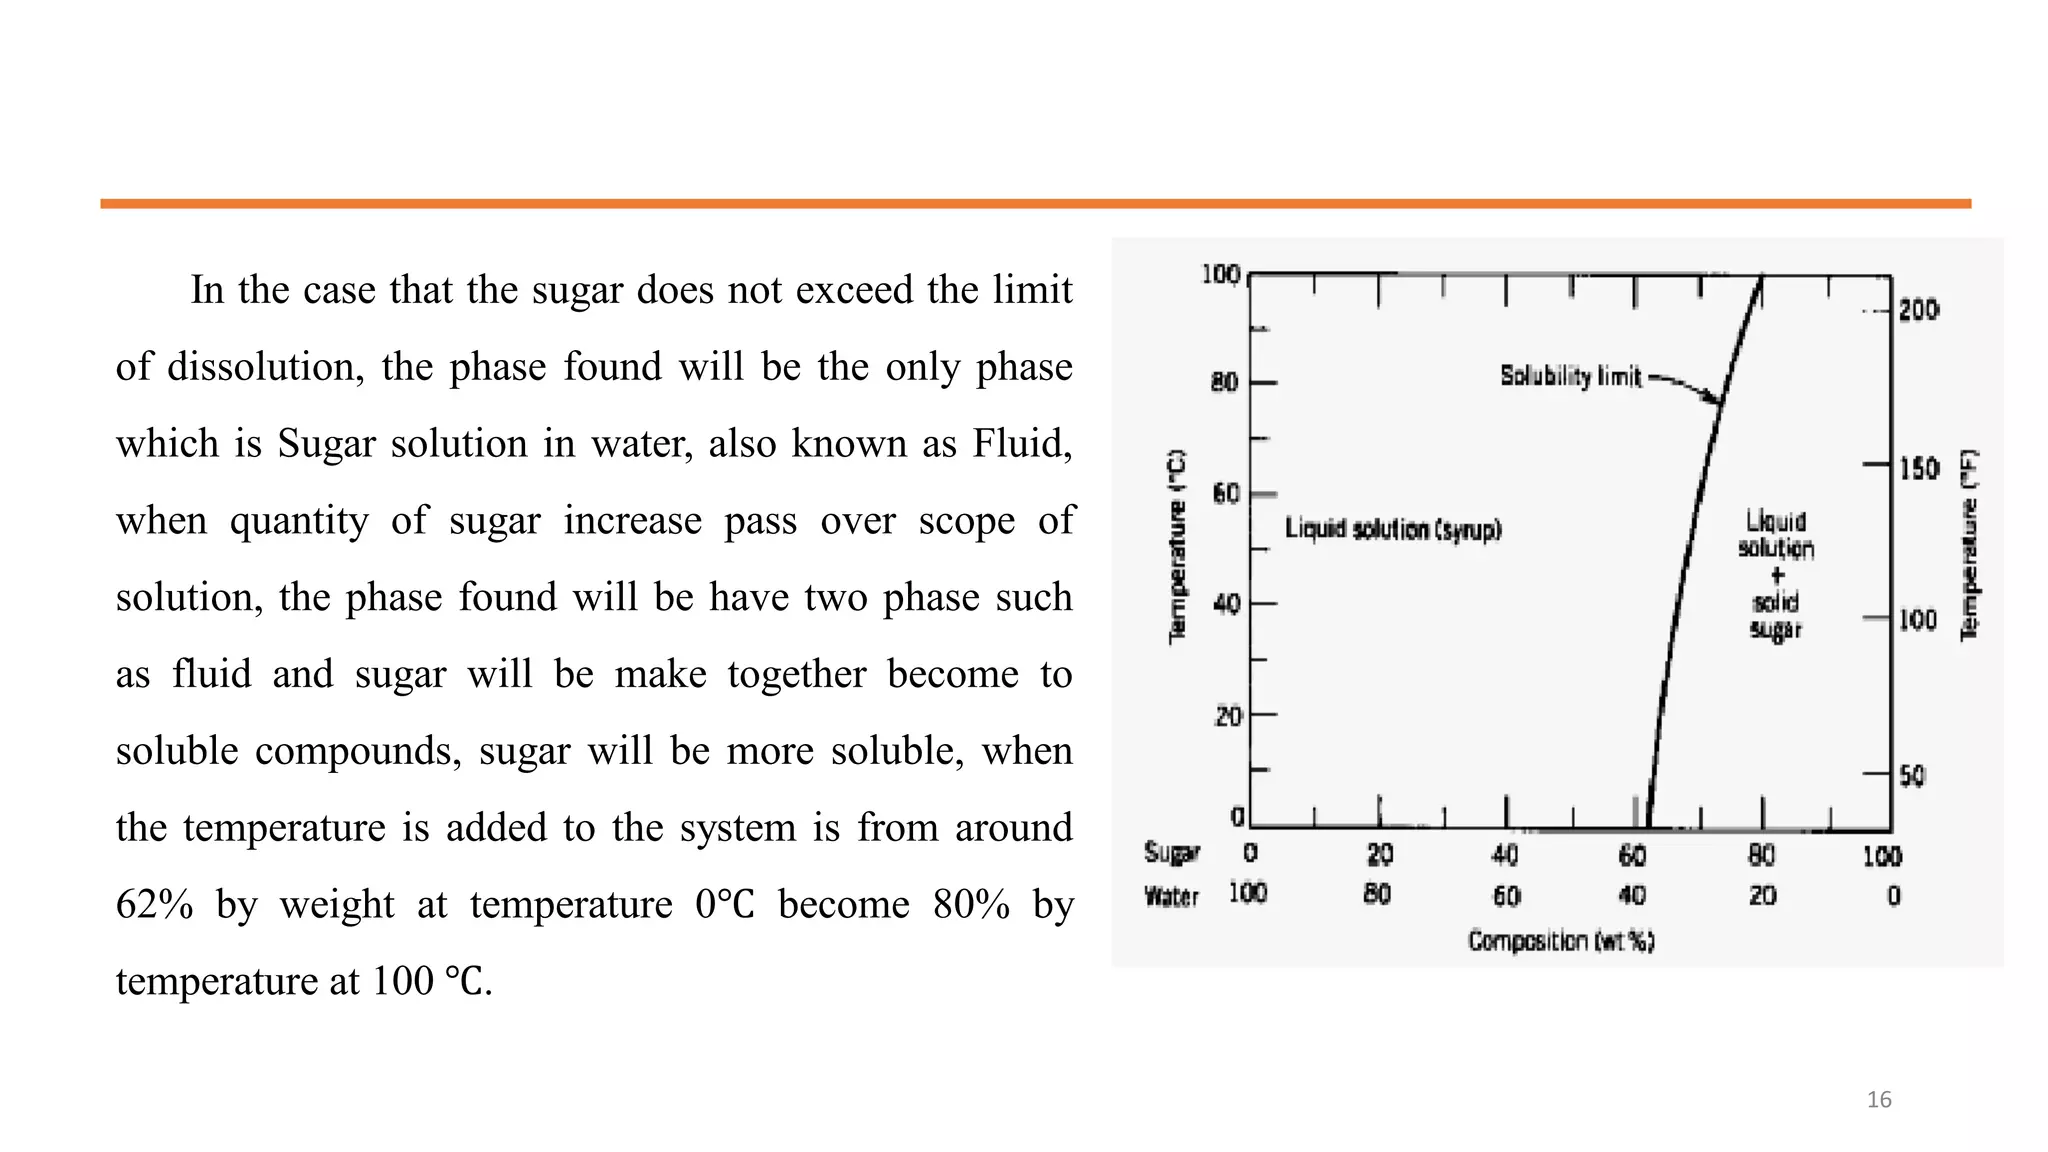
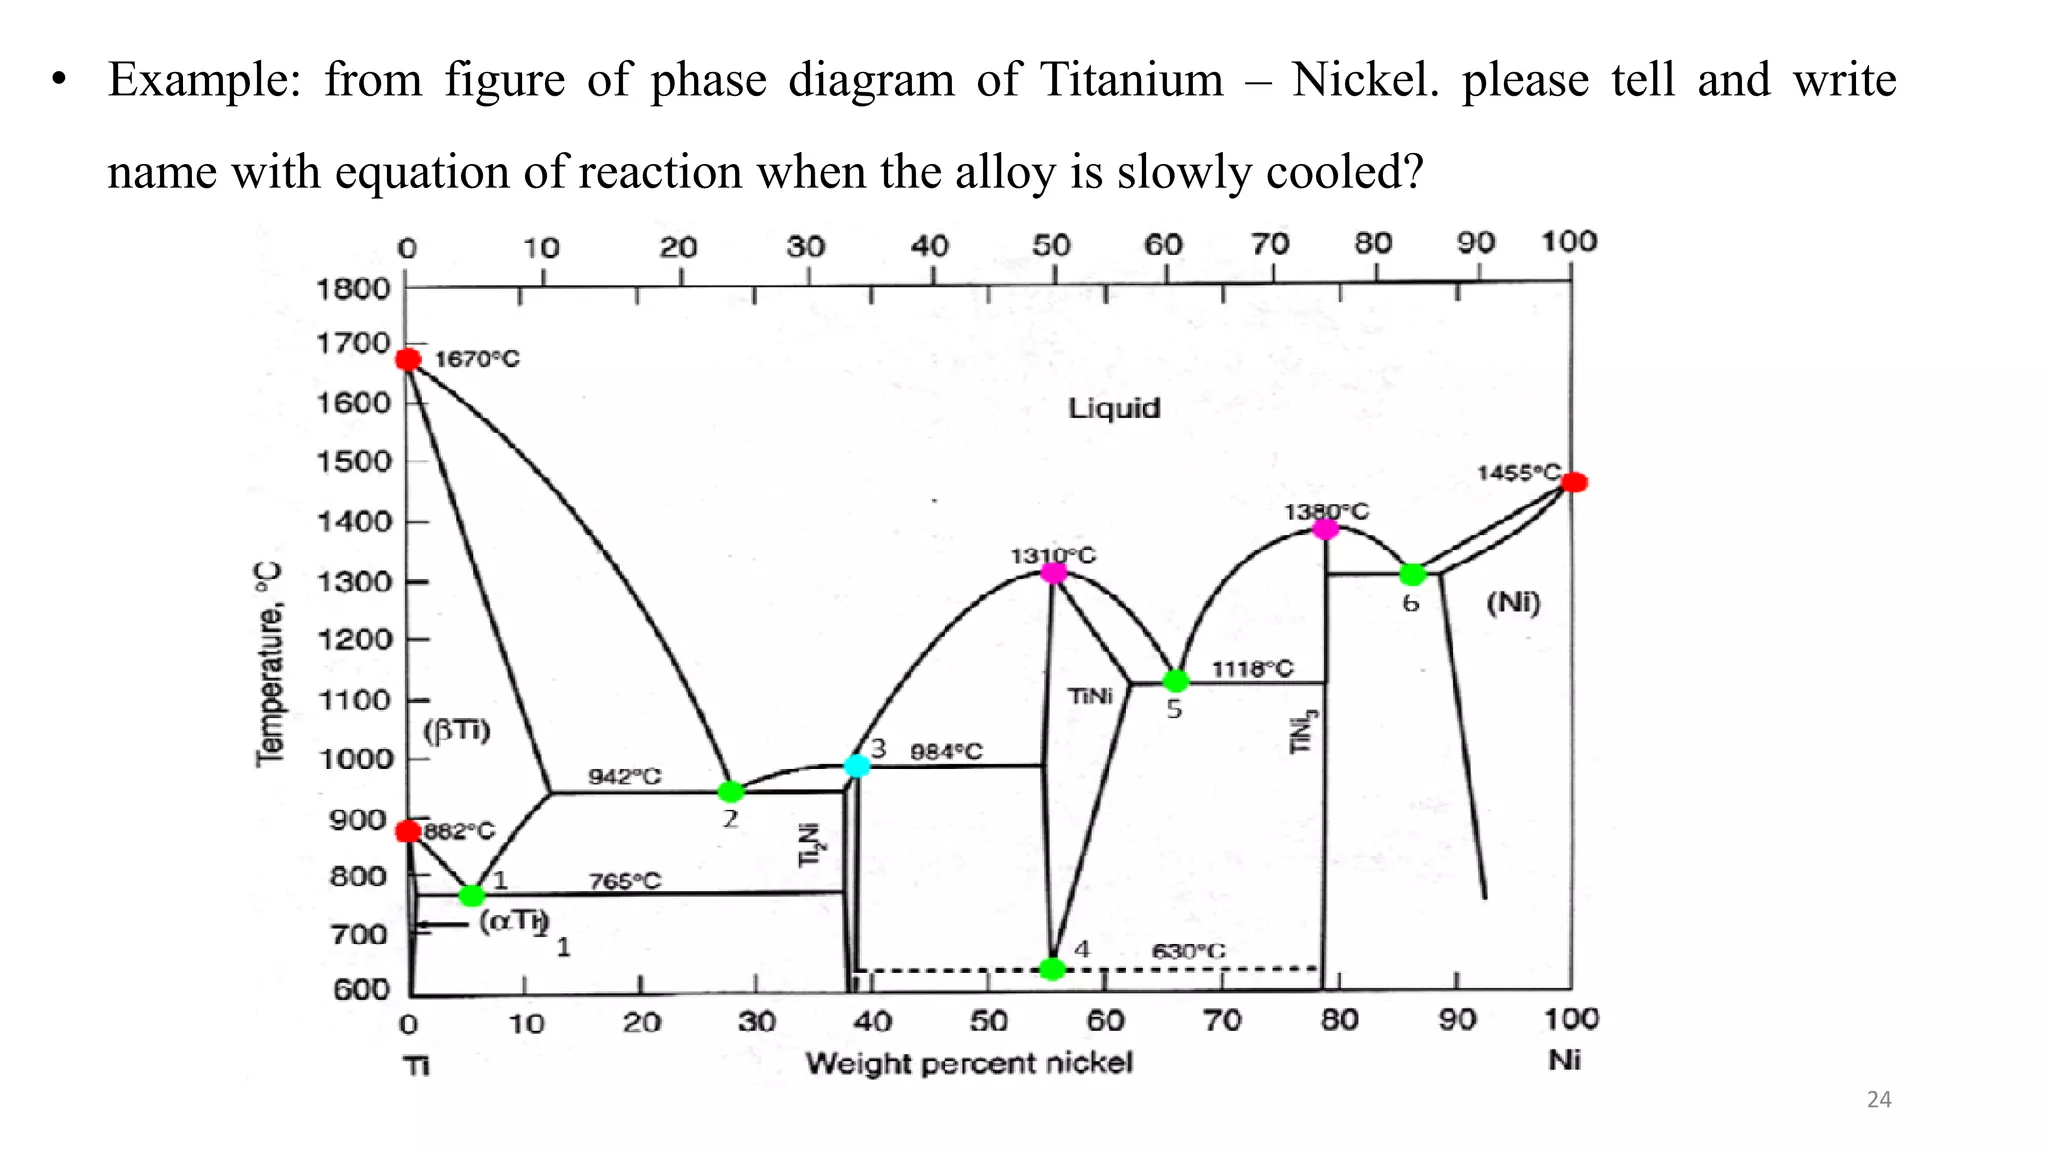
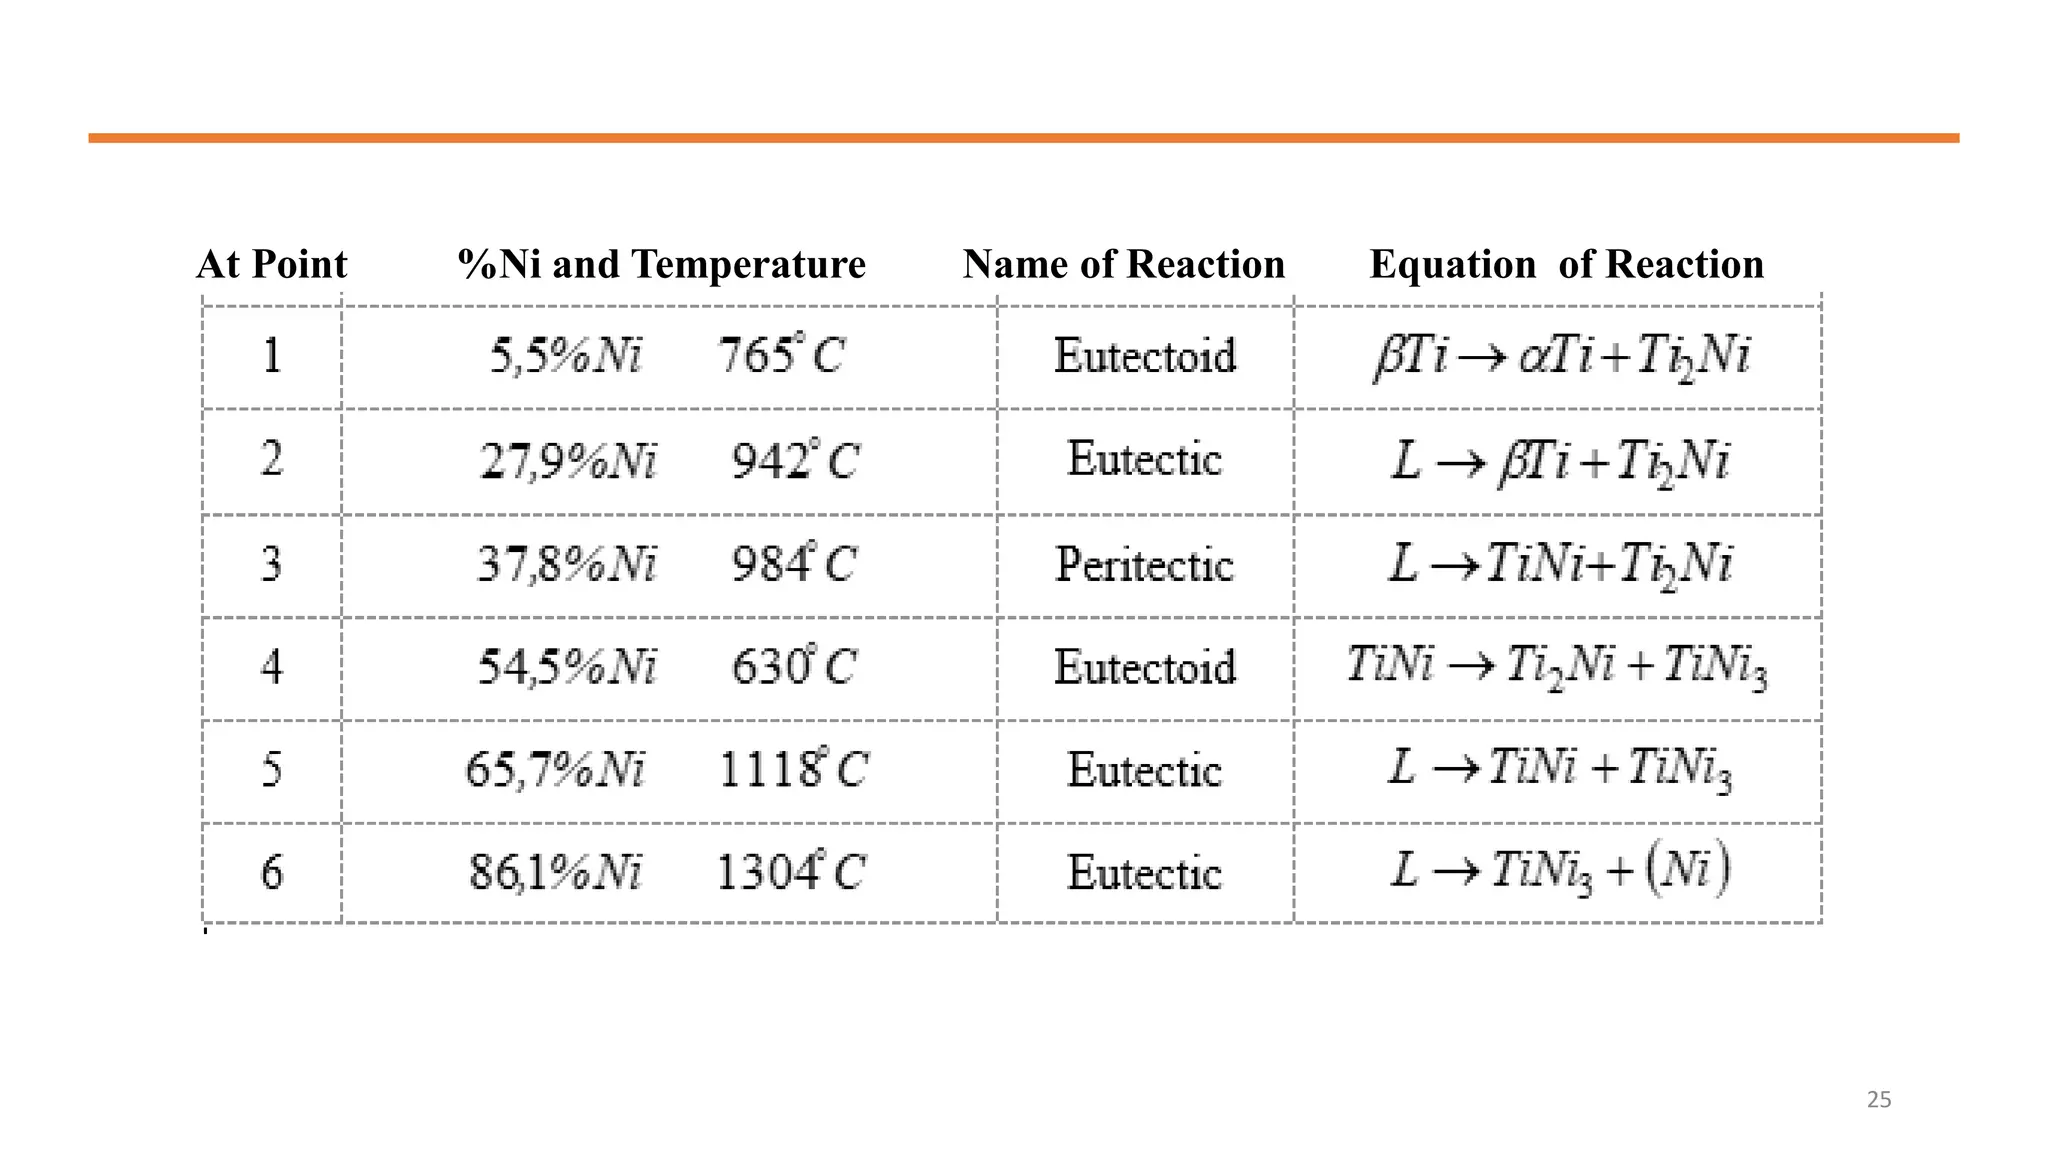

The document discusses phase diagrams and invariant reactions: 1) It defines phases and phase diagrams, explaining that phases are uniform in composition and state while phase diagrams show the phases present at different temperatures and compositions. 2) It discusses important points on phase diagrams like melting points, eutectic reactions where three phases meet, and lever rules for determining phase percentages. 3) Binary systems can have eutectic or solid solution diagrams depending on solubility. Eutectic diagrams have three distinct phases meeting at the eutectic point below melting temperatures. 4) Invariant reactions involve three phases meeting at a single point or line and include eutectic, eutectoid,