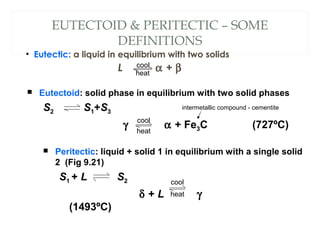
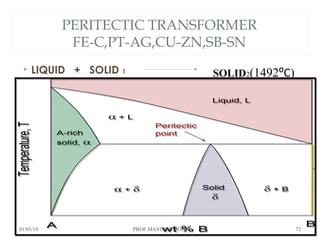
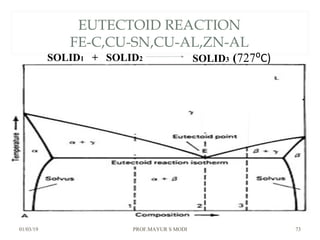
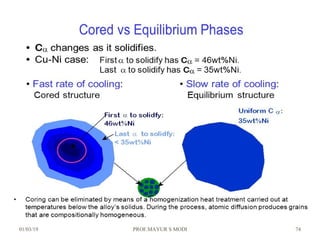
Downloaded 185 times


![01/03/19 PROF.MAYUR S MODI 50
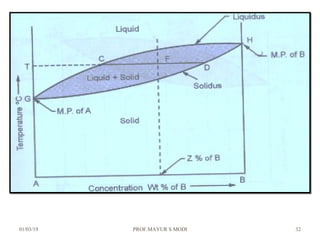
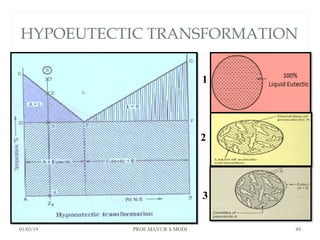
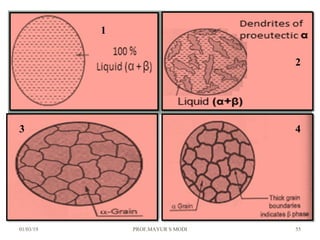
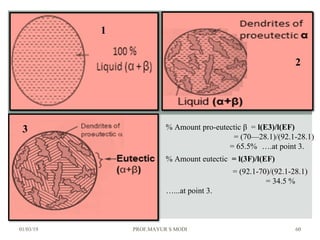
At just below point 3
The already separated pro-eutectic A remains unchanged.
% Amount pro-eutectic A = l(3E)/l(DE) ……….at point 3.
% Amount eutectic = l(D3)/l(DE) ……….at point 3.
At point 4
Total amount of metal A at point 4
=[amount of pro-eutectic A] + [amount of eutectic A]
=[amount of pro-eutectic A] + [ A in the eutectic x amount of eutectic]
=[l(3E)/l(DE)] + [l(EF)/l(DF) x l(D3)/l(DE)]](https://image.slidesharecdn.com/chapter3phasediagram-190103082949/85/Chapter-3-phase-diagram-50-320.jpg)
![01/03/19 PROF.MAYUR S MODI 52
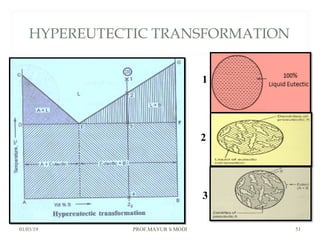
At just below point 3
The already separated pro-eutectic A remains unchanged.
% Amount pro-eutectic B = l(E3)/l(EF) ……….at point 3.
% Amount eutectic = l(3F)/l(EF) ……….at point 3.
At point 4
Total amount of metal A at point 4
=[amount of pro-eutectic B] + [amount of eutectic B]
=[amount of pro-eutectic B] + [ B in the eutectic x amount of
eutectic]
=[l(E3)/l(EF)] + [l(DE)/l(DF) x l(3F)/l(EF)]](https://image.slidesharecdn.com/chapter3phasediagram-190103082949/85/Chapter-3-phase-diagram-52-320.jpg)


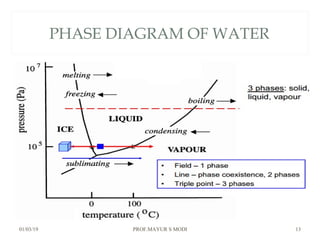
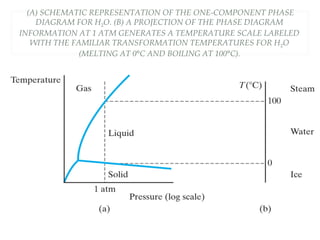
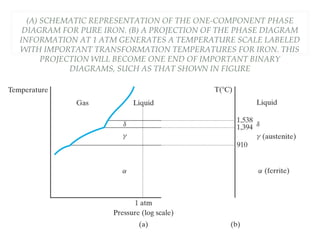
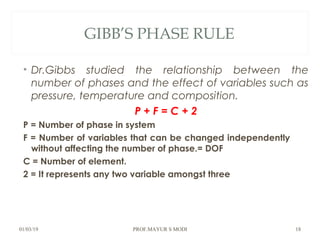
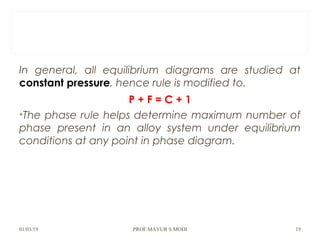
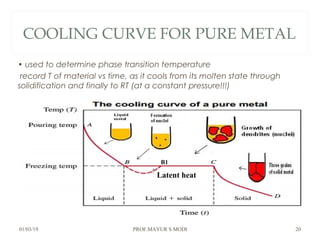
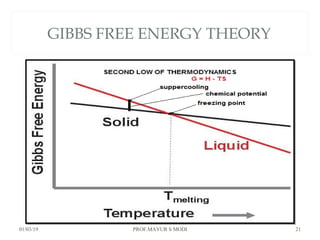
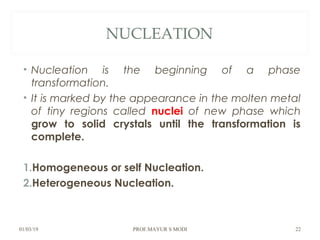
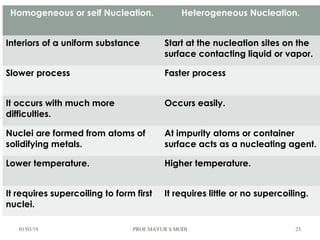
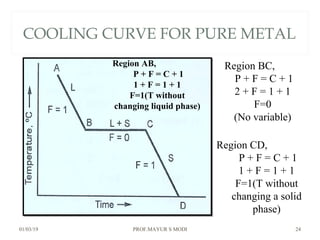
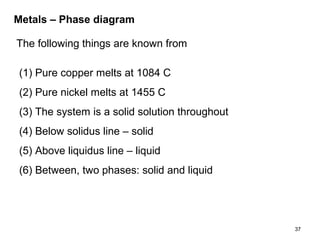
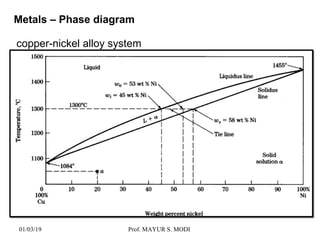
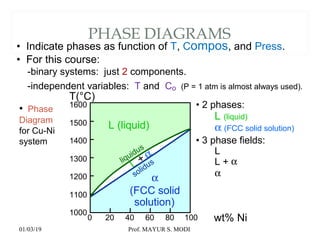
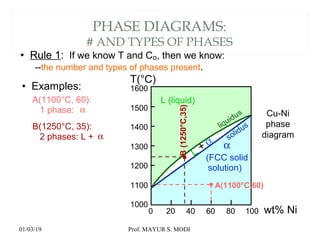
The document discusses the principles of phase diagrams in material science and metallurgy, emphasizing the relationship between material properties, microstructure, and equilibrium conditions. It explains key concepts such as phases, components, and the Gibbs phase rule, along with methods for analyzing phase transitions via cooling curves and the lever rule. Additionally, it highlights different types of equilibrium systems and the construction of phase diagrams for binary alloy systems.