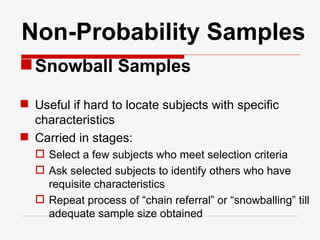
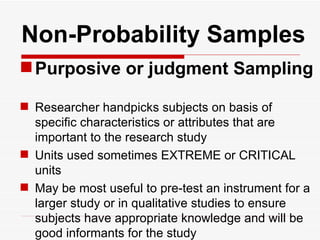
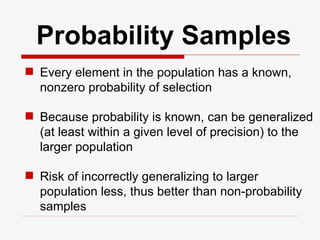
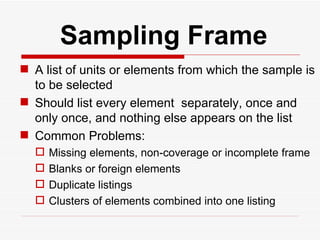
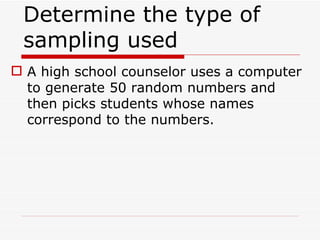
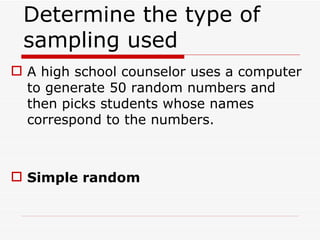
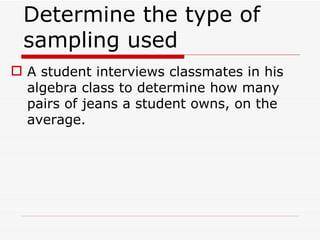
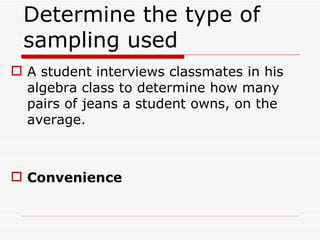
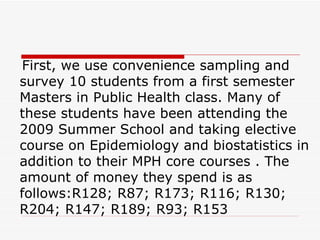
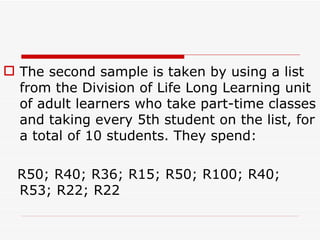
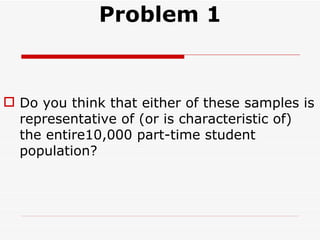
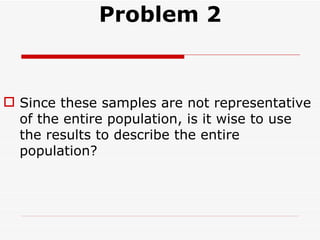
Downloaded 373 times
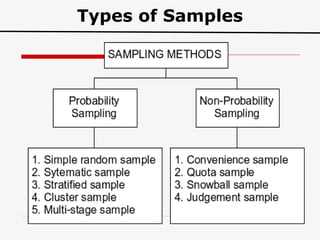
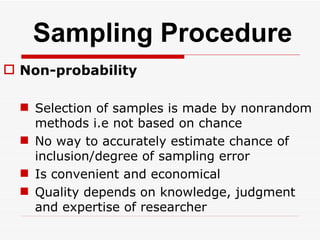
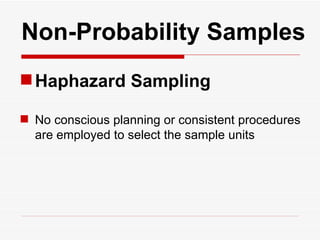
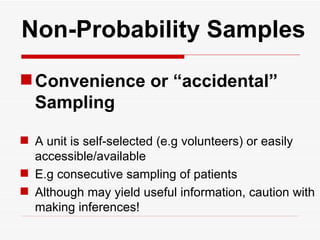
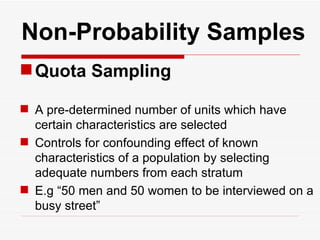

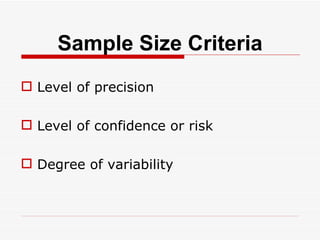

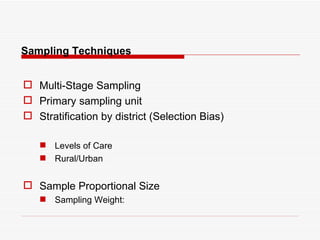
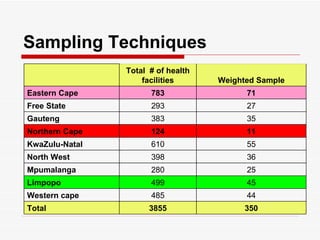
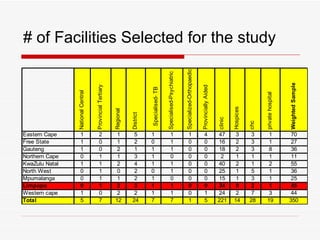


The document discusses the importance of sampling in research, particularly in the context of HIV-associated tuberculosis studies. It outlines various sampling methods, including non-probability and probability samples, and emphasizes the significance of representativity in sample selection to ensure accurate research outcomes. The document also details strategies for determining sample size and criteria for inclusion and exclusion in studies.


![Sampling1[1]](https://cdn.slidesharecdn.com/ss_thumbnails/sampling11-120509162836-phpapp02-thumbnail.jpg?width=640&height=640&fit=bounds)


