Overview of Confidence Intervals
Dr. S. A. Rizwan, M.D.
Public	Health	Specialist
SBCM,	Joint	Program	– Riyadh
Ministry	of	Health,	Kingdom	of	Saudi	Arabia
Learning	objectives
Demystifying statistics! – Lecture 9 SBCM, Joint Program – RiyadhSBCM, Joint Program – Riyadh
• Define	confidence	intervals
• Describe	their	use	in	statistical	inference
• Describe	and	apply	the	steps	in	calculating	CI
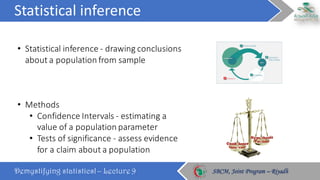
Statistical	inference
Demystifying statistics! – Lecture 9 SBCM, Joint Program – RiyadhSBCM, Joint Program – Riyadh
• Statistical	inference	- drawing	conclusions	
about	a	population	from	sample
• Methods
• Confidence	Intervals	- estimating	a	
value	of	a	population	parameter
• Tests	of	significance	- assess	evidence	
for	a	claim	about	a	population
Thought	exercises
Demystifying statistics! – Lecture 9 SBCM, Joint Program – RiyadhSBCM, Joint Program – Riyadh
• Estimation	of	a	population	mean
• Mean	score	obtained	by	this	class	in	
the	pretest exam
Thought	exercises
Demystifying statistics! – Lecture 9 SBCM, Joint Program – RiyadhSBCM, Joint Program – Riyadh
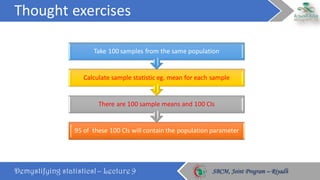
95	of		these	100	CIs	will	contain	the	population	parameter
There	are	100	sample	means	and	100	CIs
Calculate	sample	statistic	eg.	mean	for	each	sample
Take	100 samples	from	the	same	population
Thought	exercises
Demystifying statistics! – Lecture 9 SBCM, Joint Program – RiyadhSBCM, Joint Program – Riyadh
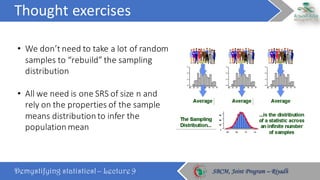
• We	don’t	need	to	take	a	lot	of	random	
samples	to	“rebuild”	the	sampling	
distribution
• All	we	need	is	one	SRS	of	size	n	and	
rely	on	the	properties	of	the	sample	
means	distribution	to	infer	the	
population	mean
Some	important	terms
Demystifying statistics! – Lecture 9 SBCM, Joint Program – RiyadhSBCM, Joint Program – Riyadh
• Point	estimate
• Standard	error
• Confidence	level
Revise:	standard	deviation
Demystifying statistics! – Lecture 9 SBCM, Joint Program – RiyadhSBCM, Joint Program – Riyadh
€
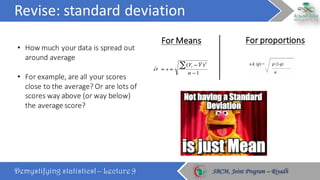
ˆσ = s =
(Yi −Y )2
∑
n −1
• How	much	your	data	is	spread	out	
around	average
• For	example,	are	all	your	scores	
close	to	the	average?	Or	are	lots	of	
scores	way	above	(or	way	below)	
the	average	score?
For	Means For	proportions
Revise:	standard	error
Demystifying statistics! – Lecture 9 SBCM, Joint Program – RiyadhSBCM, Joint Program – Riyadh
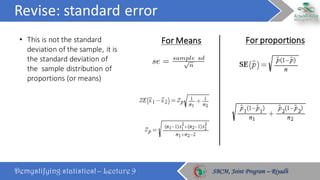
• This	is	not	the	standard	
deviation	of	the	sample,	it	is	
the	standard	deviation	of	
the		sample	distribution	of	
proportions	(or	means)
For	Means For	proportions
Revise:	standard	error
Demystifying statistics! – Lecture 9 SBCM, Joint Program – RiyadhSBCM, Joint Program – Riyadh
Why	CI?
Demystifying statistics! – Lecture 9 SBCM, Joint Program – RiyadhSBCM, Joint Program – Riyadh
• A	point	estimate	provides	no	information	about	the	
precision	and	reliability	of	estimation
• A	point	estimate	says	nothing	about	how	close	it	
might	be	to	μ
• An	alternative	to	reporting	a	single	sensible	value	is	
to	calculate	and	report	an	entire	interval	of	plausible	
values	– a	confidence	interval	(CI)
What	is	CI?
Demystifying statistics! – Lecture 9 SBCM, Joint Program – RiyadhSBCM, Joint Program – Riyadh
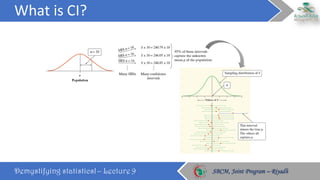
• An	interval	gives	a	range	of	values:
• Takes	into	consideration	variation	in	sample	
statistics	from	sample	to	sample
• Based	on	observations	from	1	sample
• Gives	information	about	closeness	to	unknown	
population	parameters
• Stated	in	terms	of	level	of	confidence.	
• Can	never	be	100%	confident
• An	interval	of	values	computed	from	the	
sample,	that	is	almost	sure	to	cover	the	true	
population	value
What	is	CI?
Demystifying statistics! – Lecture 9 SBCM, Joint Program – RiyadhSBCM, Joint Program – Riyadh
General	format	of	CI
Demystifying statistics! – Lecture 9 SBCM, Joint Program – RiyadhSBCM, Joint Program – Riyadh
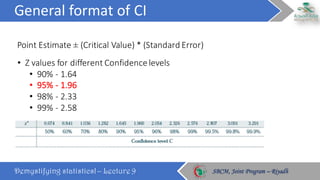
• Z	values	for	different	Confidence	levels
• 90%	- 1.64
• 95%	- 1.96
• 98%	- 2.33
• 99%	- 2.58
Point	Estimate	± (Critical	Value)	*	(Standard	Error)
Various	interpretations	of	CI
Demystifying statistics! – Lecture 9 SBCM, Joint Program – RiyadhSBCM, Joint Program – Riyadh
• In	95%	of	the	samples	we	take,	the	true	population	
proportion	(or	mean)	will	be	in	the	interval
• We	are	95%	confident	that	the	true	population	
proportion	(or	mean)	will	be	in	the	interval
• In	95%	of	all	possible	samples	of	this	size	n,	µ	will	
indeed	fall	in	our	confidence	interval
Various	interpretations	of	CI
Demystifying statistics! – Lecture 9 SBCM, Joint Program – RiyadhSBCM, Joint Program – Riyadh
• In	only	5%	of	samples	would	sample	mean	be	farther	from	µ
• To	say	that	we	are	95%	confident	is	shorthand	for	“95%	of	all	
possible	samples	of	a	given	size	from	this	population	 will	result	
in	an	interval	that	captures	the	unknown	parameter.”
• To	interpret	a	C%	confidence	interval	for	an	unknown	
parameter,	say,	“We	are	C%	confident	that	the	interval	from	
_____	to	_____	captures	the	actual	value	of	the	population	
parameter”
Various	interpretations	of	CI
Demystifying statistics! – Lecture 9 SBCM, Joint Program – RiyadhSBCM, Joint Program – Riyadh
• A	confidence	interval	provides	additional	
information	about	variability
• For	a	95%	confidence	interval	about	95%	of	the	
similarly	constructed	intervals	will	contain	the	
parameter	being	estimated.		
• Also	95%	of	the	sample	means	for	a	specified	
sample	size	will	lie	within	1.96	standard	deviations	
of	the	hypothesized	population
Various	interpretations	of	CI
Demystifying statistics! – Lecture 9 SBCM, Joint Program – RiyadhSBCM, Joint Program – Riyadh
• In	general,	we	construct	such	intervals	so	that,	
should	we	repeat	the	process	a	large	number	of	
times,	then	95%,	for	a	95%	confidence	interval,	of	
such	intervals	should	contain	the	population	
parameter	being	estimated	by	the	point	estimate	
and	the	confidence	interval
Various	interpretations	of	CI
Demystifying statistics! – Lecture 9 SBCM, Joint Program – RiyadhSBCM, Joint Program – Riyadh
• The	specific	interval	we	compute	in	any	given	situation	
may	or	may	not	contain	the	population	 parameter
• The	only	way	for	us	to	be	sure	that	the	population	
parameter	is	within	the	bounds	of	the	confidence	interval	
is	to	know	the	true	value	for	this	parameter
• Obviously,	if	we	knew	the	true	value,	we	would	not	
bother	to	go	through	the	process	of	guessing	at	the	truth	
with	estimates
Various	interpretations	of	CI
Demystifying statistics! – Lecture 9 SBCM, Joint Program – RiyadhSBCM, Joint Program – Riyadh
• Example:	0.05	(0.036,	0.064)
• Correct:	
• We	are	95%	confident	that	the	interval	from	0.036	to	0.064	actually	does	contain	the	true	value
• This	means	that	if	we	were	to	select	many	different	samples	of	size	1000	and	construct	a	95%	CI	
from	each	sample,	95%	of	the	resulting	intervals	would	contain	the	population	value
• (0.036,	0.064)	is	one	such	interval.	(Note	that	95%	refers	to	the	procedure	we	used	to	construct	
the	interval;	it	does	not	refer	to	the	population	 value)
• Wrong:	There	is	a	95%	chance	that	the	population	value	falls	between	0.036	and	0.064.	(Note	that	p	
is	not	random,	it	is	a	fixed	but	unknown	number)
Various	interpretations	of	CI
Demystifying statistics! – Lecture 9 SBCM, Joint Program – RiyadhSBCM, Joint Program – Riyadh
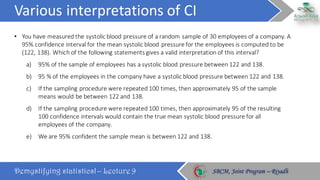
• You	have	measured	the	systolic	blood	pressure	of	a	random	sample	of	30	employees	of	a	company.	A	
95%	confidence	interval	for	the	mean	systolic	blood	pressure	for	the	employees	is	computed	to	be	
(122,	138).	Which	of	the	following	statements	gives	a	valid	interpretation	of	this	interval?
a) 95%	of	the	sample	of	employees	has	a	systolic	blood	pressure	between	122	and	138.
b) 95	%	of	the	employees	in	the	company	have	a	systolic	blood	pressure	between	122	and	138.
c) If	the	sampling	procedure	were	repeated	100	times,	then	approximately	95	of	the	sample	
means	would	be	between	122	and	138.
d) If	the	sampling	procedure	were	repeated	100	times,	then	approximately	95	of	the	resulting	
100	confidence	intervals	would	contain	the	true	mean	systolic	blood	pressure	for	all	
employees	of	the	company.
e) We	are	95%	confident	the	sample	mean	is	between	122	and	138.
Various	interpretations	of	CI
Demystifying statistics! – Lecture 9 SBCM, Joint Program – RiyadhSBCM, Joint Program – Riyadh
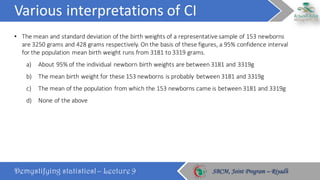
• The	mean	and	standard	deviation	of	the	birth	weights	of	a	representative	sample	of	153	newborns
are	3250	grams	and	428	grams	respectively.	On	the	basis	of	these	figures,	a	95%	confidence	interval	
for	the	population	mean	birth	weight	runs	from	3181	to	3319	grams.
a) About	95%	of	the	individual	newborn birth	weights	are	between	3181	and	3319g
b) The	mean	birth	weight	for	these	153	newborns is	probably	between	3181	and	3319g
c) The	mean	of	the	population	from	which	the	153	newborns came	is	between	3181	and	3319g
d) None	of	the	above
Various	interpretations	of	CI
Demystifying statistics! – Lecture 9 SBCM, Joint Program – RiyadhSBCM, Joint Program – Riyadh
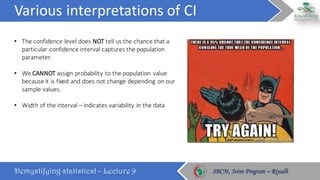
• The	confidence	level	does	NOT tell	us	the	chance	that	a	
particular	confidence	interval	captures	the	population	
parameter.
• We	CANNOT assign	probability	to	the	population	value	
because	it	is	fixed	and	does	not	change	depending	on	our	
sample	values.
• Width	of	the	interval	– indicates	variability	in	the	data
Various	interpretations	of	CI
Demystifying statistics! – Lecture 9 SBCM, Joint Program – RiyadhSBCM, Joint Program – Riyadh
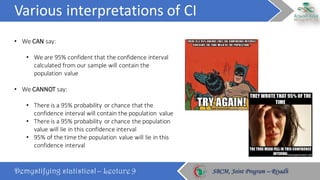
• We	CAN say:
• We	are	95%	confident	that	the	confidence	interval	
calculated	from	our	sample	will	contain	the	
population	value
• We	CANNOT say:
• There	is	a	95%	probability	or	chance	that	the	
confidence	interval	will	contain	the	population	 value
• There	is	a	95%	probability	or	chance	the	population	
value	will	lie	in	this	confidence	interval
• 95%	of	the	time	the	population	value	will	lie	in	this	
confidence	interval
Interpretation	of	CI	in	comparative	situations
Demystifying statistics! – Lecture 9 SBCM, Joint Program – RiyadhSBCM, Joint Program – Riyadh
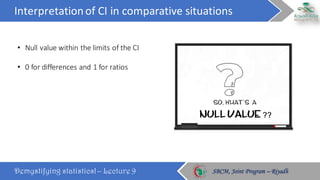
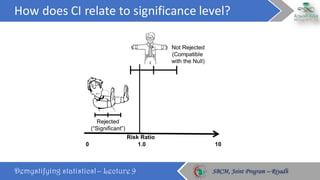
• Null	value	within	the	limits	of	the	CI	
• 0	for	differences	and	1	for	ratios
Interpretation	of	CI	in	comparative	situations
Demystifying statistics! – Lecture 9 SBCM, Joint Program – RiyadhSBCM, Joint Program – Riyadh
• The	mother	who	smoke	had	significantly	
higher	risk	(RR=	2.1;	1.8,	2.6,	p=0.01)	of	having	
LBW	babies	and	compared	to	those	who	did	
not	smoke
• Does	the	interval	contain	null	value=	No;	
association	is	significant
• Width	of	the	interval- variability	in	the	
estimate	was	less
Interpretation	of	CI	in	comparative	situations
Demystifying statistics! – Lecture 9 SBCM, Joint Program – RiyadhSBCM, Joint Program – Riyadh
• The	mother	who	smoke	had	significantly	
higher	risk	(RR=	2.1,	0.8,	4.9,	p=0.06)	of	having	
LBW	babies	and	compared	to	those	who	did	
not	smoke
• Does	the	interval	contain	null	value=	Yes;	
association	is	insignificant
• Width	of	the	interval=	high	variability	in	the	
sample	estimate
Thought	exercise
Demystifying statistics! – Lecture 9 SBCM, Joint Program – RiyadhSBCM, Joint Program – Riyadh
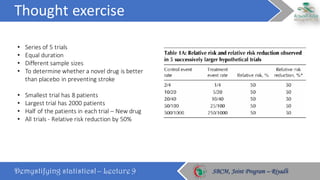
• Series	of	5	trials	
• Equal	duration		
• Different	sample	sizes
• To	determine	whether	a	novel	drug	is	better	
than	placebo	in	preventing	stroke
• Smallest	trial	has	8	patients
• Largest	trial	has	2000	patients
• Half	of	the	patients	in	each	trial	– New	drug
• All	trials	- Relative	risk	reduction	by	50%
Thought	exercise
Demystifying statistics! – Lecture 9 SBCM, Joint Program – RiyadhSBCM, Joint Program – Riyadh
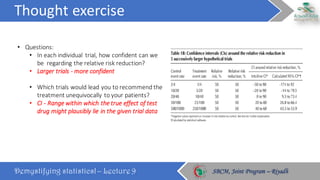
• Questions:
• In	each	individual	 trial,	how	confident	can	we	
be		regarding	the	relative	risk	reduction?
• Larger	trials	- more	confident
• Which	trials	would	lead	you	to	recommend	the	
treatment	unequivocally	to	your	patients?
• CI	- Range	within	which	the	true	effect	of	test	
drug	might	plausibly	lie	in	the	given	trial	data
Factors	affecting	CI
Demystifying statistics! – Lecture 9 SBCM, Joint Program – RiyadhSBCM, Joint Program – Riyadh
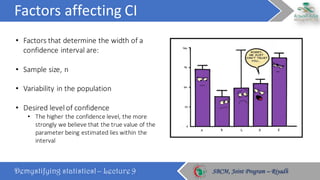
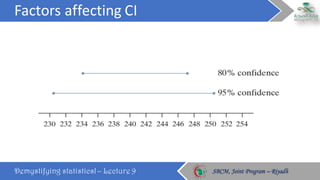
• Factors	that	determine	the	width	of	a	
confidence	interval	are:
• Sample	size,	n
• Variability	in	the	population
• Desired	level	of	confidence
• The	higher	the	confidence	level,	the	more	
strongly	we	believe	that	the	true	value	of	the	
parameter	being	estimated	lies	within	the	
interval
Factors	affecting	CI
Demystifying statistics! – Lecture 9 SBCM, Joint Program – RiyadhSBCM, Joint Program – Riyadh
Assumptions	for	CI
Demystifying statistics! – Lecture 9 SBCM, Joint Program – RiyadhSBCM, Joint Program – Riyadh
• Random:	The	data	should	come	from	
a	well-designed	random	sample	or	
randomized	experiment.
Assumptions	for	CI
Demystifying statistics! – Lecture 9 SBCM, Joint Program – RiyadhSBCM, Joint Program – Riyadh
• Normal:	The	sampling	distribution	of	the	statistic	
is	approximately	Normal.
• For	means:	
• The	sampling	distribution	is	exactly	Normal	if	the	
population	distribution	is	Normal.	
• When	the	population	distribution	is	not	Normal,	
then	the	central	limit	theorem	tells	us	the	
sampling	distribution	will	be	approximately	
Normal	if	n	is	sufficiently	large	(n	≥	30).
• For	proportions:	
• We	can	use	the	Normal	approximation	to	the	
sampling	distribution	as	long	as	np	≥	10	and	n(1	–
p)	≥	10.
Assumptions	for	CI
Demystifying statistics! – Lecture 9 SBCM, Joint Program – RiyadhSBCM, Joint Program – Riyadh
• Independent:	
• Individual	observations	are	independent
How	does	CI	relate	to	sample	size?
Demystifying statistics! – Lecture 9 SBCM, Joint Program – RiyadhSBCM, Joint Program – Riyadh
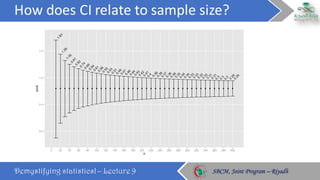
• Cost	is	directly	proportional	to	sample	size,	so	we	generally	want	the	minimum	
sample	to	do	the	job
• Estimating	minimum	sample	size	is	commonly	done	with	population	proportions
• With	population	proportions,	you	do	not	need	to	make	separate	guesses	about	the	
population	mean	and	standard	deviation
• With	population	proportions,	it	is	easy	to	identify	a	conservative	mean,	and	the	bias	
does	not	vary	much
How	does	CI	relate	to	sample	size?
Demystifying statistics! – Lecture 9 SBCM, Joint Program – RiyadhSBCM, Joint Program – Riyadh
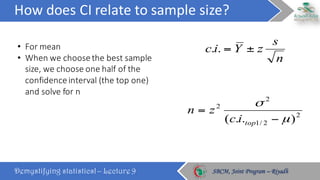
• For	mean
• When	we	choose	the	best	sample	
size,	we	choose	one	half	of	the	
confidence	interval	(the	top	one)	
and	solve	for	n
n
s
zYic ±=..
2
2/1
2
2
)..( µ
σ
−
=
topic
zn
How	does	CI	relate	to	sample	size?
Demystifying statistics! – Lecture 9 SBCM, Joint Program – RiyadhSBCM, Joint Program – Riyadh
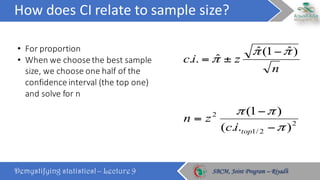
• For	proportion
• When	we	choose	the	best	sample	
size,	we	choose	one	half	of	the	
confidence	interval	(the	top	one)	
and	solve	for	n
n
zic
)ˆ1(ˆ
ˆ..
ππ
π
−
±=
2
2/1
2
)..(
)1(
π
ππ
−
−
=
topic
zn
How	does	CI	relate	to	sample	size?
Demystifying statistics! – Lecture 9 SBCM, Joint Program – RiyadhSBCM, Joint Program – Riyadh
How	does	CI	relate	to	significance	level?
Demystifying statistics! – Lecture 9 SBCM, Joint Program – RiyadhSBCM, Joint Program – Riyadh
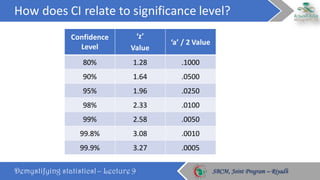
Confidence	
Level
‘z’	
Value
‘a’	/	2	Value
80% 1.28 .1000
90% 1.64 .0500
95% 1.96 .0250
98% 2.33 .0100
99% 2.58 .0050
99.8% 3.08 .0010
99.9% 3.27 .0005
How	does	CI	relate	to	significance	level?
Demystifying statistics! – Lecture 9 SBCM, Joint Program – RiyadhSBCM, Joint Program – Riyadh
Take	home	messages
Demystifying statistics! – Lecture 9 SBCM, Joint Program – RiyadhSBCM, Joint Program – Riyadh
• P	value,	critical	value,	alfa,	type	1	
error,	confidence	interval,	sample	size	
are	all	related	to	each	other
Thank	you!
Email	your	queries	to	sarizwan1986@outlook.com