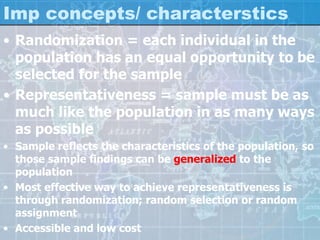
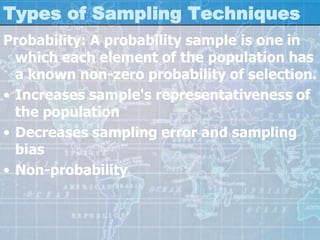
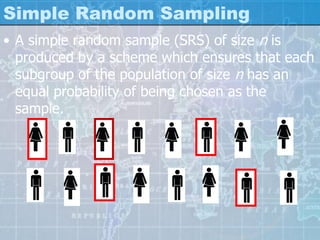
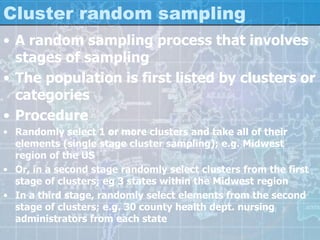
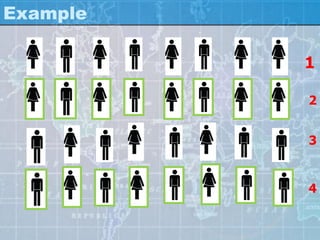
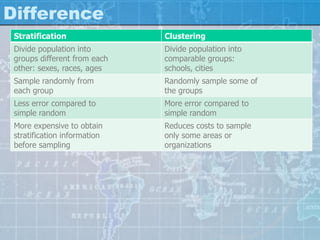
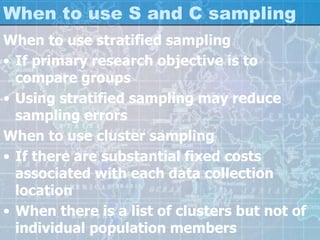
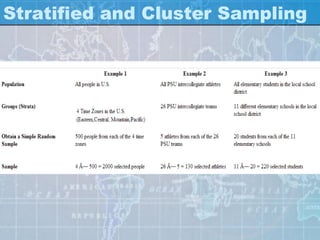
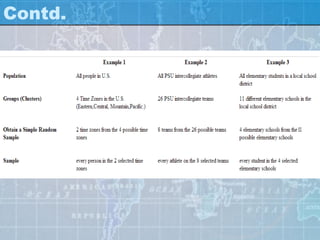
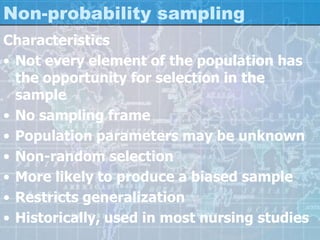
Sampling Methods
Sarika Sawant, PhD
SHPT School of Library Science
SNDT WU MUMBAI
Pre-PhD Course-1
Research Methodology in Education July 5, 2014
College of Education and Research
Concept of universe / population
Depend on research question
geographical terms (locality, municipality, district,
province, country or some intermediate
category) or
in sectoral terms (urban population, pottery
manufacturers, farmers)
• For example, research about voting in an
upcoming election would have a universe
comprising all voters. If the research was about
political parties' sponsorship of candidates, the
research would include all political parties.
Sampling
• A sample is “a smaller (but hopefully
representative) collection of units from a
population used to determine truths about that
population” (Field, 2005)
• Why need sampling?
• Resources (time, money) and workload
• Gives results with known accuracy that can be
calculated mathematically
Population
Sample
Population
Sample
Population
Sample
Population
• Definition - a complete set of elements
(persons or objects) that possess some
common characteristic defined by the
sampling criteria established by the
researcher
• Composed of two groups -
• target population &
• accessible population
Target population (universe)
• The entire group of people or objects to
which the researcher wishes to generalize
the study findings
• Meet set of criteria of interest to
researcher
• Examples
• All institutionalized elderly with Alzheimer's
• All people with AIDS
• All low birth weight infants
• All school-age children with asthma
• All pregnant teens
Accessible population
• the portion of the population to which the
researcher has reasonable access; may be
a subset of the target population
• May be limited to region, state, city,
county, or institution
• Examples
• All institutionalized elderly with Alzheimer's in St. Louis county
nursing homes
• All people with AIDS in the metropolitan St. Louis area
• All low birth weight infants admitted to the neonatal ICUs in St.
Louis city & county
• All school-age children with asthma treated in pediatric asthma
clinics in university-affiliated medical centers in the Midwest
• All pregnant teens in the state of Missouri
Sample/Sampling
• Sample = the selected elements (people
or objects) chosen for participation in a
study; people are referred to as subjects
or participants
• Sampling = the process of selecting a
group of people, events, behaviors, or
other elements with which to conduct a
study
• Sampling frame = a list of all the
elements in the population from which
the sample is drawn
Contd
• Sample could be extremely large if
population is national or international in
nature
• Frame is needed so that everyone in the
population is identified so they will have
an equal opportunity for selection as a
subject (element)
Examples
• A list of all institutionalized elderly with
Alzheimer's in St. Louis county nursing homes
affiliated with BJC
• A list of all people with AIDS in the metropolitan St.
Louis area who are members of the St. Louis Effort
for AIDS
• A list of all low birth weight infants admitted to the
neonatal ICUs in St. Louis city & county in 1998
• A list of all school-age children with asthma treated
in pediatric asthma clinics in university-affiliated
medical centers in the Midwest
• A list of all pregnant teens in the Henderson school
district
Imp concepts/ characterstics
• Randomization = each individual in the
population has an equal opportunity to be
selected for the sample
• Representativeness = sample must be as
much like the population in as many ways
as possible
• Sample reflects the characteristics of the population, so
those sample findings can be generalized to the
population
• Most effective way to achieve representativeness is
through randomization; random selection or random
assignment
• Accessible and low cost
Types of Sampling Techniques
Probability: A probability sample is one in
which each element of the population has
a known non-zero probability of selection.
• Increases sample's representativeness of
the population
• Decreases sampling error and sampling
bias
• Non-probability
Types of Probability Sample
• Simple random sampling
• Stratified sampling
• Cluster sampling
• Systematic sampling
Simple Random Sampling
• A simple random sample (SRS) of size n is
produced by a scheme which ensures that each
subgroup of the population of size n has an
equal probability of being chosen as the
sample.
Stratified Random Sampling
• Divide the population into "strata". There can
be any number of these. Then choose a simple
random sample from each stratum. Combine
those into the overall sample. That is a
stratified random sample.
• Example: Church A has 600 women and 400
men as members. One way to get a stratified
random sample of size 30 is to take a SRS of 18
women from the 600 women and another SRS
of 12 men from the 400 men.)
Example
Types of stratified sampling
• Proportional
• Disproportional
• In proportional stratified, the sample
proportions are made to be the same as
the population proportions on the
stratification variable(s).
• In disproportional stratified sampling, the
sample proportions are made to be
different from the proportions on the
stratification variable(s).
Systematic Random sampling
• A random sampling process in which
every kth (e.g. every 5th element) or
member of the population is selected for
the sample after a random start is
determined
• Example
• Population (N) = 2000, sample size (n) = 50, k=N/n, so k =
2000 ) 50 = 40
• Use a table of random numbers to determine the starting point for
selecting every 40th subject
• With list of the 2000 subjects in the sampling frame, go to the
starting point, and select every 40th name on the list until the
sample size is reached. Probably will have to return to the
beginning of the list to complete the selection of the sample.
Example
Cluster random sampling
• A random sampling process that involves
stages of sampling
• The population is first listed by clusters or
categories
• Procedure
• Randomly select 1 or more clusters and take all of their
elements (single stage cluster sampling); e.g. Midwest
region of the US
• Or, in a second stage randomly select clusters from the first
stage of clusters; eg 3 states within the Midwest region
• In a third stage, randomly select elements from the second
stage of clusters; e.g. 30 county health dept. nursing
administrators from each state
Example
1
2
4
3
Difference
Stratification Clustering
Divide population into
groups different from each
other: sexes, races, ages
Divide population into
comparable groups:
schools, cities
Sample randomly from
each group
Randomly sample some of
the groups
Less error compared to
simple random
More error compared to
simple random
More expensive to obtain
stratification information
before sampling
Reduces costs to sample
only some areas or
organizations
When to use S and C sampling
When to use stratified sampling
• If primary research objective is to
compare groups
• Using stratified sampling may reduce
sampling errors
When to use cluster sampling
• If there are substantial fixed costs
associated with each data collection
location
• When there is a list of clusters but not of
individual population members
Stratified and Cluster Sampling
Contd.
Non-probability sampling
Characteristics
• Not every element of the population has
the opportunity for selection in the
sample
• No sampling frame
• Population parameters may be unknown
• Non-random selection
• More likely to produce a biased sample
• Restricts generalization
• Historically, used in most nursing studies
Types of non probability
• Convenience
• Quota
• Purposive
• Snowball
Convenience
• Selection of the most readily available
people or objects for a study
• No way to determine representativeness
• Saves time and money
• E.g At the time of meetings, demos,
training, clinics, malls etc.
Quota
• Selection of sample to reflect certain
characteristics of the population
• Similar to stratified but does not involve
random selection
• Quotas for subgroups (proportions) are
established
• E.g. 50 males & 50 females; recruit the
first 50 men and first 50 women that
meet inclusion criteria
Purposive
• - aka judgmental or expert's choice
sampling
• Researcher uses personal judgement to
select subjects that are considered to be
representative of the population
• Handpicked subjects
• E. g Columbia faculty who have won Nobel
Prizes
Snowball
• Also known as network sampling
• Subjects refer the researcher to others
who might be recruited as subjects
• E.g. Homeless people, drug use in school,
Sample Size
• General rule - as large as possible to increase the
representativeness of the sample
• Increased size decreases sampling error
• Relatively small samples in qualitative, exploratory,
case studies, experimental and quasi-experimental
studies
• Descriptive studies need large samples; e.g. 10 subjects
for each item on the questionnaire or interview guide
• As the number of variables studied increases, the
sample size also needs to increase in order to detect
significant relationships or differences
Large samples are needed if:
• There are many uncontrolled variables
• Small differences are expected in the
sample/population on variables of
interest
• The sample is divided into subgroups
• Dropout rate (mortality) is expected to be
high
• Statistical tests used require minimum
sample or subgroup size
Stages in sampling
1.Define the population
2.Identify the sampling frame
3.Select a sampling design or procedure
4.Determine the sample size
5.Draw the sample
Quiz: Case study 1
• A survey is conducted on household water
supply in a district comprising 2,000
households, of which 400 (or 20%) are urban
and 1,600 (or 80%) are rural. It is suspected
that in urban areas the access to safe water
sources is much more satisfactory than in rural
areas (Figure 15.5). A decision is made to
sample 200 households altogether, but to
include 100 urban households and 100 rural
households.
• Is this sample a proportionate or a
disproportionate stratified sample?
Ans
• It is disproportionate. 100 urban
households out of a total of 400 means that 1
in 4 (one quarter) of the urban households
were included in the sample. 100 rural
households out of a total of 1,600 means that
only 1 in 16 rural households were sampled.
Case study 2
• A systematic sample is to be selected from
1,200 students from the same school. The
required sample size is 100. The study
population is 1,200 and the sample size is 100,
so a systematic sampling interval is found by
dividing the study population by the sample
size:
• 1,200 ÷ 100 = 12
• The sampling interval is therefore 12.
Ans
• The number of the first student to be included
in the sample should be chosen randomly, for
example by blindly picking one out of twelve
pieces of paper, numbered 1 to 12. If number 6
is picked, then every twelfth student will be
included in the sample, starting with student
number 6, until 100 students have been
selected.
• Ans: 6, 18, 30 and 42
Quiz: Objective
• Which of the following is not an example of
probability sampling?
• a. simple random sampling
• b. cluster sampling
• c. convenience sampling
• d. stratified sampling
Quiz
• Which of the following surveys would have the
smallest margin of error?
• a. a sample size of n = 1,600 from a
population of 50 million
• b. a sample size of n = 500 from a
population of 5 billion
• c. a sample size of n = 100 from a
population of 10 million
Quiz
• In order to survey the opinions of its
customers, a restaurant chain obtained a
random sample of 30 customers from each
restaurant in the chain. Each selected customer
was asked to fill out a survey. Which one of the
following sampling plans was used in this
survey?
• a. cluster sampling
• b. stratified sampling
References
• Encyclopedia of Survey Research Methods. (2008). 2455 Teller Road, Thousand
Oaks California 91320 United States of America: Sage Publications, Inc. Retrieved from
http://www.crossref.org/iPage?doi=10.4135%2F9781412963947
• Gorard, S. (2010). Quantitative Methods in Educational Research : The Role of Numbers Made
Easy. London, GBR: Continuum International Publishing. Retrieved from
http://site.ebrary.com/lib/alltitles/docDetail.action?docID=10403771
• Ross, K. (ed.). (2005). Sample design for educational survey research . Retrieved from
http://www.unesco.org/iiep/PDF/TR_Mods/Qu_Mod3.pdf
• Mcmillan, James H. (1996). Educational Research: Fundamentals for the Consumer. Harper
Collins: New York. Retrieved from http://ww2.odu.edu/~jritz/attachments/edrefu.pdf
• Websites
• http://www.umsl.edu/~lindquists/sample.html
• http://www.ssc.wisc.edu/~oliver/SOC357/Lectures%20and%20Notes/SamplingBigSlides.pdf
• https://onlinecourses.science.psu.edu/stat100/node/18
• http://labspace.open.ac.uk/mod/oucontent/view.php?id=454418&section=1.5.3
• http://ccnmtl.columbia.edu/projects/qmss/samples_and_sampling/types_of_sampling.html
• http://classes.uleth.ca/200603/mgt3220y/PDF%20slides%20by%203/sampling%20design.p
df

Sampling methods

  • 1.
    Sampling Methods Sarika Sawant,PhD SHPT School of Library Science SNDT WU MUMBAI Pre-PhD Course-1 Research Methodology in Education July 5, 2014 College of Education and Research
  • 2.
    Concept of universe/ population Depend on research question geographical terms (locality, municipality, district, province, country or some intermediate category) or in sectoral terms (urban population, pottery manufacturers, farmers) • For example, research about voting in an upcoming election would have a universe comprising all voters. If the research was about political parties' sponsorship of candidates, the research would include all political parties.
  • 3.
    Sampling • A sampleis “a smaller (but hopefully representative) collection of units from a population used to determine truths about that population” (Field, 2005) • Why need sampling? • Resources (time, money) and workload • Gives results with known accuracy that can be calculated mathematically Population Sample Population Sample Population Sample
  • 4.
    Population • Definition -a complete set of elements (persons or objects) that possess some common characteristic defined by the sampling criteria established by the researcher • Composed of two groups - • target population & • accessible population
  • 5.
    Target population (universe) •The entire group of people or objects to which the researcher wishes to generalize the study findings • Meet set of criteria of interest to researcher • Examples • All institutionalized elderly with Alzheimer's • All people with AIDS • All low birth weight infants • All school-age children with asthma • All pregnant teens
  • 6.
    Accessible population • theportion of the population to which the researcher has reasonable access; may be a subset of the target population • May be limited to region, state, city, county, or institution • Examples • All institutionalized elderly with Alzheimer's in St. Louis county nursing homes • All people with AIDS in the metropolitan St. Louis area • All low birth weight infants admitted to the neonatal ICUs in St. Louis city & county • All school-age children with asthma treated in pediatric asthma clinics in university-affiliated medical centers in the Midwest • All pregnant teens in the state of Missouri
  • 7.
    Sample/Sampling • Sample =the selected elements (people or objects) chosen for participation in a study; people are referred to as subjects or participants • Sampling = the process of selecting a group of people, events, behaviors, or other elements with which to conduct a study • Sampling frame = a list of all the elements in the population from which the sample is drawn
  • 8.
    Contd • Sample couldbe extremely large if population is national or international in nature • Frame is needed so that everyone in the population is identified so they will have an equal opportunity for selection as a subject (element)
  • 9.
    Examples • A listof all institutionalized elderly with Alzheimer's in St. Louis county nursing homes affiliated with BJC • A list of all people with AIDS in the metropolitan St. Louis area who are members of the St. Louis Effort for AIDS • A list of all low birth weight infants admitted to the neonatal ICUs in St. Louis city & county in 1998 • A list of all school-age children with asthma treated in pediatric asthma clinics in university-affiliated medical centers in the Midwest • A list of all pregnant teens in the Henderson school district
  • 10.
    Imp concepts/ characterstics •Randomization = each individual in the population has an equal opportunity to be selected for the sample • Representativeness = sample must be as much like the population in as many ways as possible • Sample reflects the characteristics of the population, so those sample findings can be generalized to the population • Most effective way to achieve representativeness is through randomization; random selection or random assignment • Accessible and low cost
  • 11.
    Types of SamplingTechniques Probability: A probability sample is one in which each element of the population has a known non-zero probability of selection. • Increases sample's representativeness of the population • Decreases sampling error and sampling bias • Non-probability
  • 12.
    Types of ProbabilitySample • Simple random sampling • Stratified sampling • Cluster sampling • Systematic sampling
  • 13.
    Simple Random Sampling •A simple random sample (SRS) of size n is produced by a scheme which ensures that each subgroup of the population of size n has an equal probability of being chosen as the sample.
  • 14.
    Stratified Random Sampling •Divide the population into "strata". There can be any number of these. Then choose a simple random sample from each stratum. Combine those into the overall sample. That is a stratified random sample. • Example: Church A has 600 women and 400 men as members. One way to get a stratified random sample of size 30 is to take a SRS of 18 women from the 600 women and another SRS of 12 men from the 400 men.)
  • 15.
  • 16.
    Types of stratifiedsampling • Proportional • Disproportional • In proportional stratified, the sample proportions are made to be the same as the population proportions on the stratification variable(s). • In disproportional stratified sampling, the sample proportions are made to be different from the proportions on the stratification variable(s).
  • 17.
    Systematic Random sampling •A random sampling process in which every kth (e.g. every 5th element) or member of the population is selected for the sample after a random start is determined • Example • Population (N) = 2000, sample size (n) = 50, k=N/n, so k = 2000 ) 50 = 40 • Use a table of random numbers to determine the starting point for selecting every 40th subject • With list of the 2000 subjects in the sampling frame, go to the starting point, and select every 40th name on the list until the sample size is reached. Probably will have to return to the beginning of the list to complete the selection of the sample.
  • 18.
  • 19.
    Cluster random sampling •A random sampling process that involves stages of sampling • The population is first listed by clusters or categories • Procedure • Randomly select 1 or more clusters and take all of their elements (single stage cluster sampling); e.g. Midwest region of the US • Or, in a second stage randomly select clusters from the first stage of clusters; eg 3 states within the Midwest region • In a third stage, randomly select elements from the second stage of clusters; e.g. 30 county health dept. nursing administrators from each state
  • 20.
  • 21.
    Difference Stratification Clustering Divide populationinto groups different from each other: sexes, races, ages Divide population into comparable groups: schools, cities Sample randomly from each group Randomly sample some of the groups Less error compared to simple random More error compared to simple random More expensive to obtain stratification information before sampling Reduces costs to sample only some areas or organizations
  • 22.
    When to useS and C sampling When to use stratified sampling • If primary research objective is to compare groups • Using stratified sampling may reduce sampling errors When to use cluster sampling • If there are substantial fixed costs associated with each data collection location • When there is a list of clusters but not of individual population members
  • 23.
  • 24.
  • 25.
    Non-probability sampling Characteristics • Notevery element of the population has the opportunity for selection in the sample • No sampling frame • Population parameters may be unknown • Non-random selection • More likely to produce a biased sample • Restricts generalization • Historically, used in most nursing studies
  • 26.
    Types of nonprobability • Convenience • Quota • Purposive • Snowball
  • 27.
    Convenience • Selection ofthe most readily available people or objects for a study • No way to determine representativeness • Saves time and money • E.g At the time of meetings, demos, training, clinics, malls etc.
  • 28.
    Quota • Selection ofsample to reflect certain characteristics of the population • Similar to stratified but does not involve random selection • Quotas for subgroups (proportions) are established • E.g. 50 males & 50 females; recruit the first 50 men and first 50 women that meet inclusion criteria
  • 29.
    Purposive • - akajudgmental or expert's choice sampling • Researcher uses personal judgement to select subjects that are considered to be representative of the population • Handpicked subjects • E. g Columbia faculty who have won Nobel Prizes
  • 30.
    Snowball • Also knownas network sampling • Subjects refer the researcher to others who might be recruited as subjects • E.g. Homeless people, drug use in school,
  • 31.
    Sample Size • Generalrule - as large as possible to increase the representativeness of the sample • Increased size decreases sampling error • Relatively small samples in qualitative, exploratory, case studies, experimental and quasi-experimental studies • Descriptive studies need large samples; e.g. 10 subjects for each item on the questionnaire or interview guide • As the number of variables studied increases, the sample size also needs to increase in order to detect significant relationships or differences
  • 32.
    Large samples areneeded if: • There are many uncontrolled variables • Small differences are expected in the sample/population on variables of interest • The sample is divided into subgroups • Dropout rate (mortality) is expected to be high • Statistical tests used require minimum sample or subgroup size
  • 33.
    Stages in sampling 1.Definethe population 2.Identify the sampling frame 3.Select a sampling design or procedure 4.Determine the sample size 5.Draw the sample
  • 34.
    Quiz: Case study1 • A survey is conducted on household water supply in a district comprising 2,000 households, of which 400 (or 20%) are urban and 1,600 (or 80%) are rural. It is suspected that in urban areas the access to safe water sources is much more satisfactory than in rural areas (Figure 15.5). A decision is made to sample 200 households altogether, but to include 100 urban households and 100 rural households. • Is this sample a proportionate or a disproportionate stratified sample?
  • 35.
    Ans • It isdisproportionate. 100 urban households out of a total of 400 means that 1 in 4 (one quarter) of the urban households were included in the sample. 100 rural households out of a total of 1,600 means that only 1 in 16 rural households were sampled.
  • 36.
    Case study 2 •A systematic sample is to be selected from 1,200 students from the same school. The required sample size is 100. The study population is 1,200 and the sample size is 100, so a systematic sampling interval is found by dividing the study population by the sample size: • 1,200 ÷ 100 = 12 • The sampling interval is therefore 12.
  • 37.
    Ans • The numberof the first student to be included in the sample should be chosen randomly, for example by blindly picking one out of twelve pieces of paper, numbered 1 to 12. If number 6 is picked, then every twelfth student will be included in the sample, starting with student number 6, until 100 students have been selected. • Ans: 6, 18, 30 and 42
  • 38.
    Quiz: Objective • Whichof the following is not an example of probability sampling? • a. simple random sampling • b. cluster sampling • c. convenience sampling • d. stratified sampling
  • 39.
    Quiz • Which ofthe following surveys would have the smallest margin of error? • a. a sample size of n = 1,600 from a population of 50 million • b. a sample size of n = 500 from a population of 5 billion • c. a sample size of n = 100 from a population of 10 million
  • 40.
    Quiz • In orderto survey the opinions of its customers, a restaurant chain obtained a random sample of 30 customers from each restaurant in the chain. Each selected customer was asked to fill out a survey. Which one of the following sampling plans was used in this survey? • a. cluster sampling • b. stratified sampling
  • 41.
    References • Encyclopedia ofSurvey Research Methods. (2008). 2455 Teller Road, Thousand Oaks California 91320 United States of America: Sage Publications, Inc. Retrieved from http://www.crossref.org/iPage?doi=10.4135%2F9781412963947 • Gorard, S. (2010). Quantitative Methods in Educational Research : The Role of Numbers Made Easy. London, GBR: Continuum International Publishing. Retrieved from http://site.ebrary.com/lib/alltitles/docDetail.action?docID=10403771 • Ross, K. (ed.). (2005). Sample design for educational survey research . Retrieved from http://www.unesco.org/iiep/PDF/TR_Mods/Qu_Mod3.pdf • Mcmillan, James H. (1996). Educational Research: Fundamentals for the Consumer. Harper Collins: New York. Retrieved from http://ww2.odu.edu/~jritz/attachments/edrefu.pdf • Websites • http://www.umsl.edu/~lindquists/sample.html • http://www.ssc.wisc.edu/~oliver/SOC357/Lectures%20and%20Notes/SamplingBigSlides.pdf • https://onlinecourses.science.psu.edu/stat100/node/18 • http://labspace.open.ac.uk/mod/oucontent/view.php?id=454418&section=1.5.3 • http://ccnmtl.columbia.edu/projects/qmss/samples_and_sampling/types_of_sampling.html • http://classes.uleth.ca/200603/mgt3220y/PDF%20slides%20by%203/sampling%20design.p df