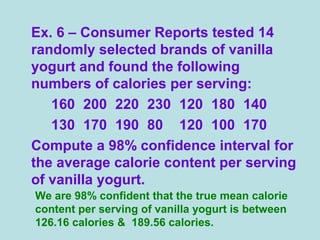
Downloaded 402 times
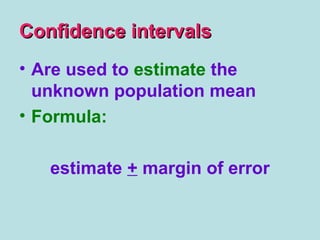
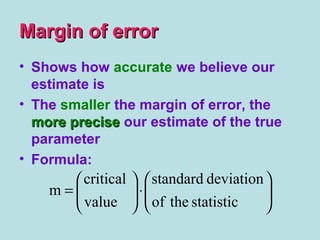
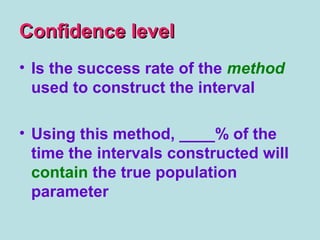
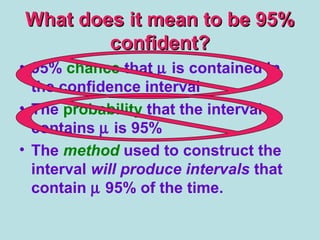
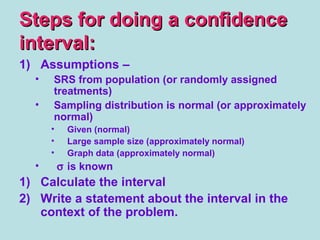

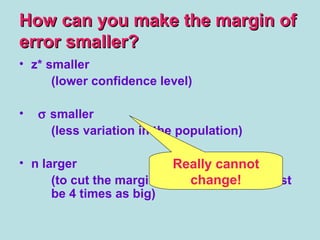
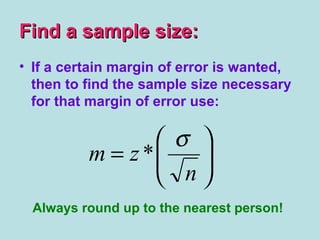
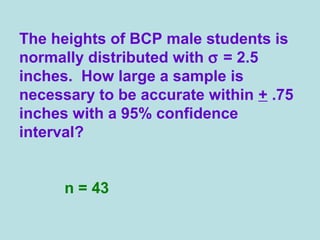
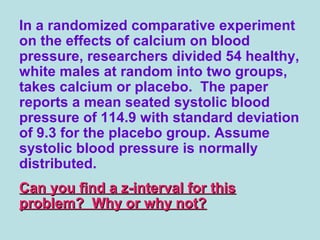
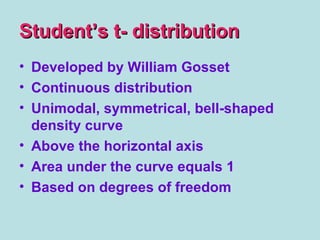
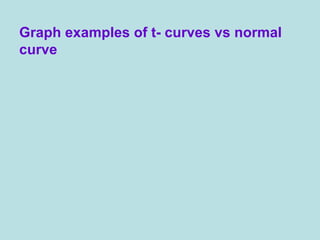
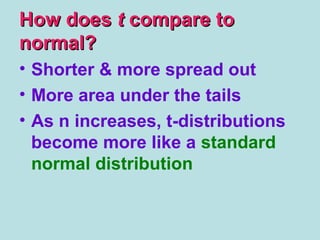
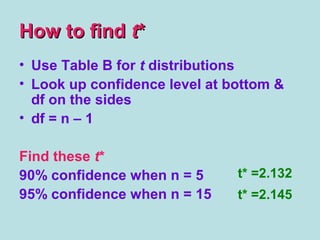
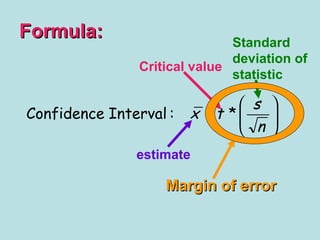
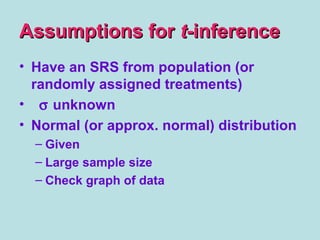

- Confidence intervals provide an estimated range of values that is likely to include an unknown population parameter, such as a mean, with a specified degree of confidence. - The margin of error depends on the sample size, standard deviation, and confidence level, with a larger sample size and smaller standard deviation yielding a smaller margin of error. - When the sample size is small, a t-distribution rather than normal distribution is used to construct the confidence interval due to the unknown population standard deviation. The t-distribution is wider than the normal and accounts for additional uncertainty from an unknown standard deviation.


