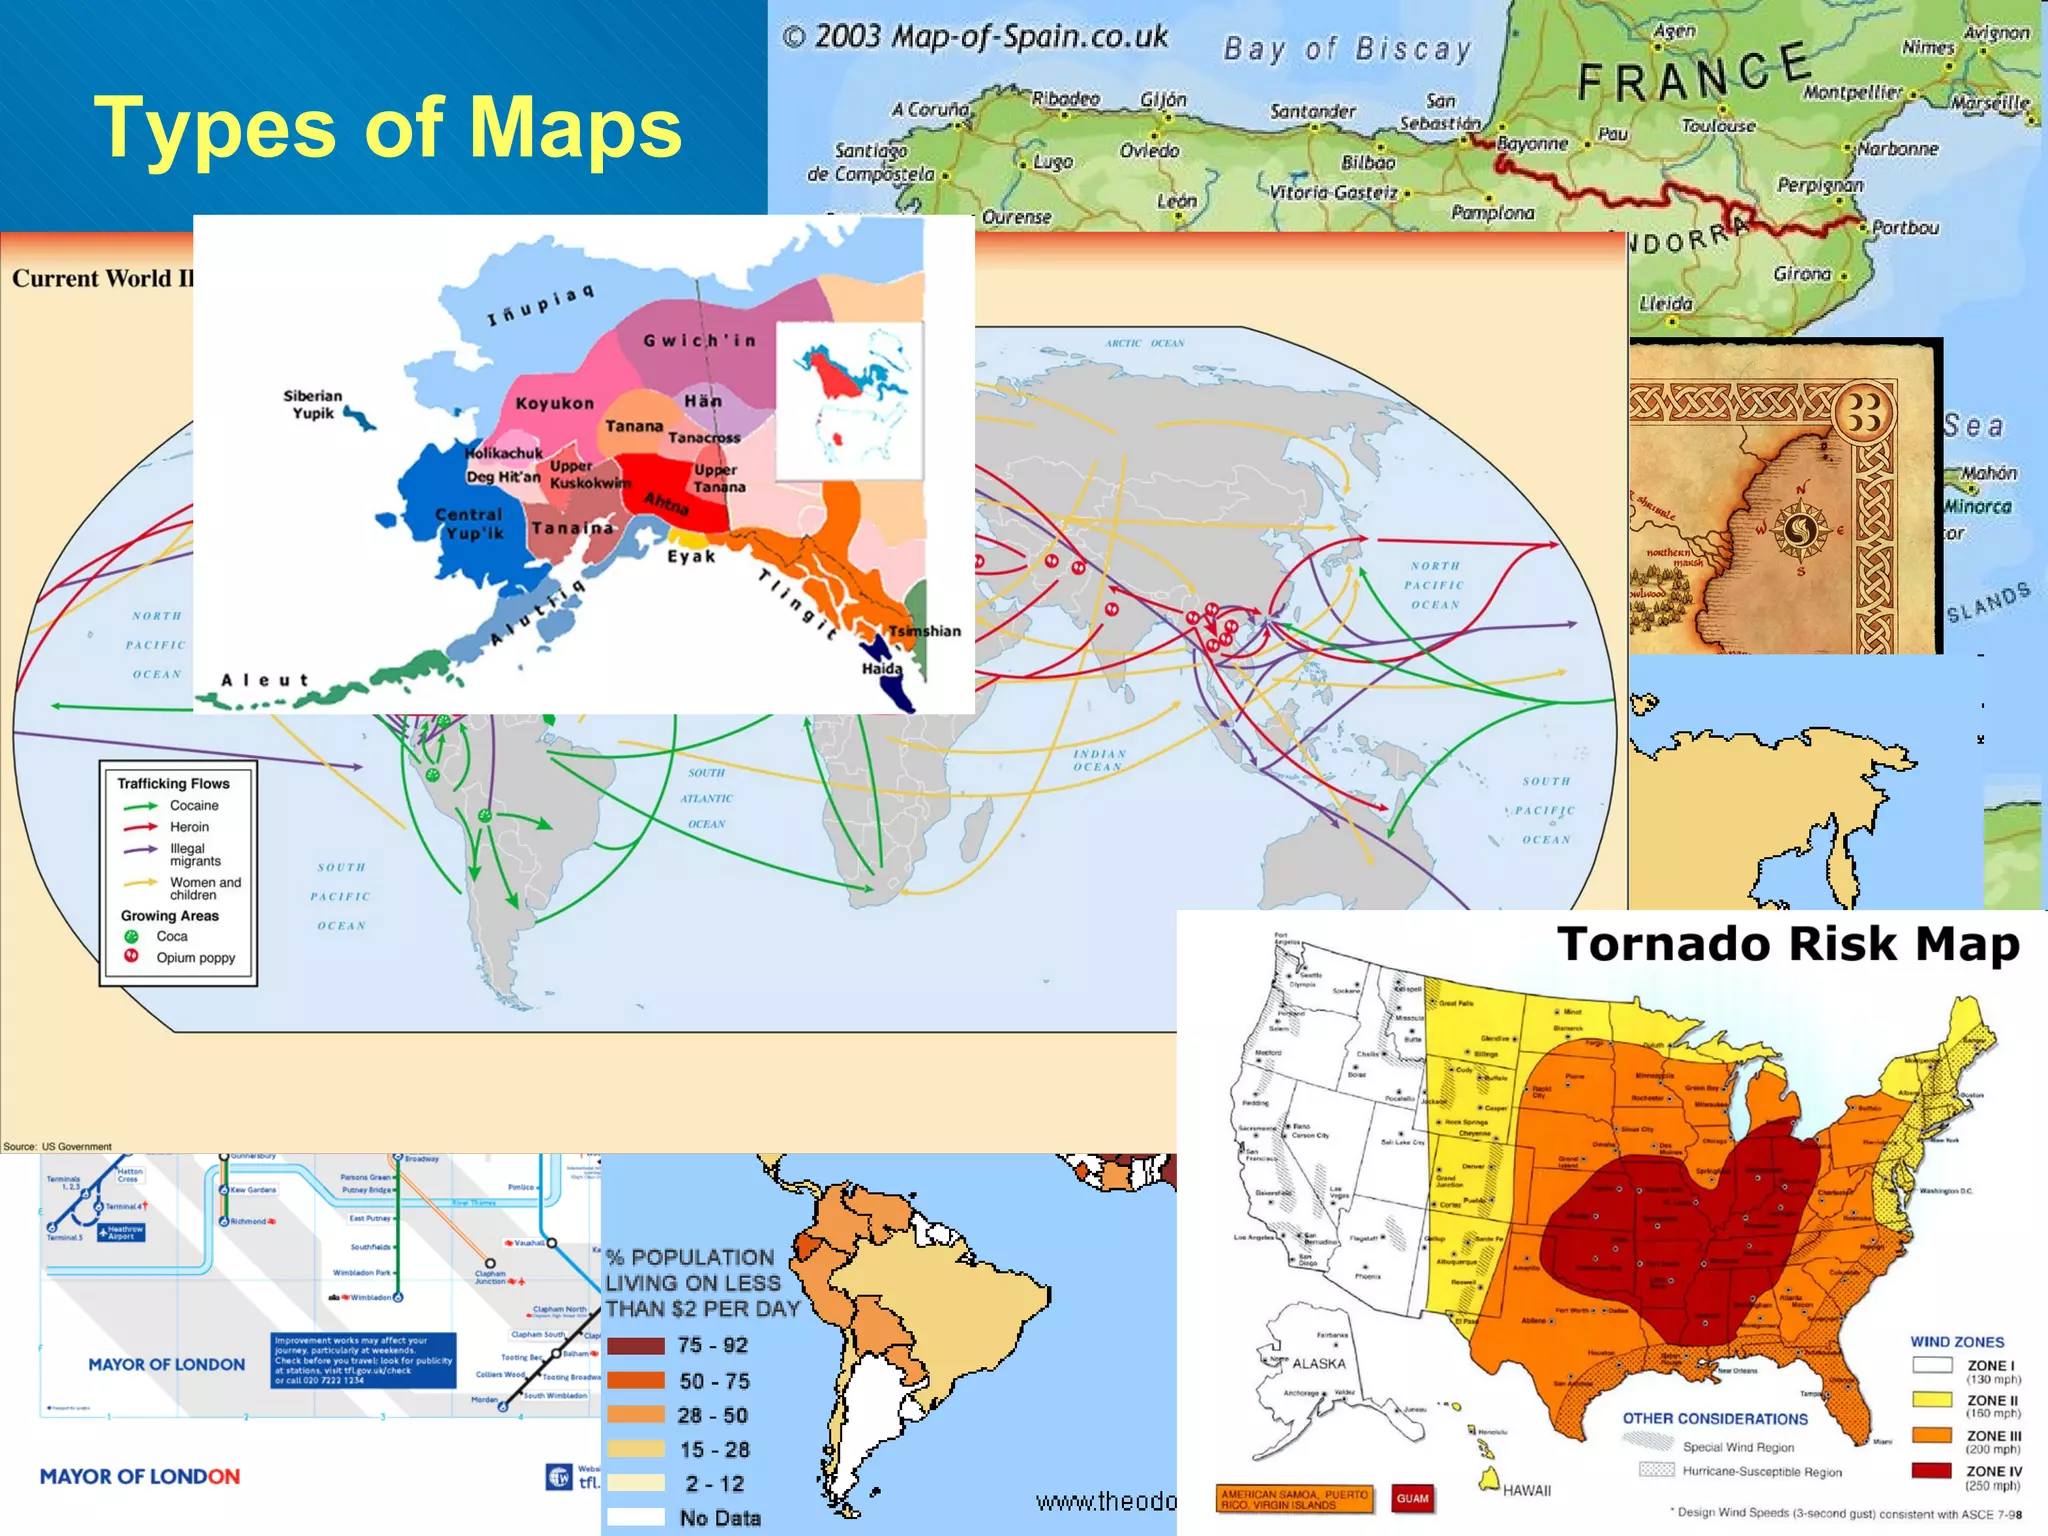
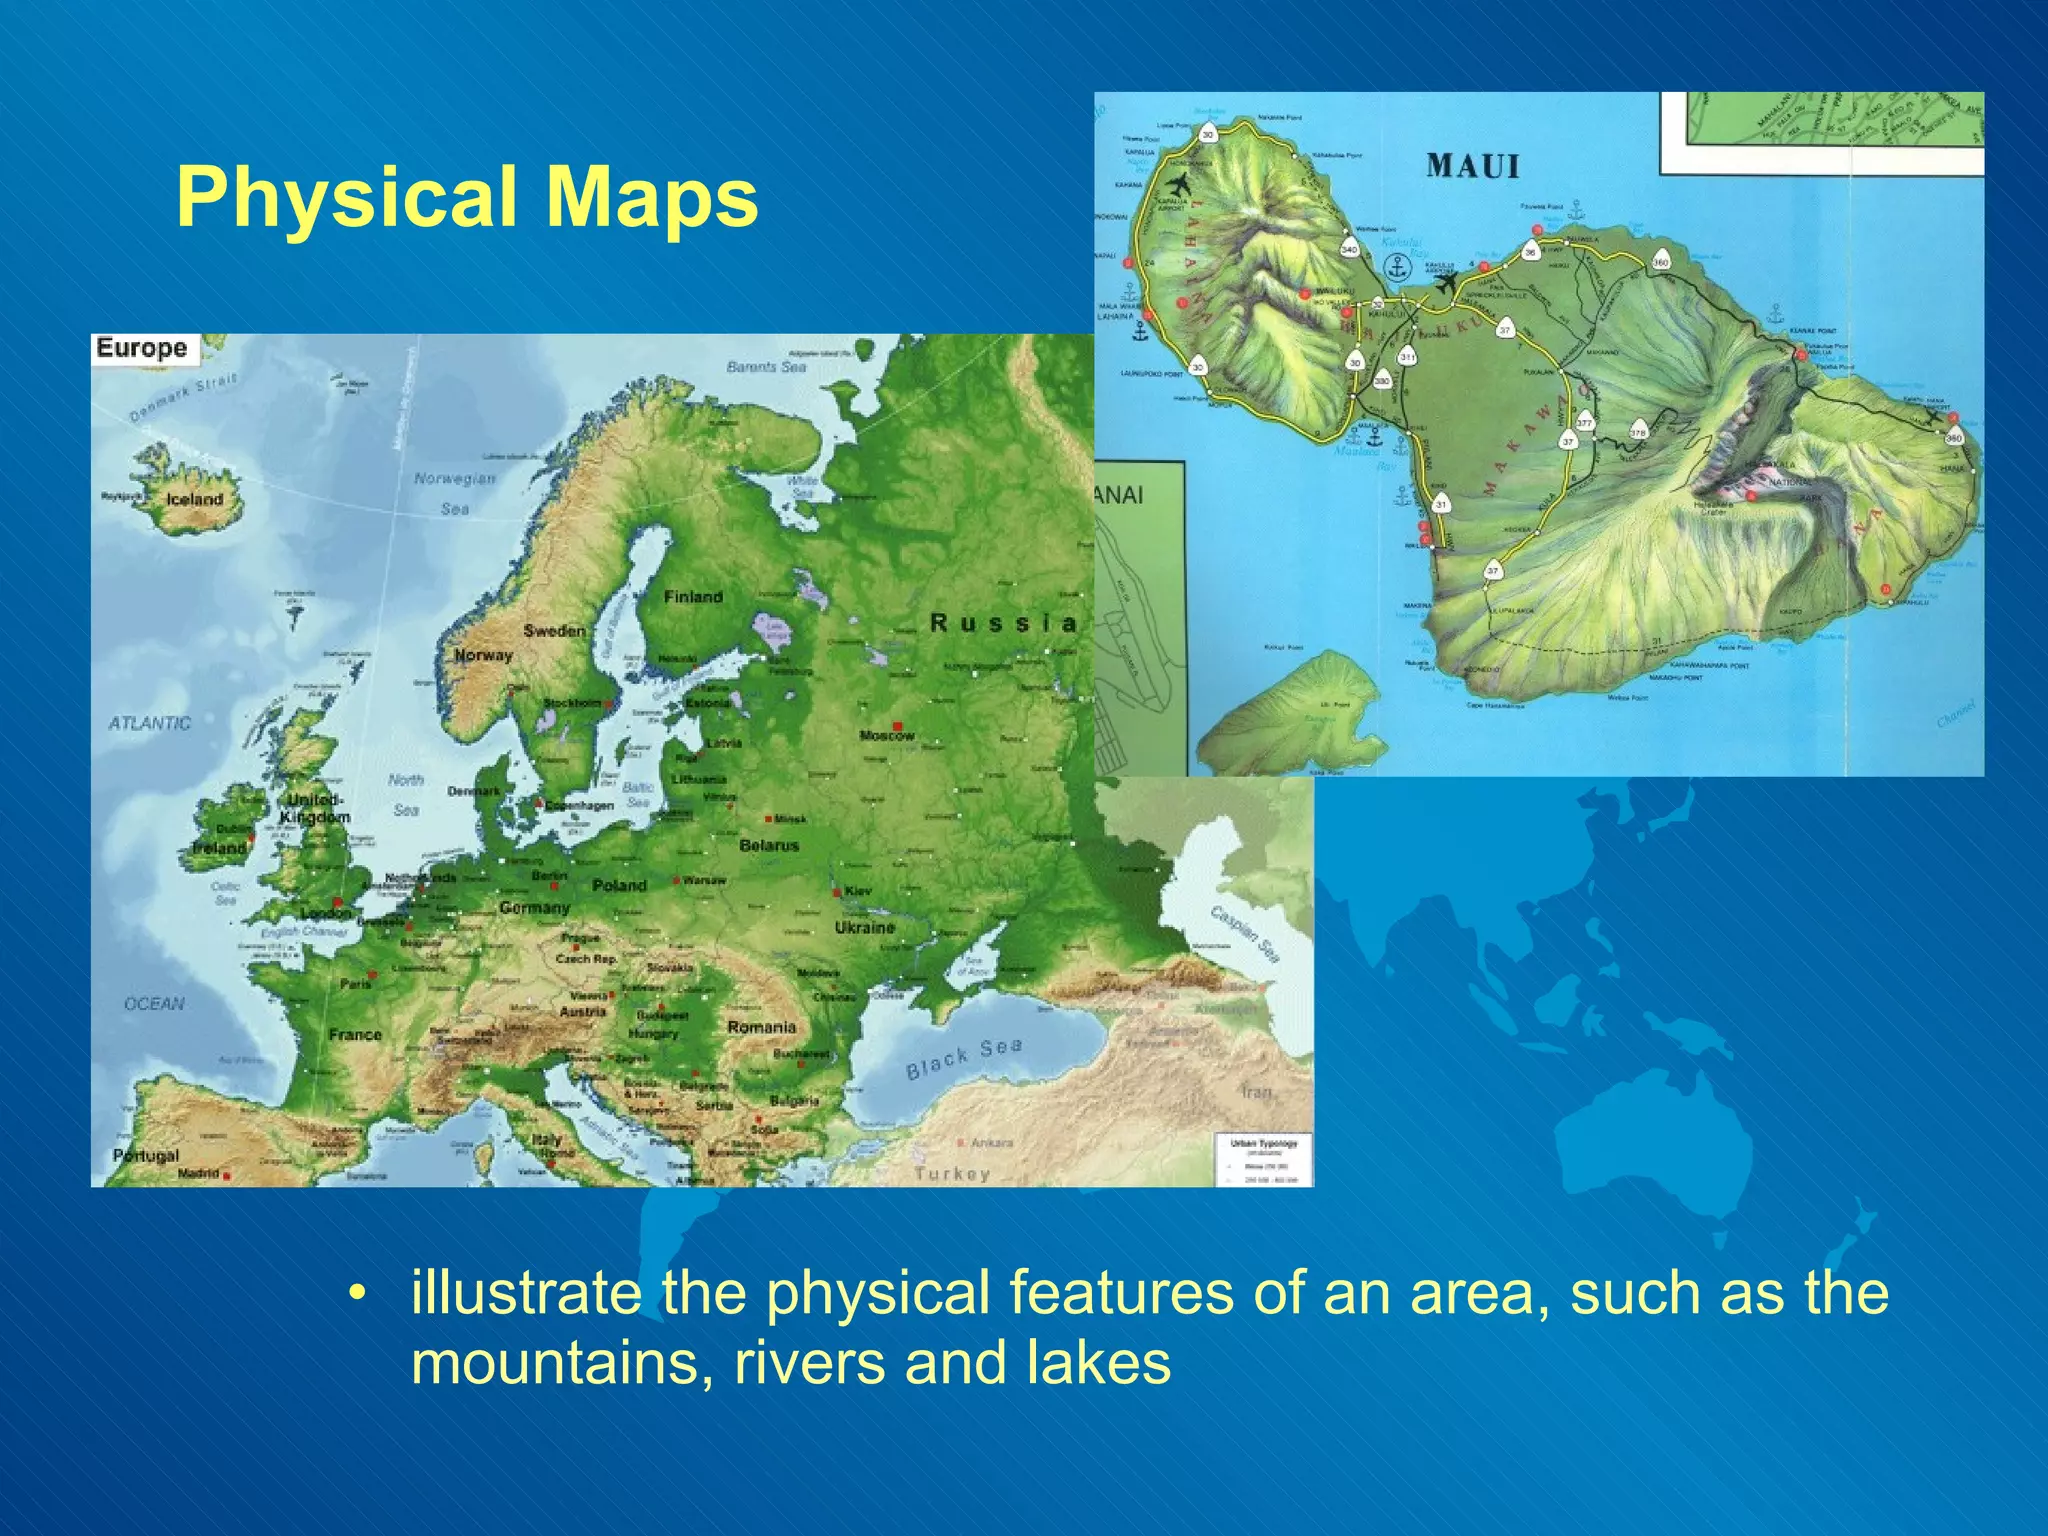
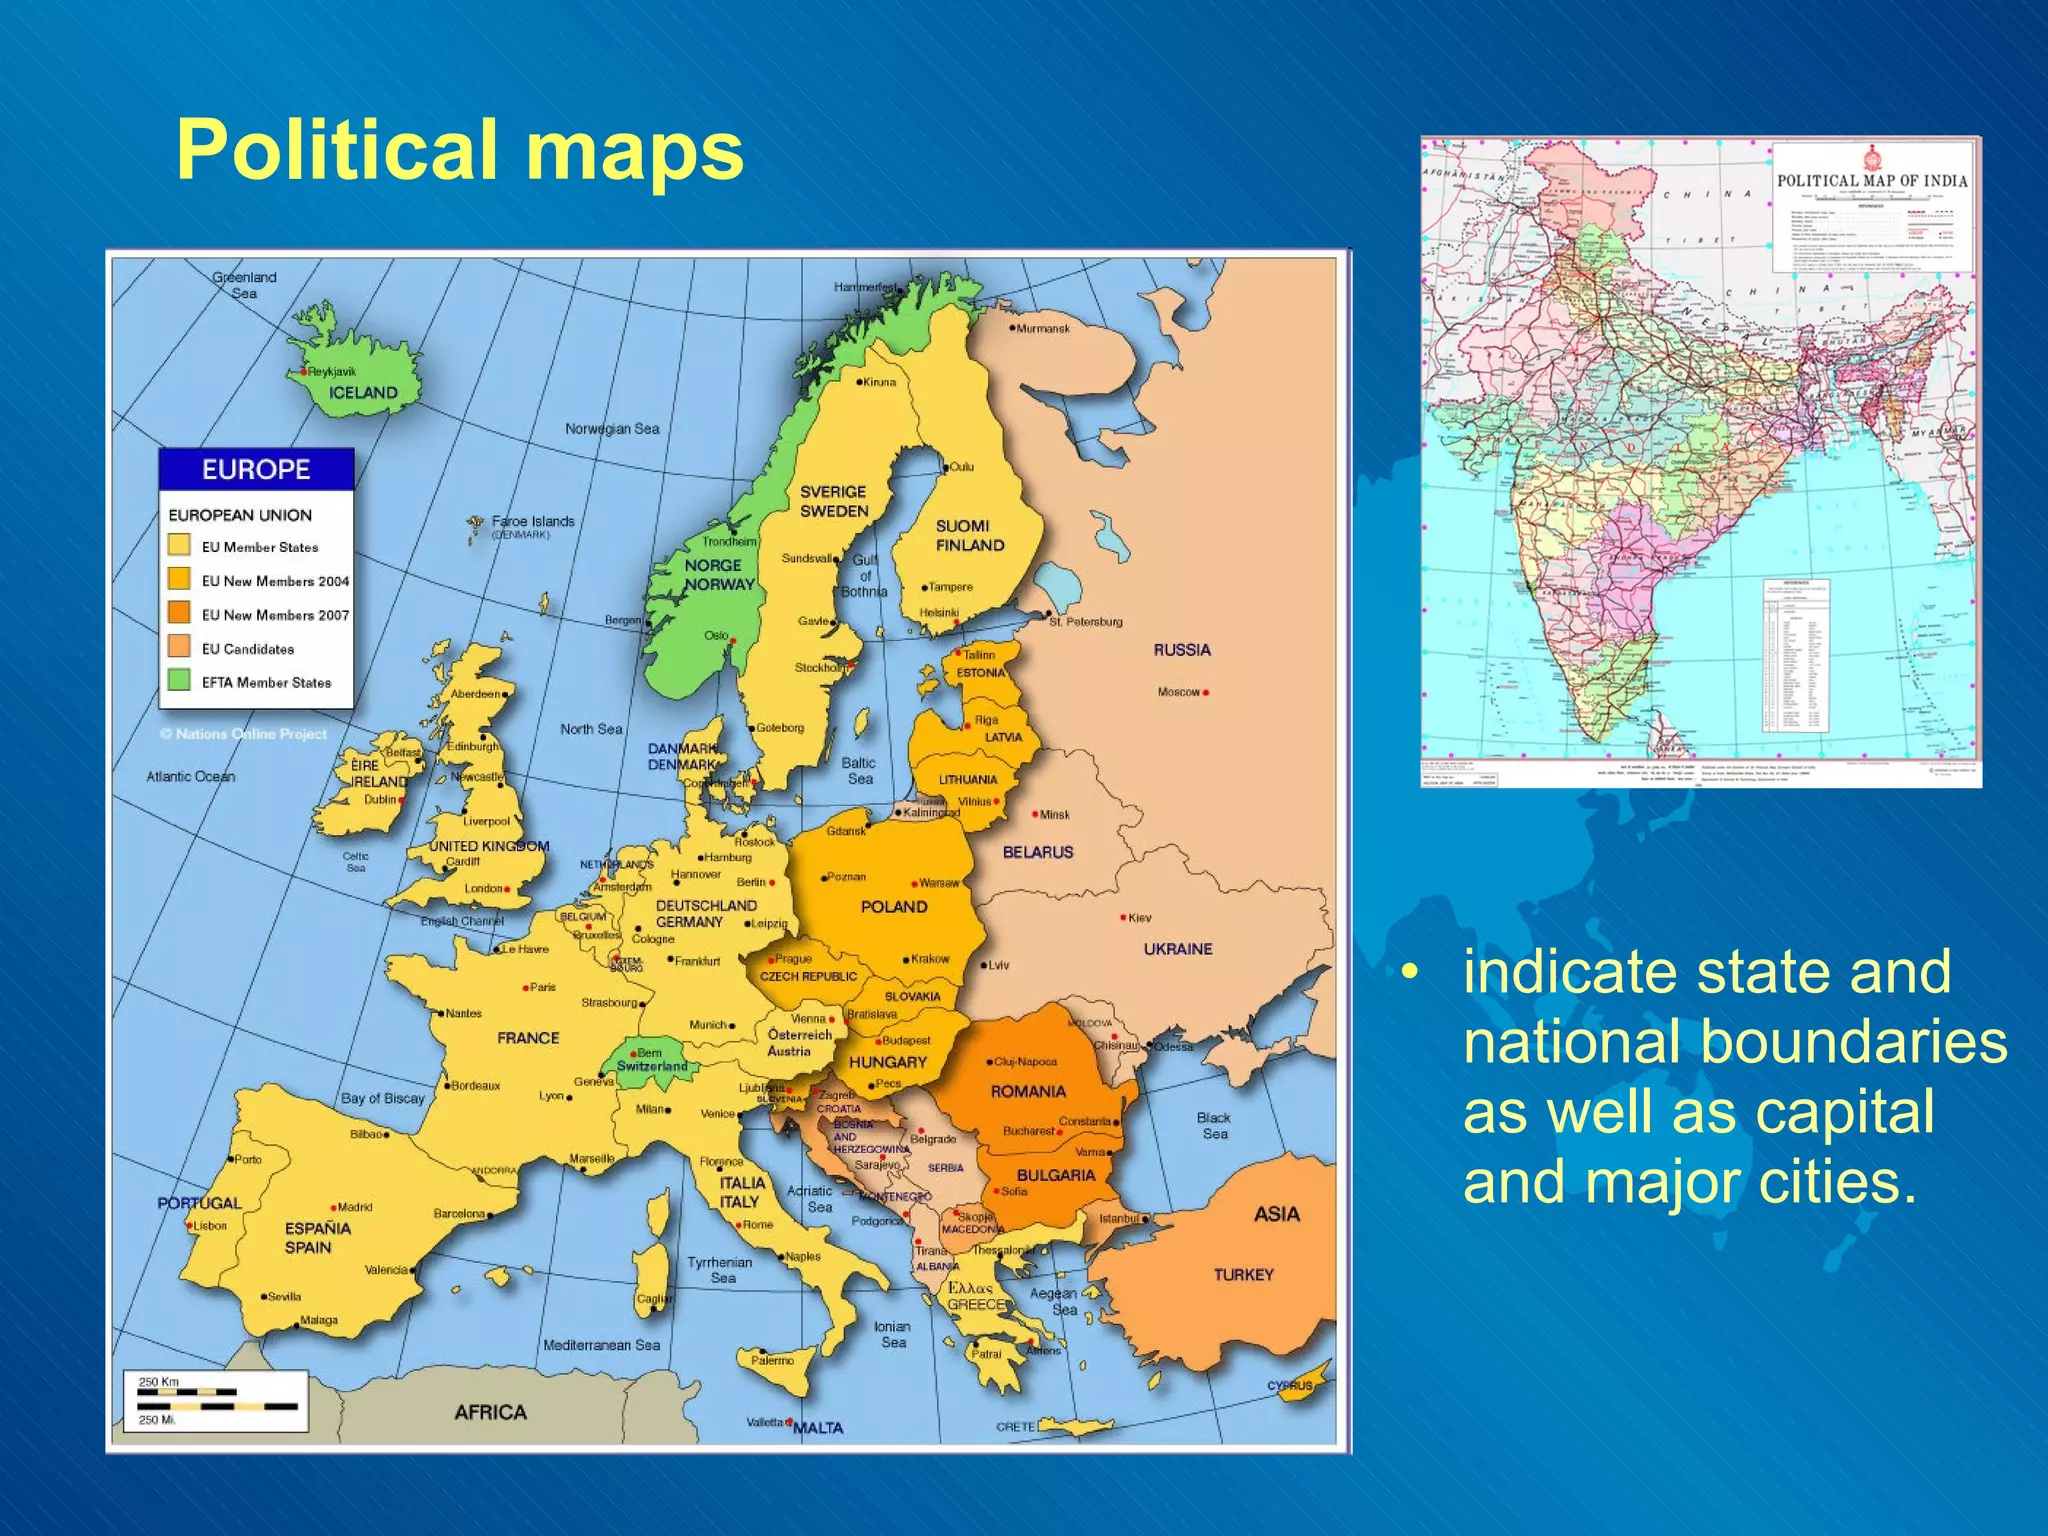
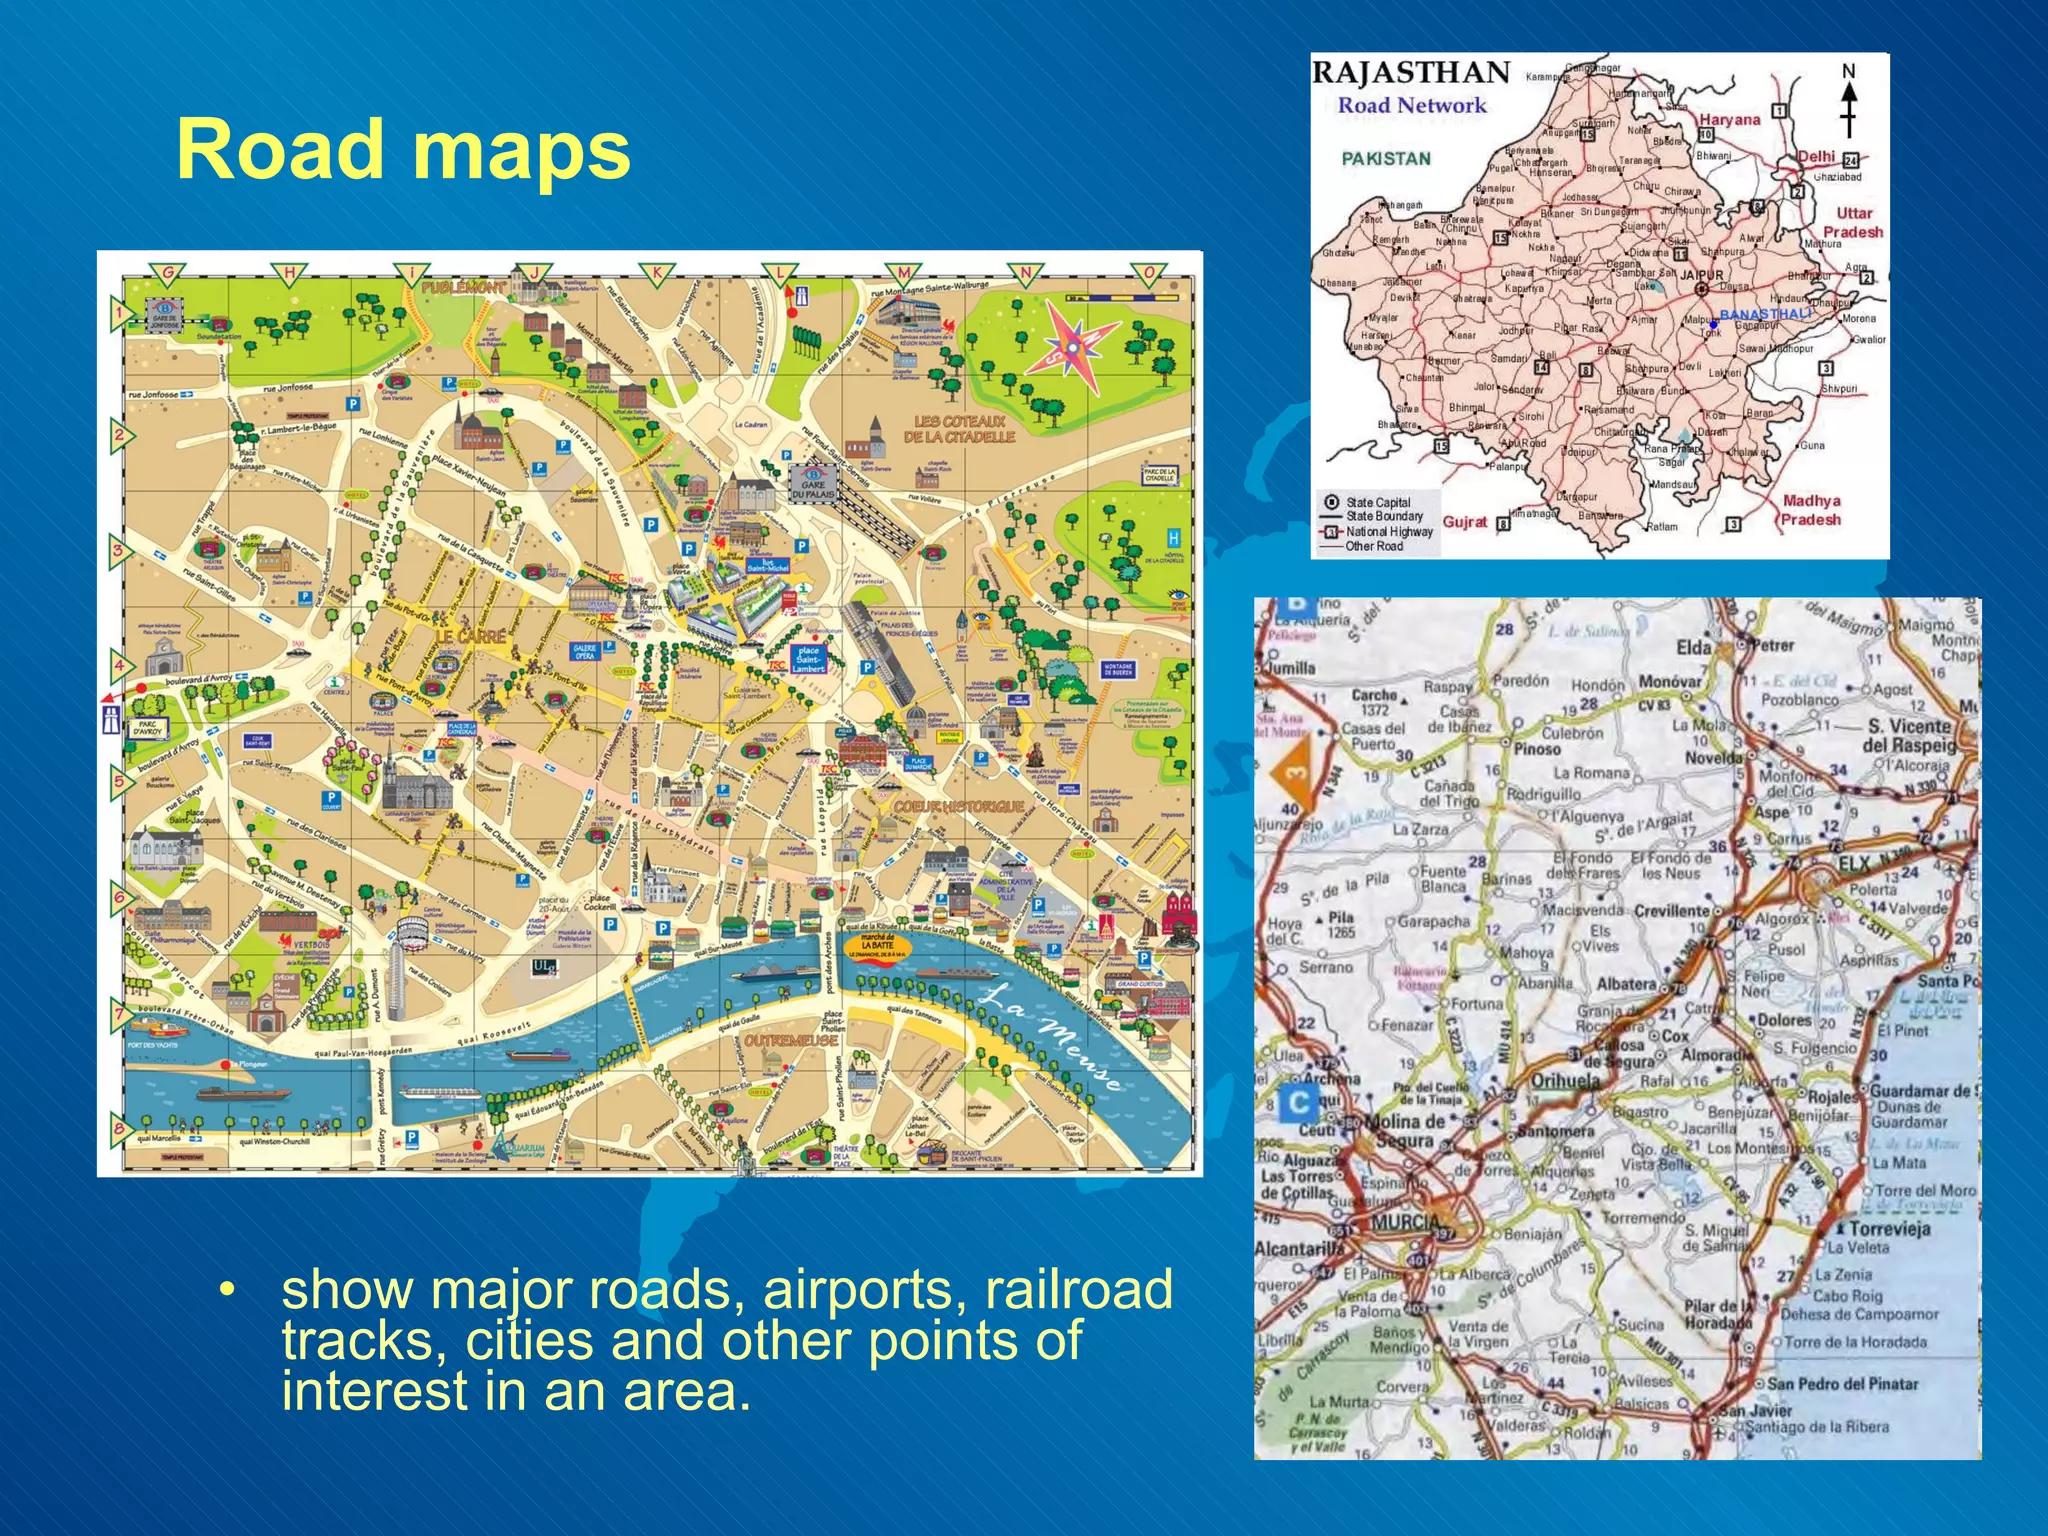
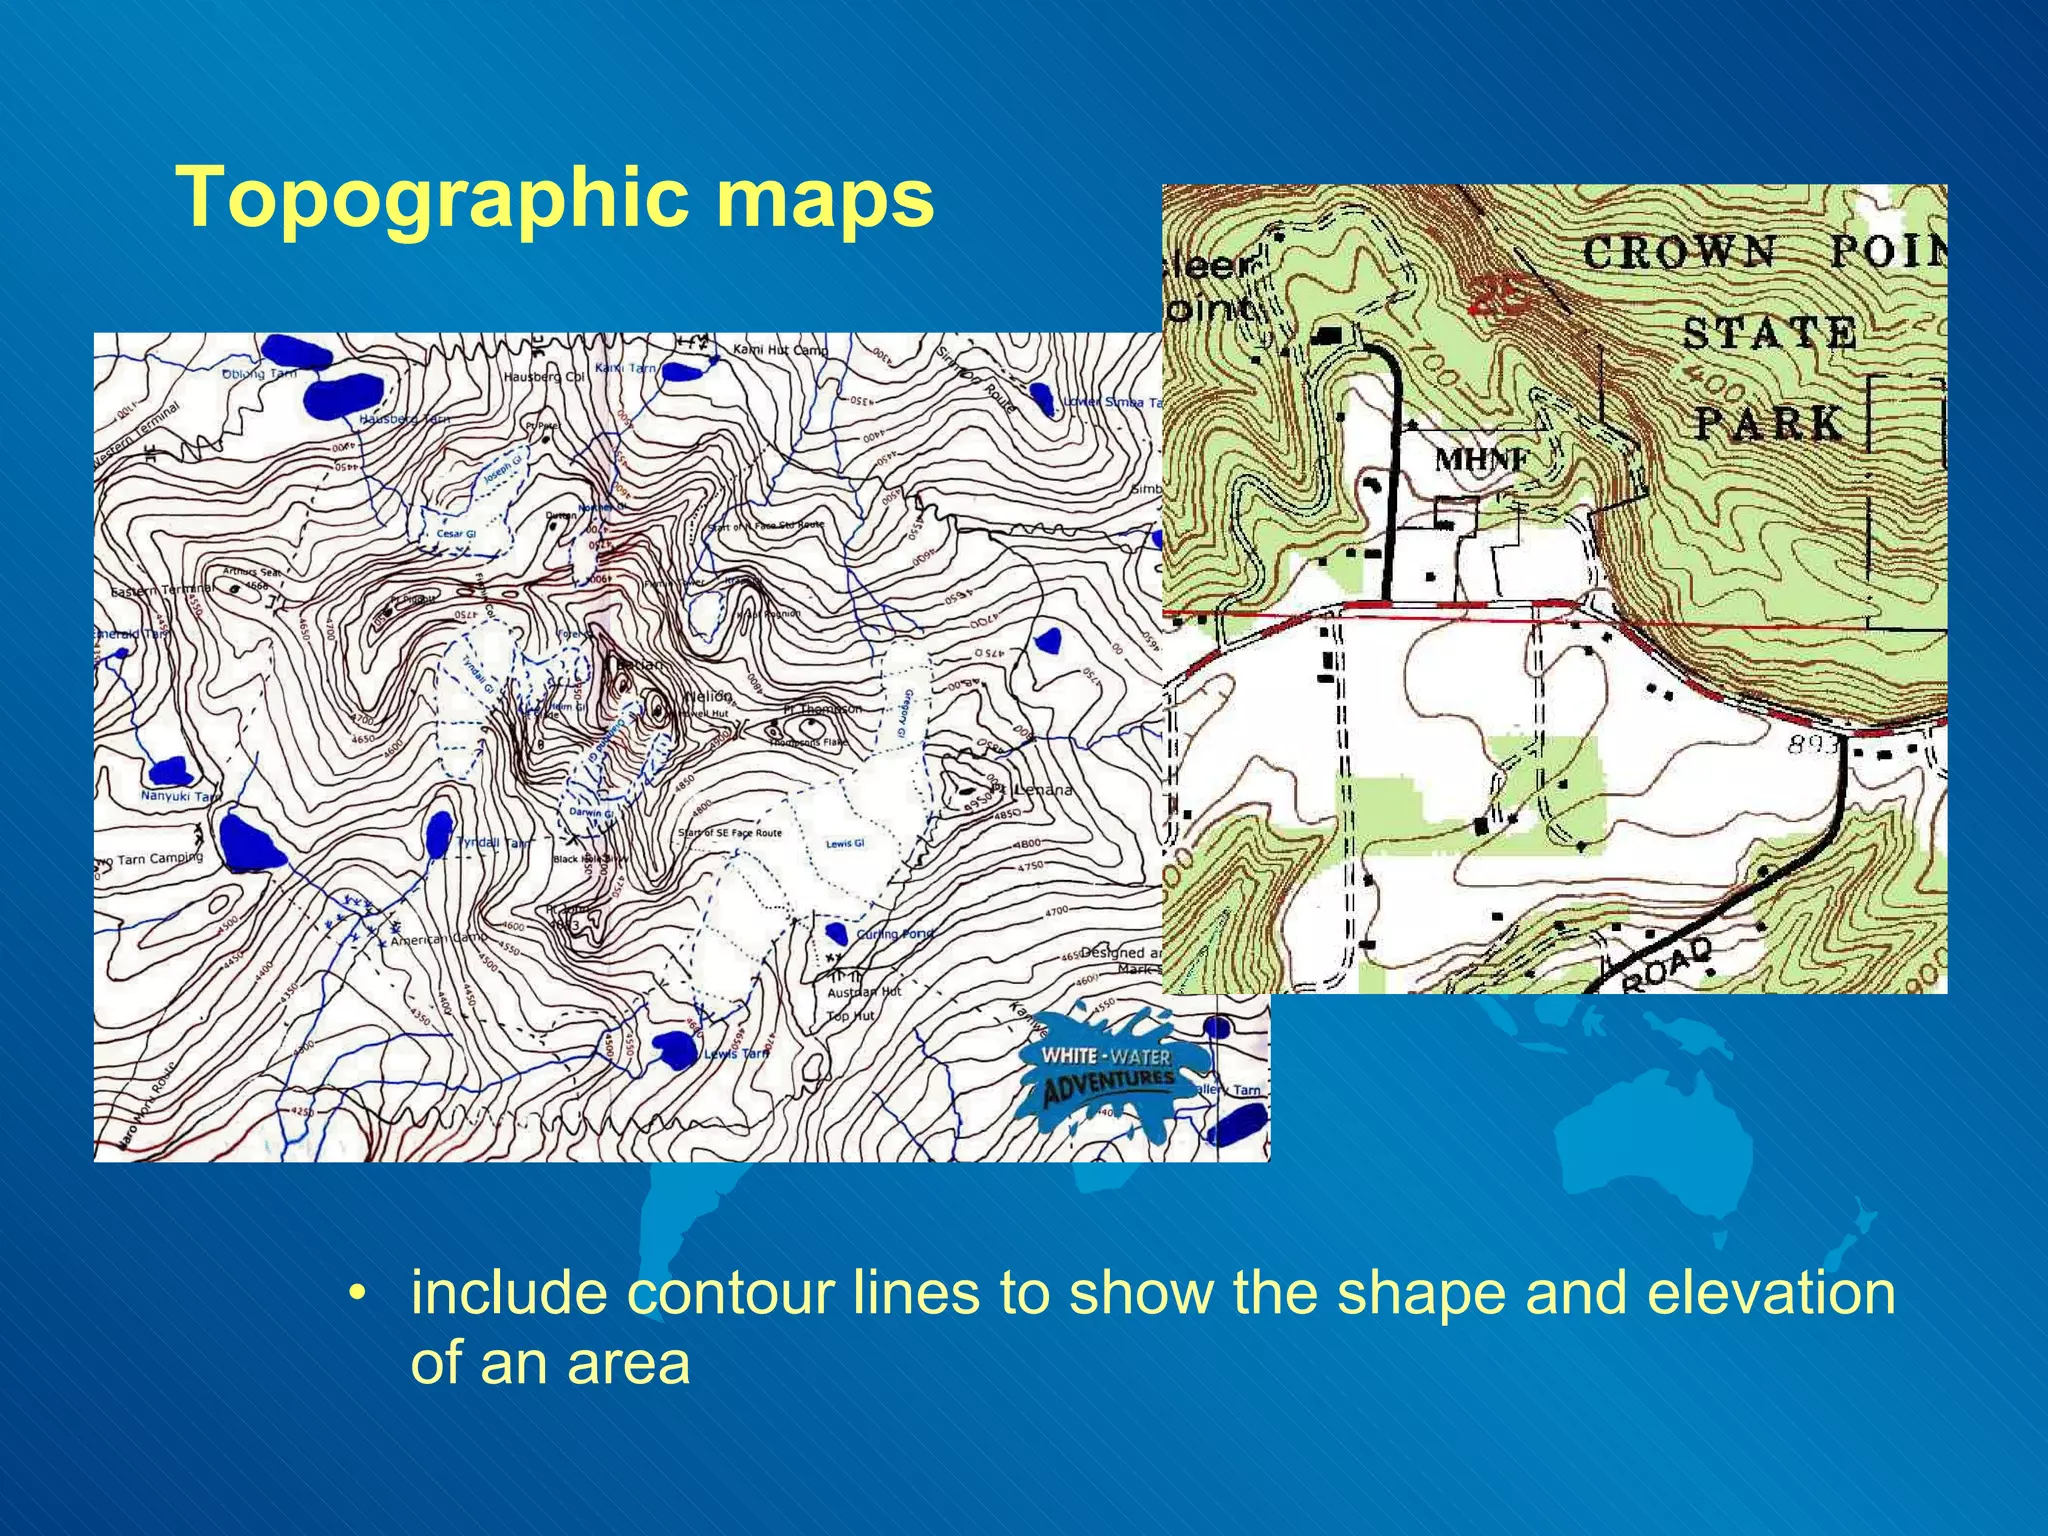
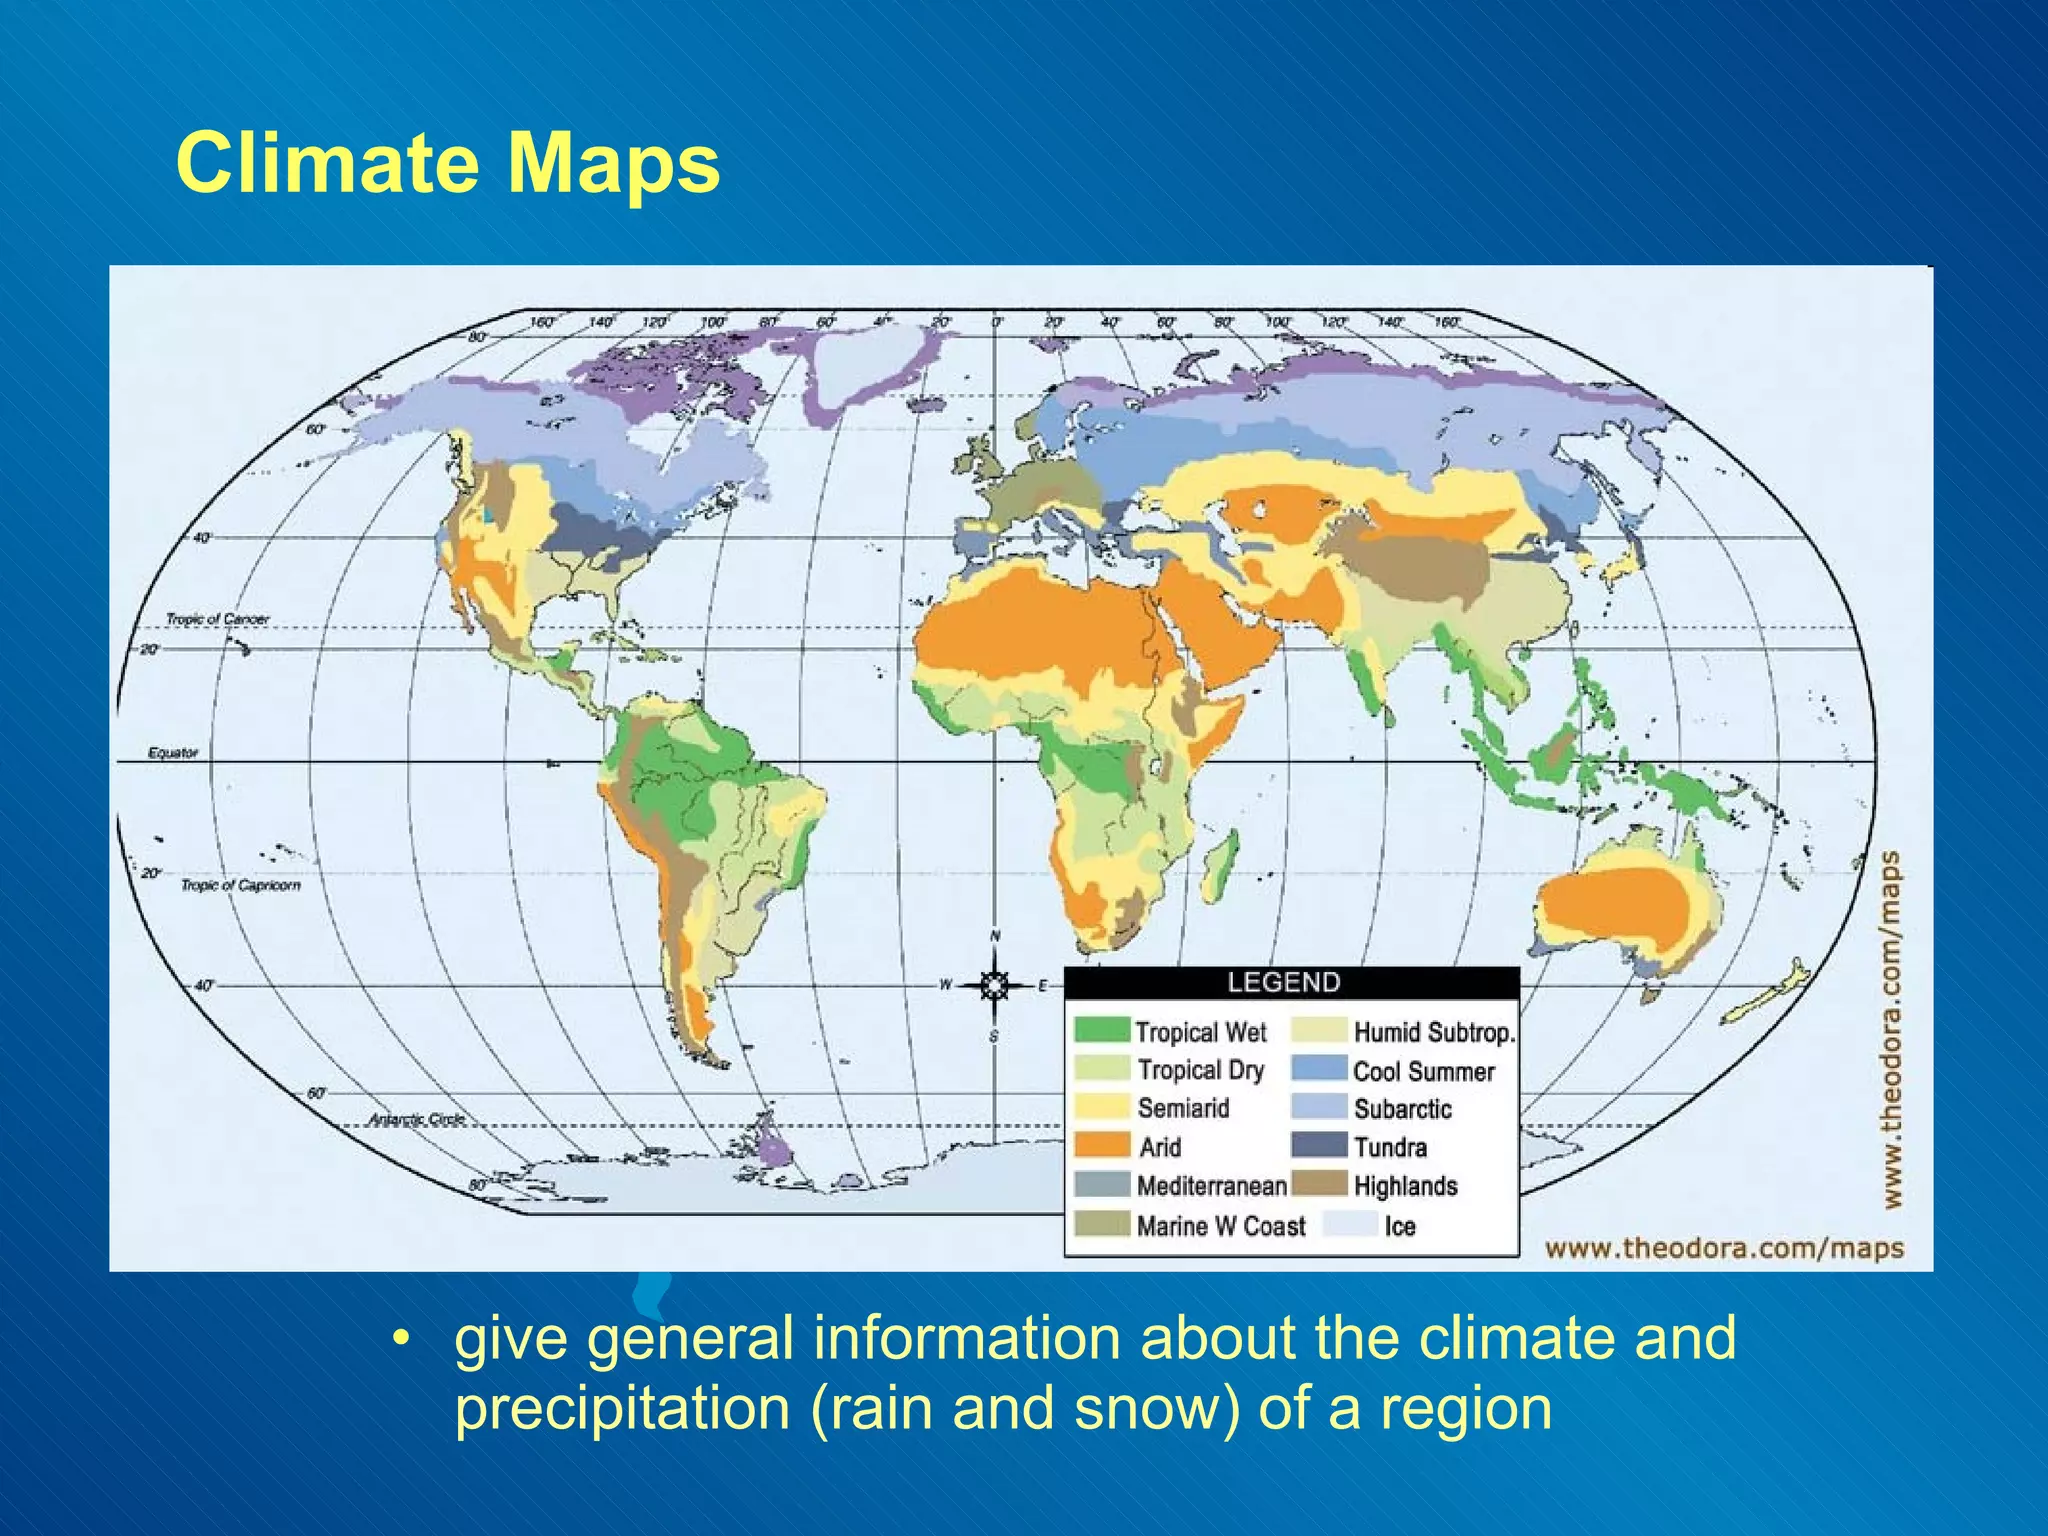
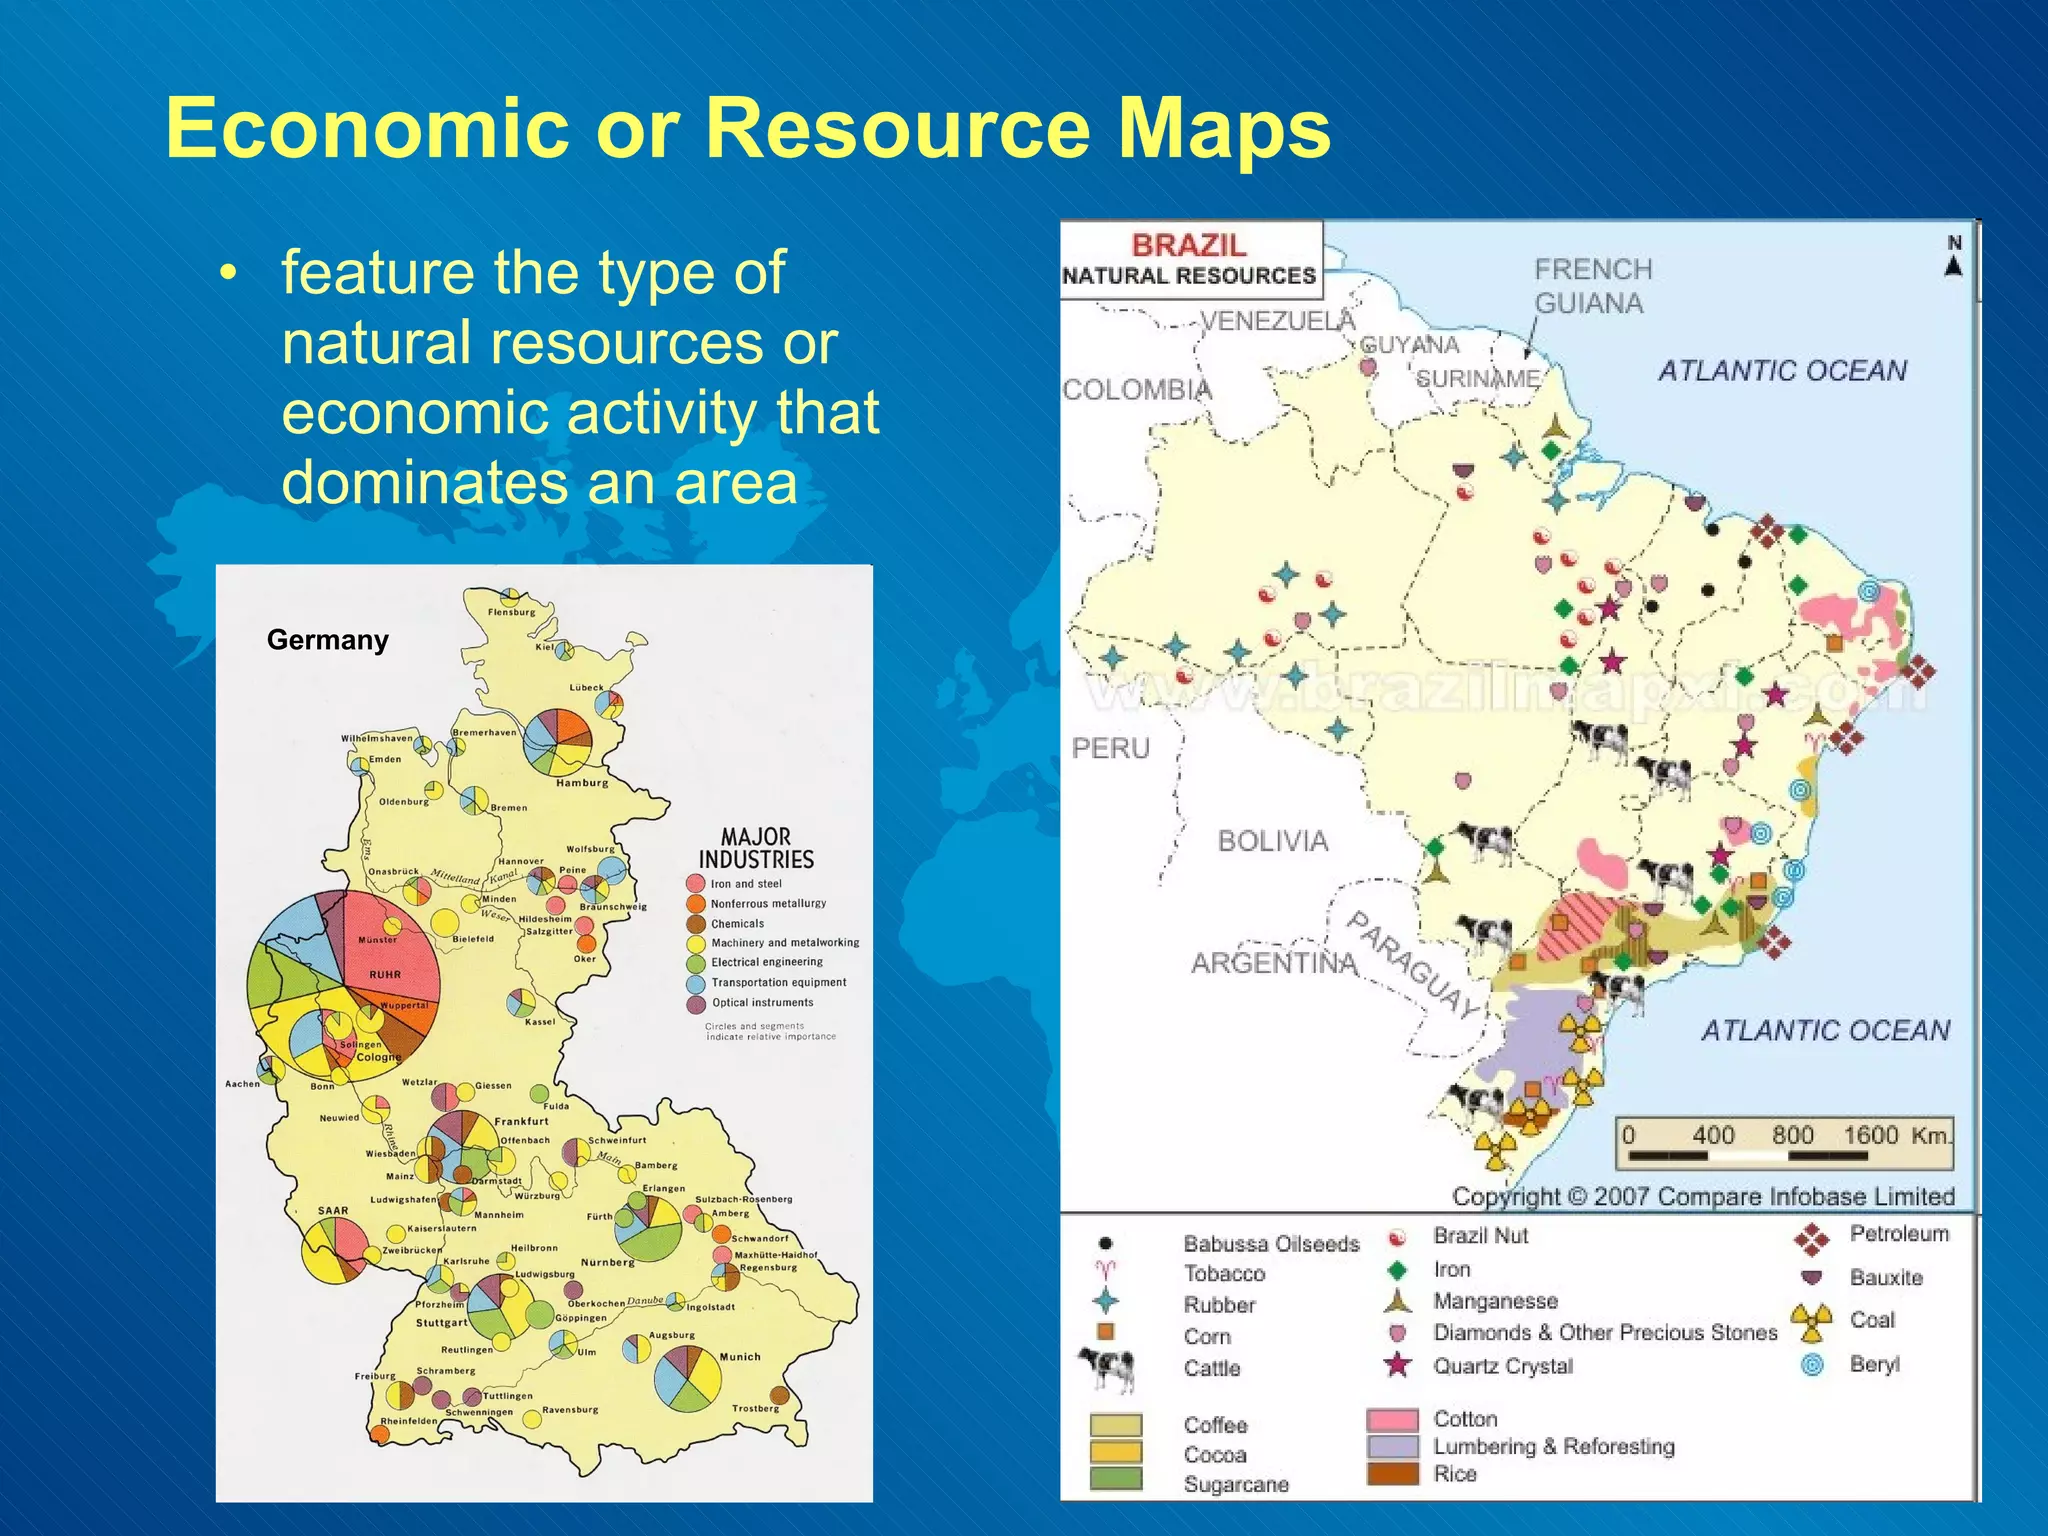
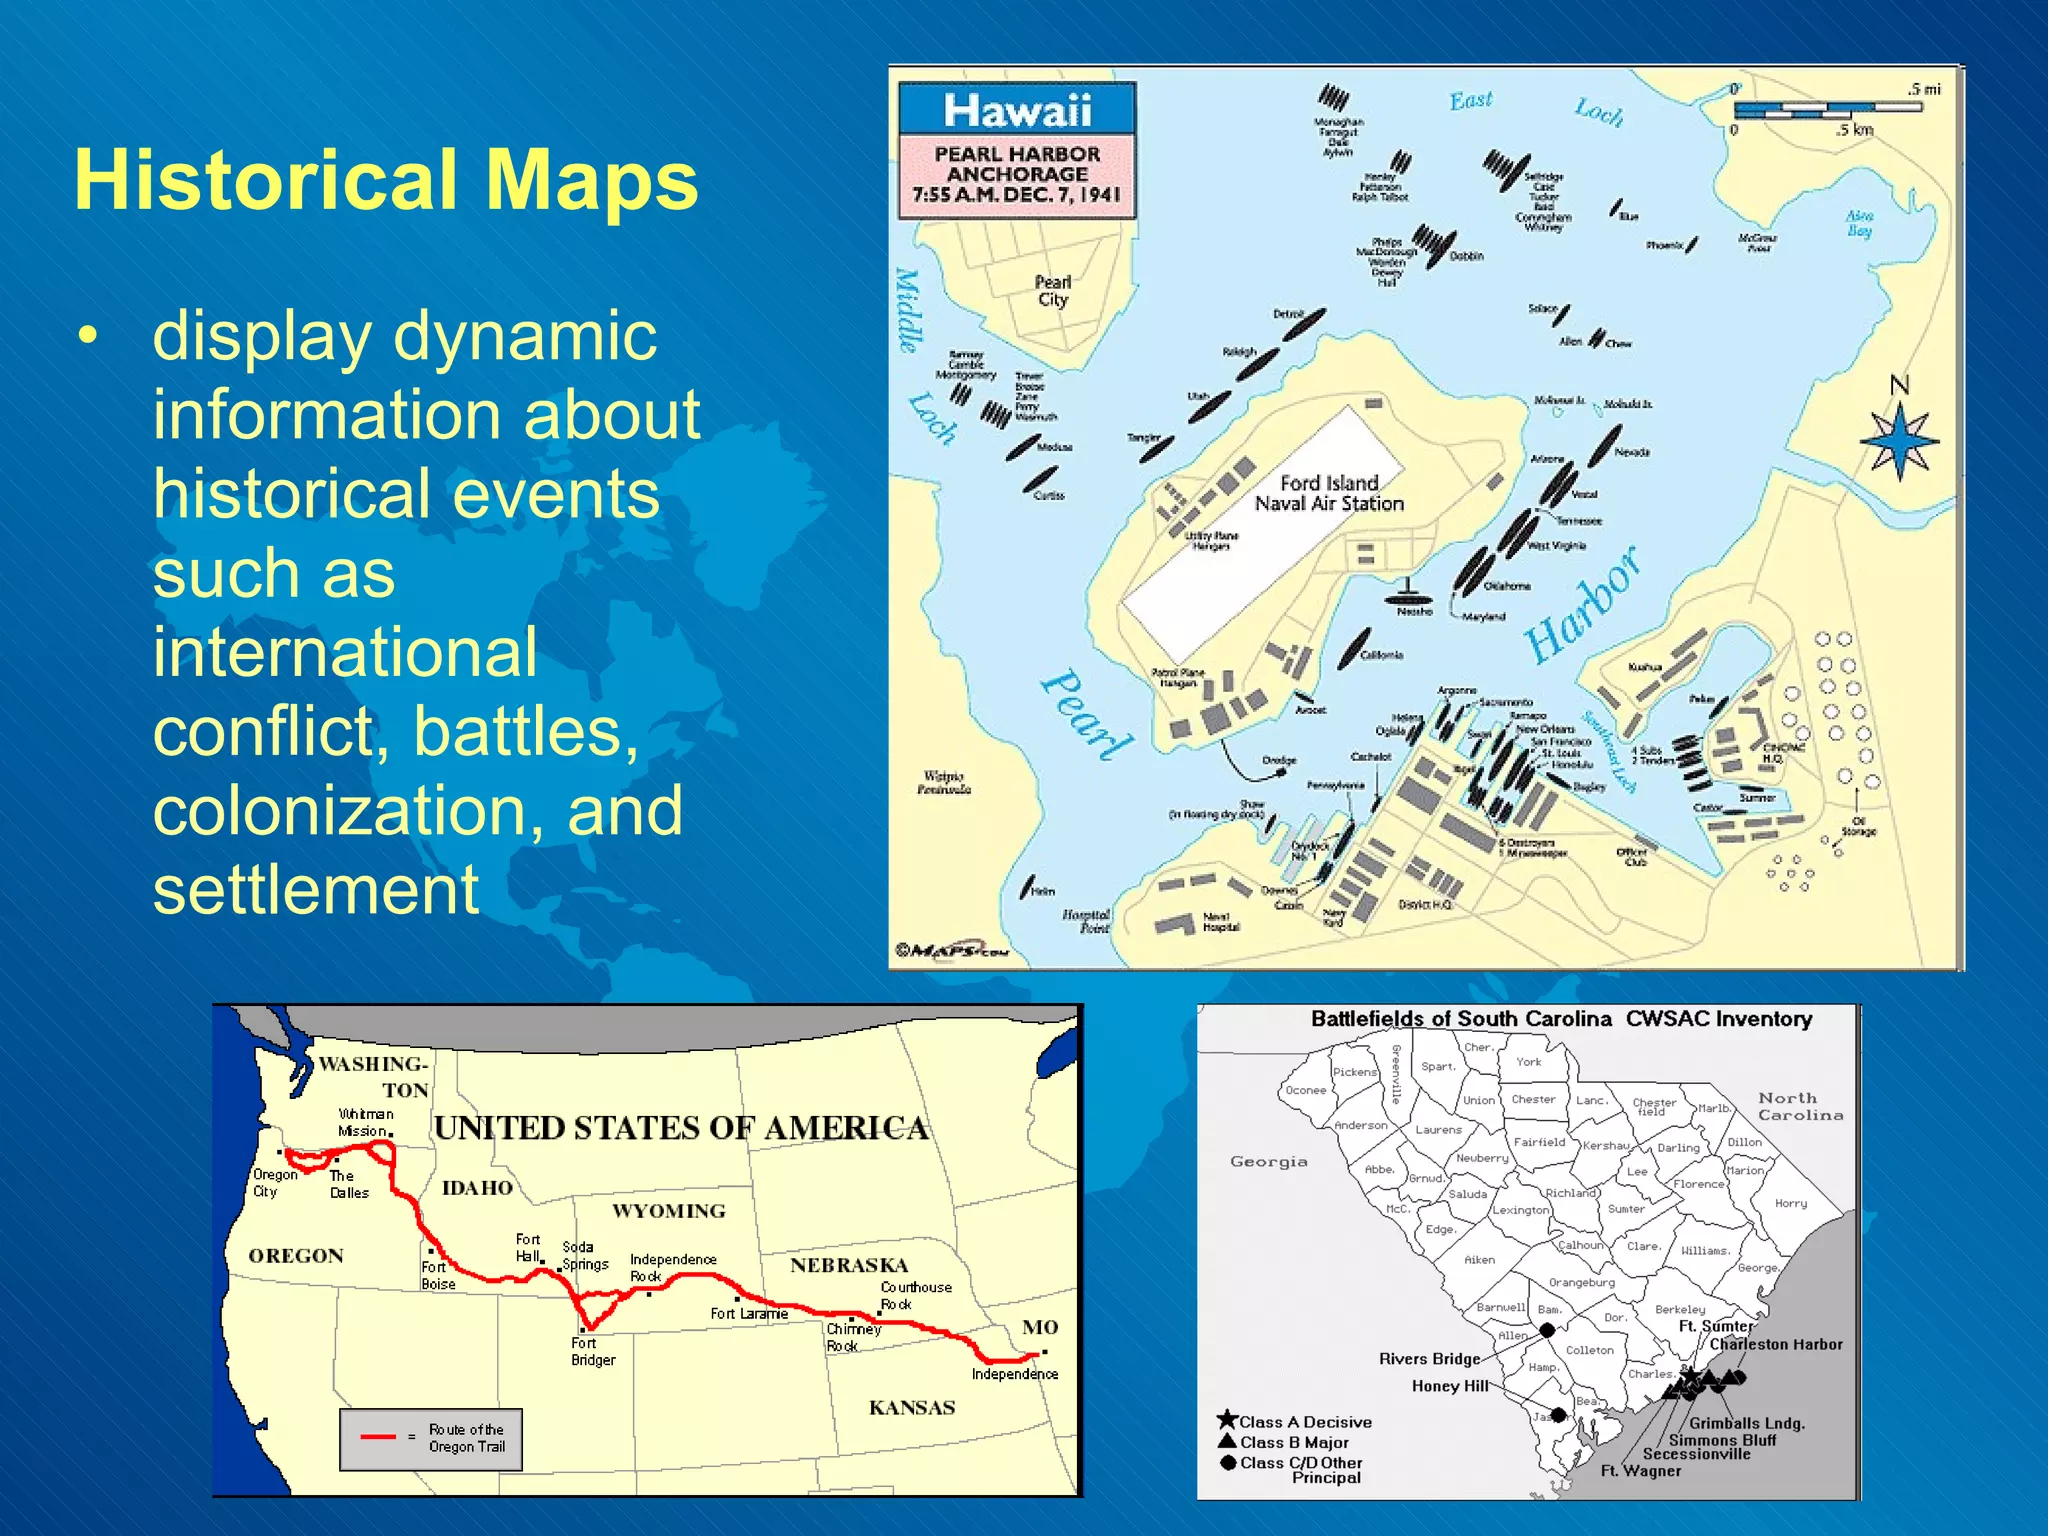
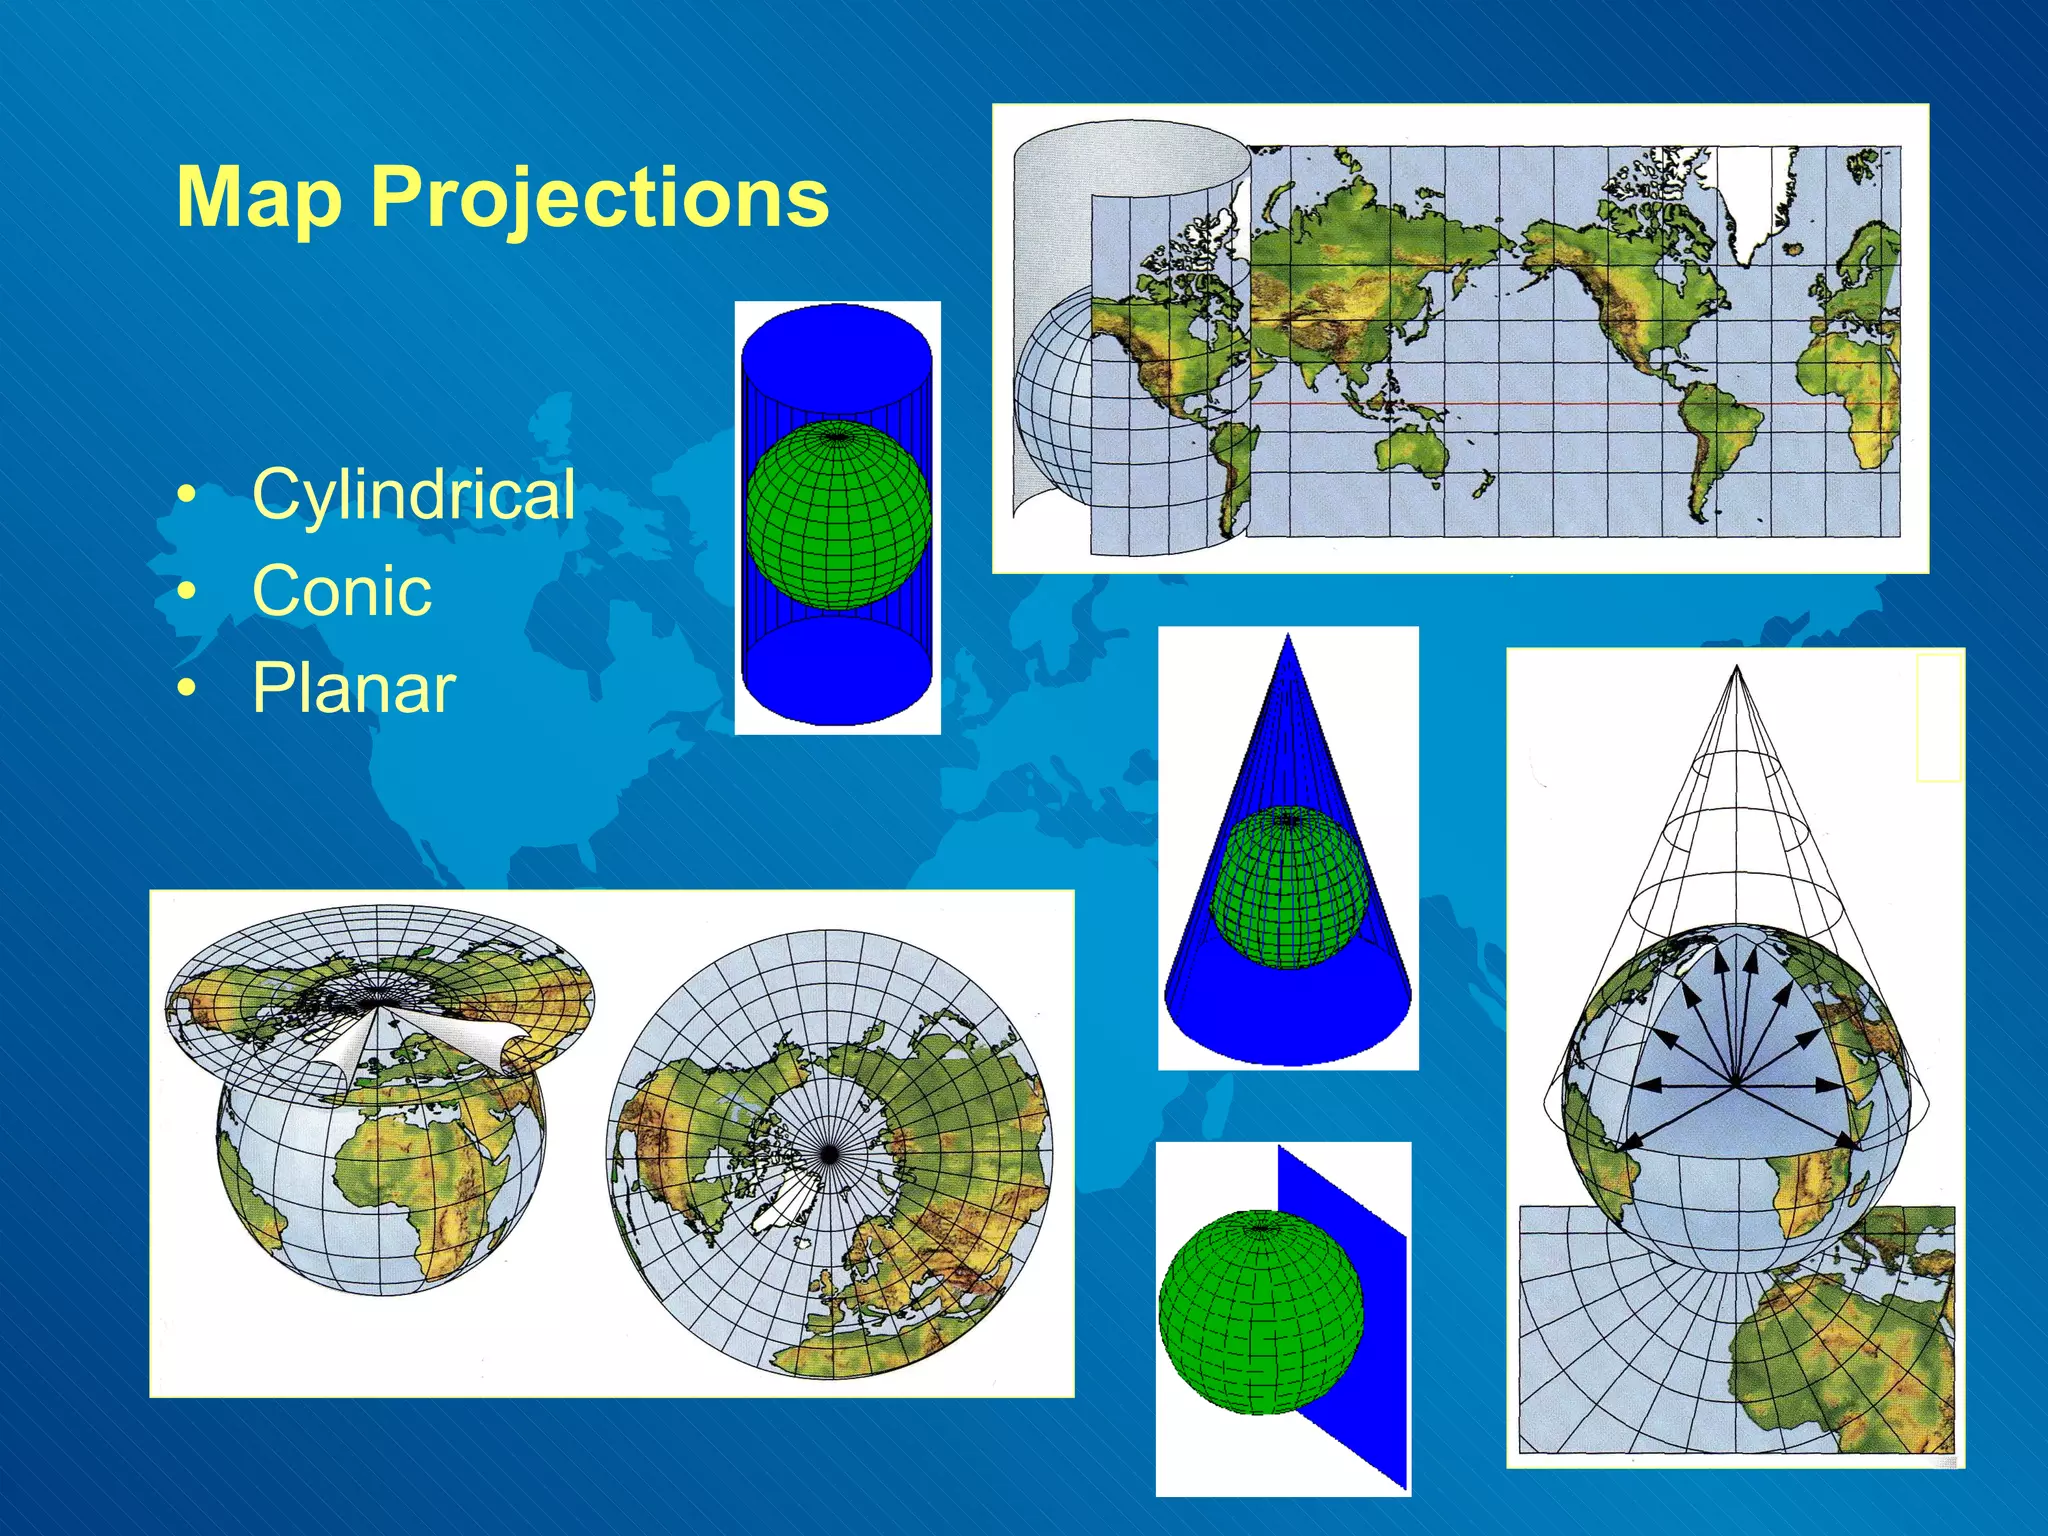
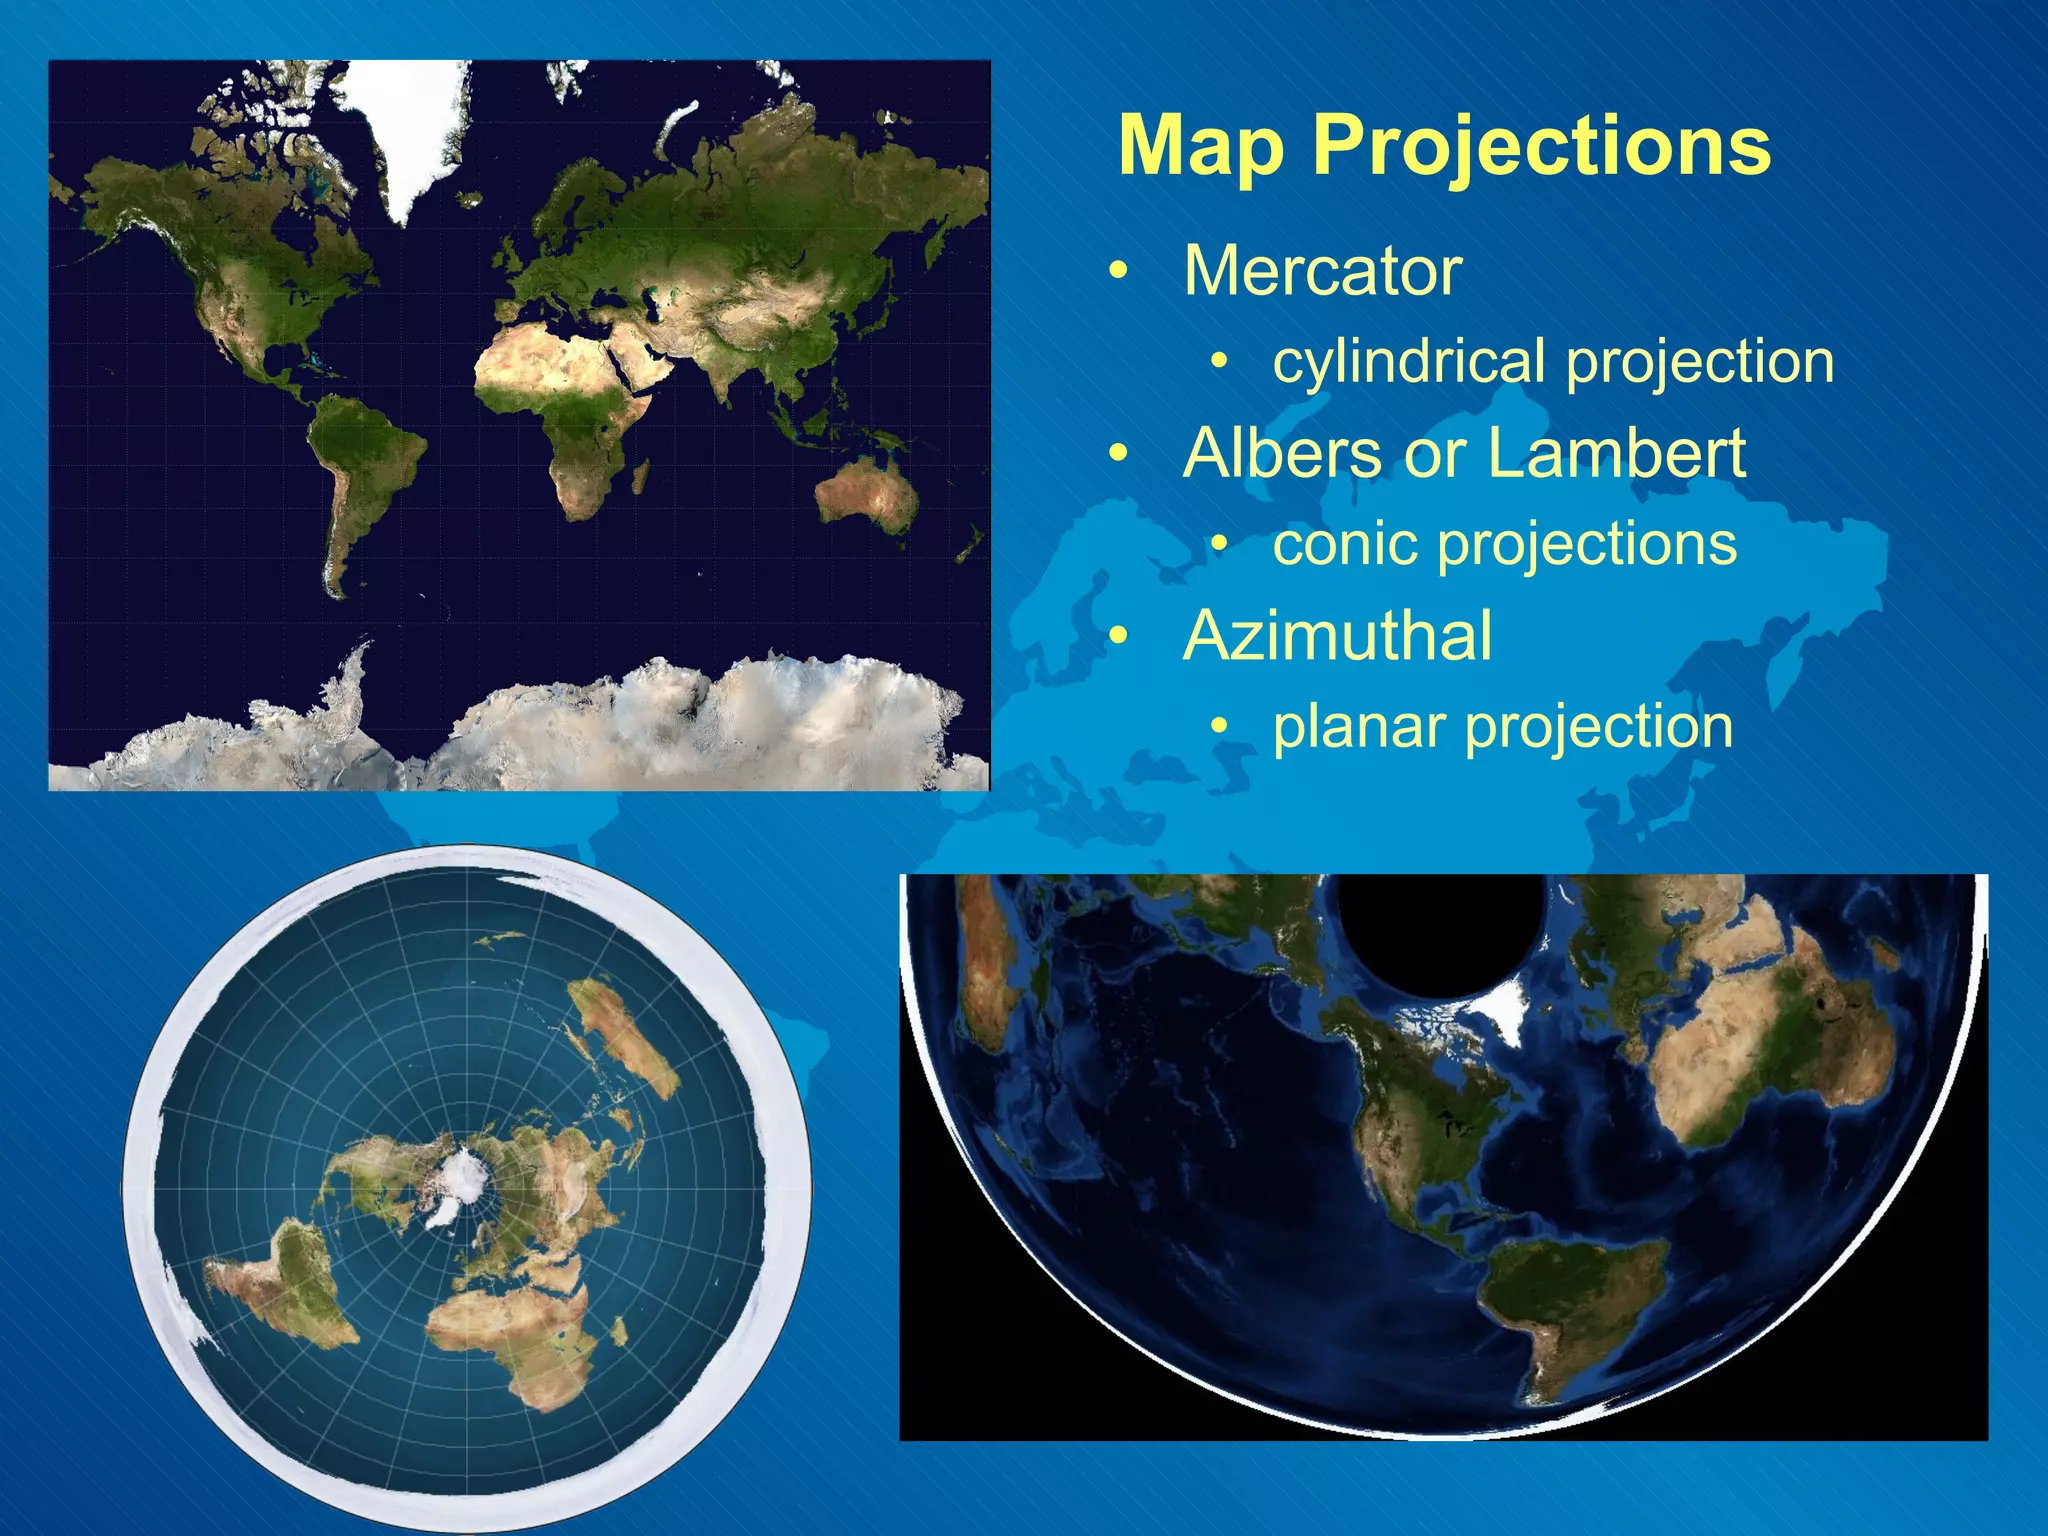
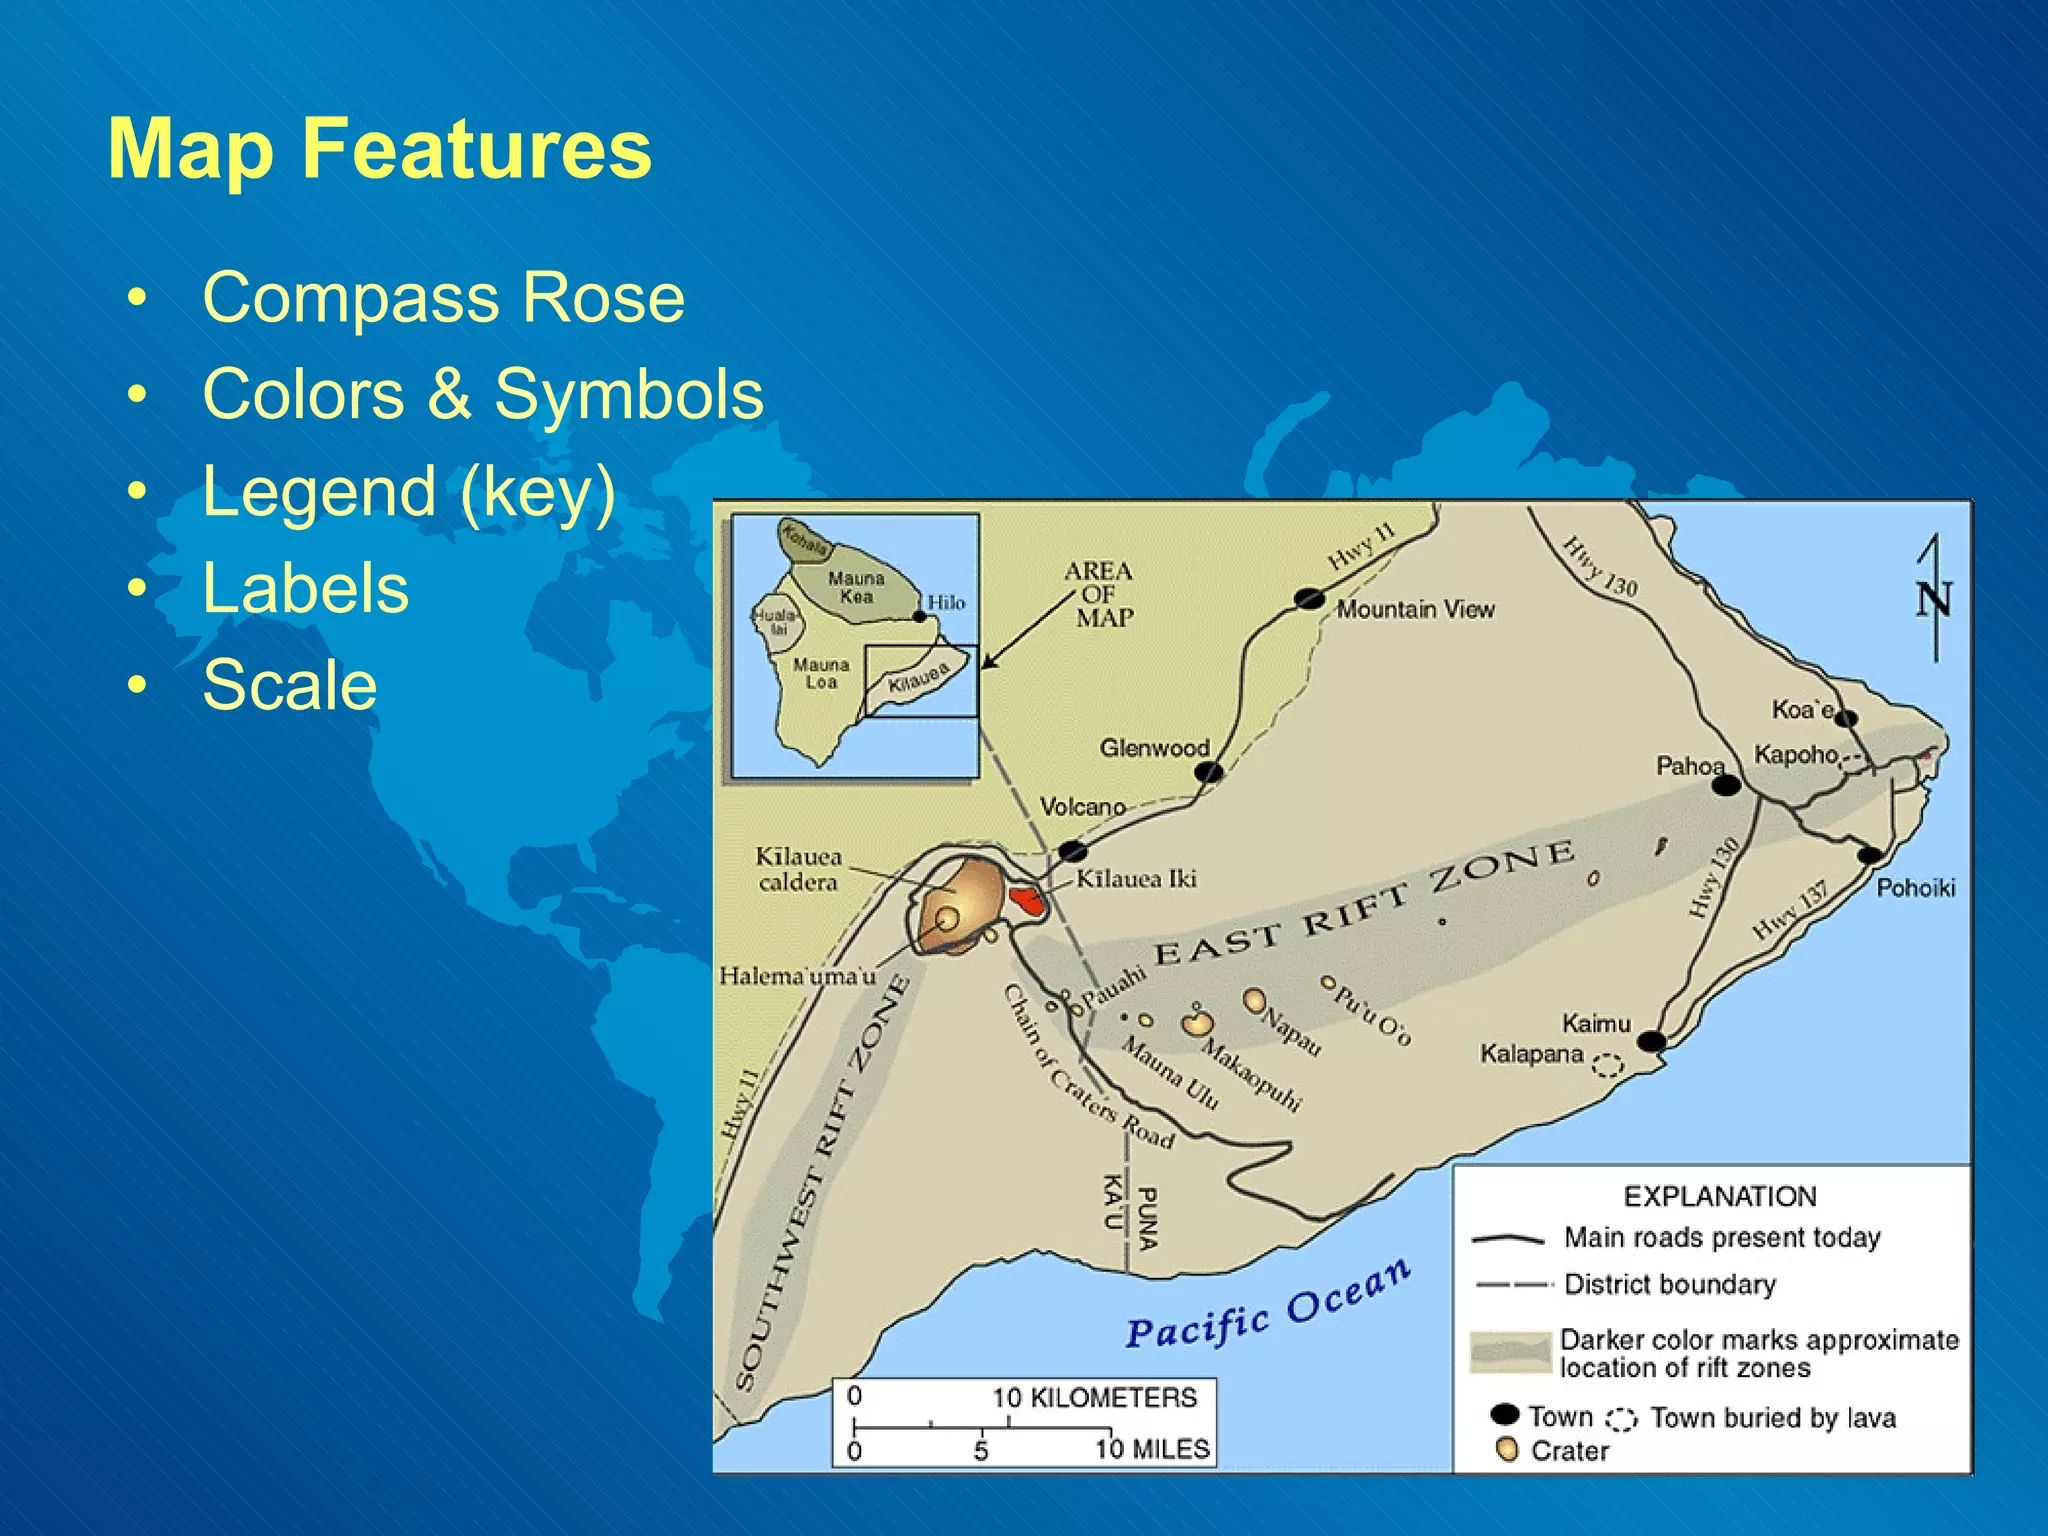
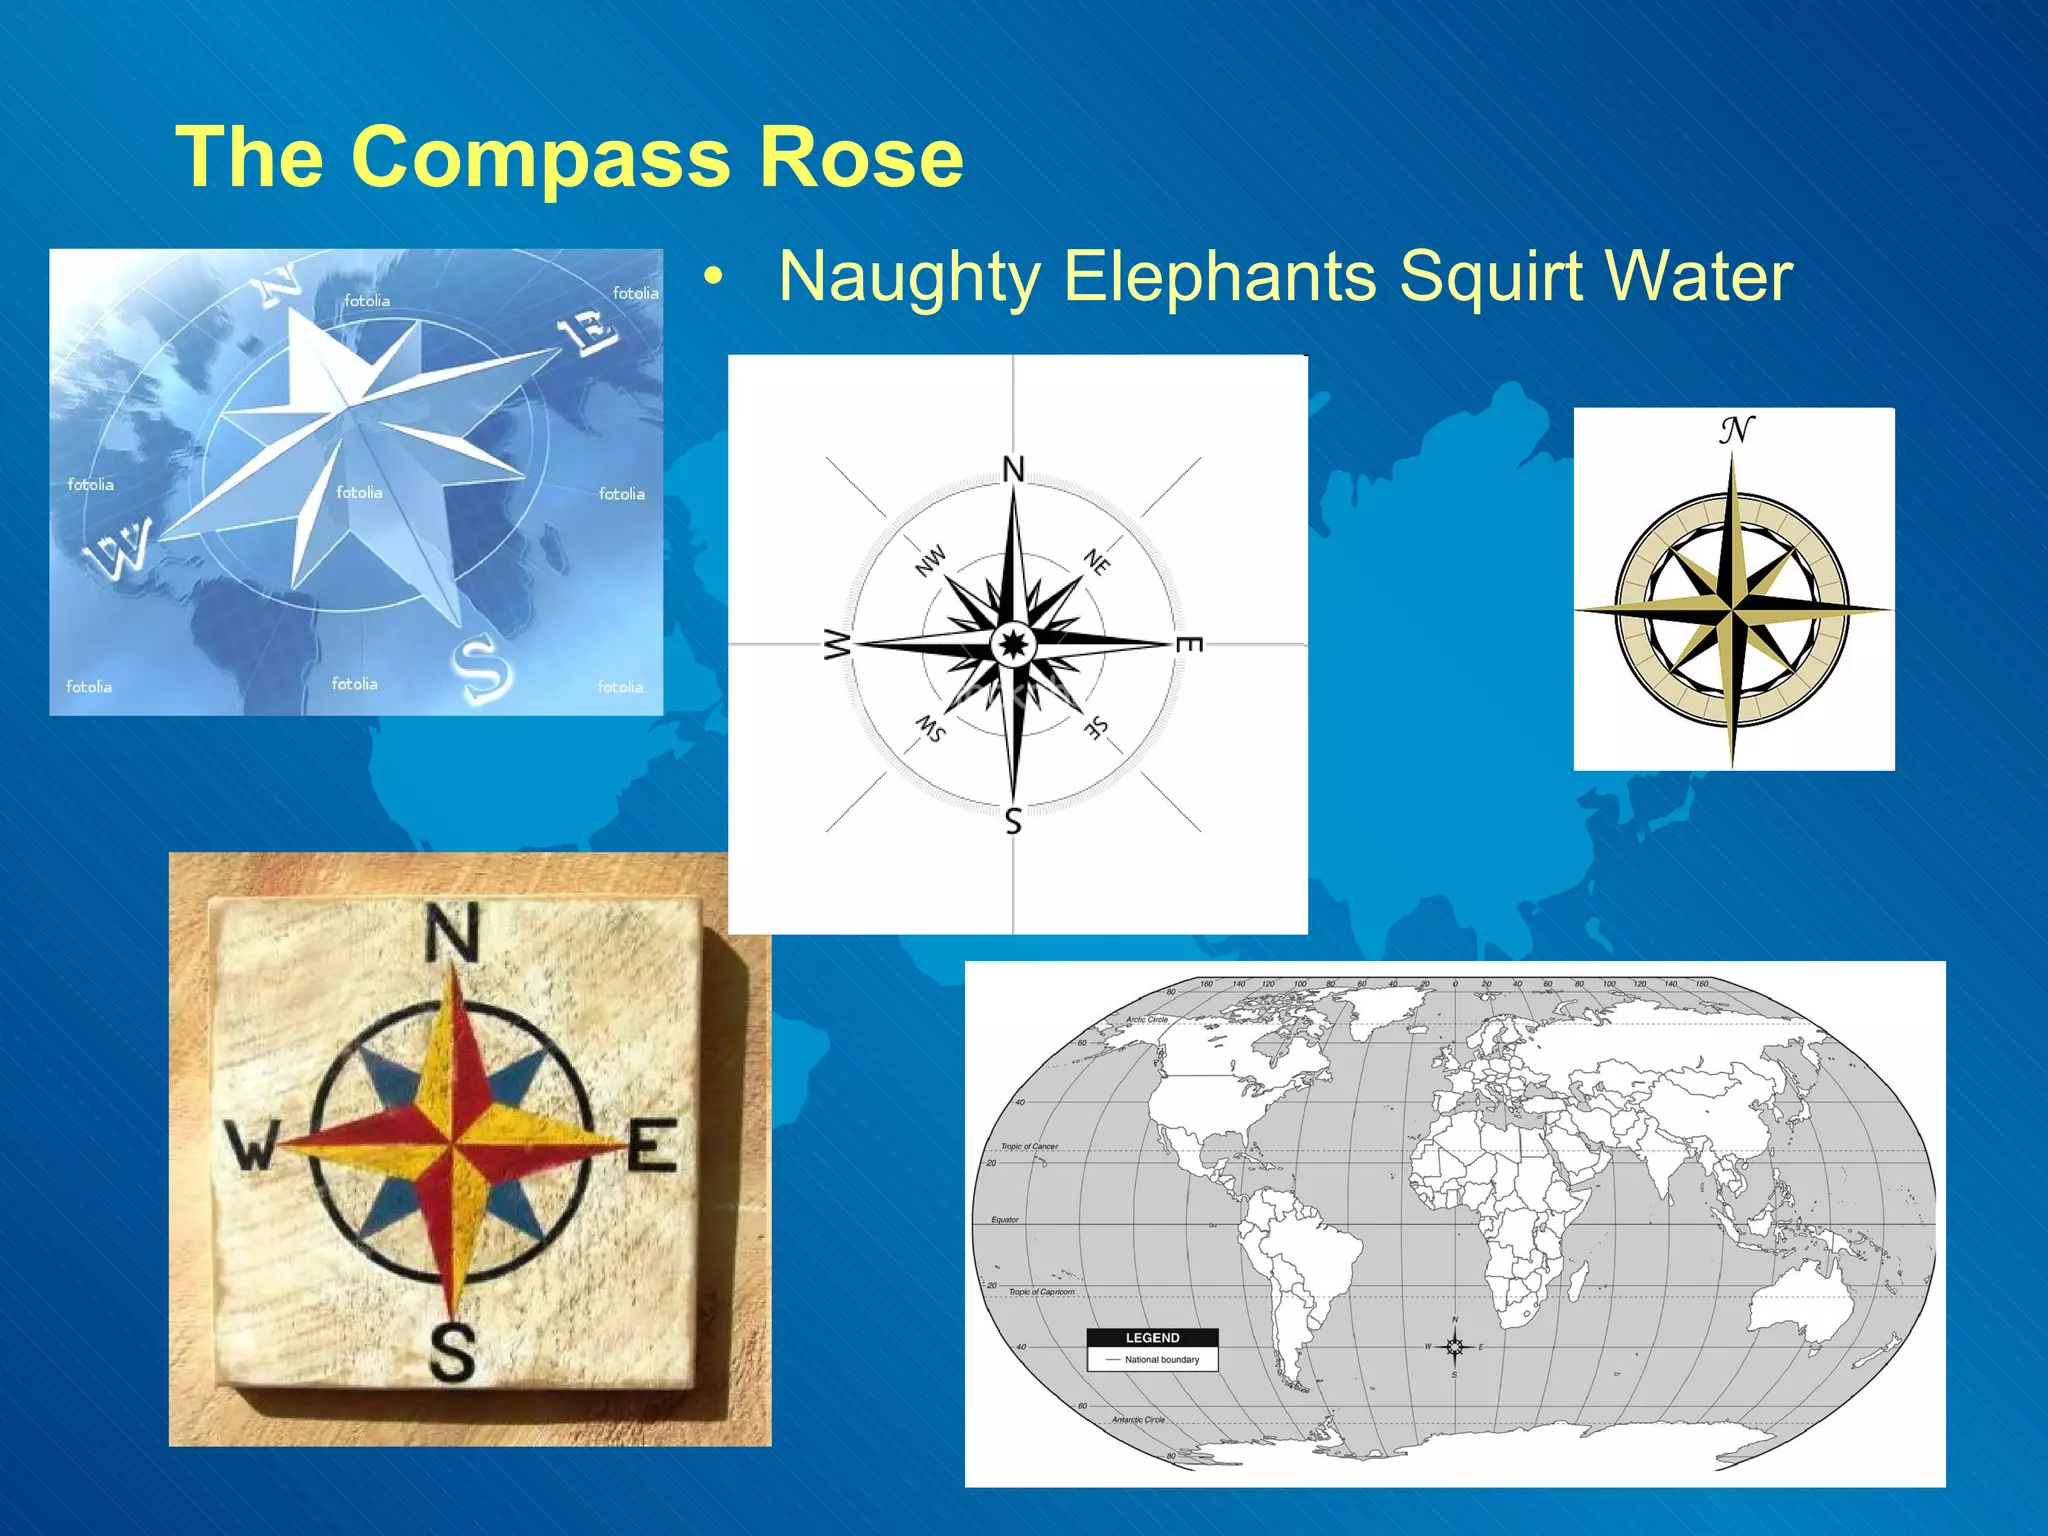
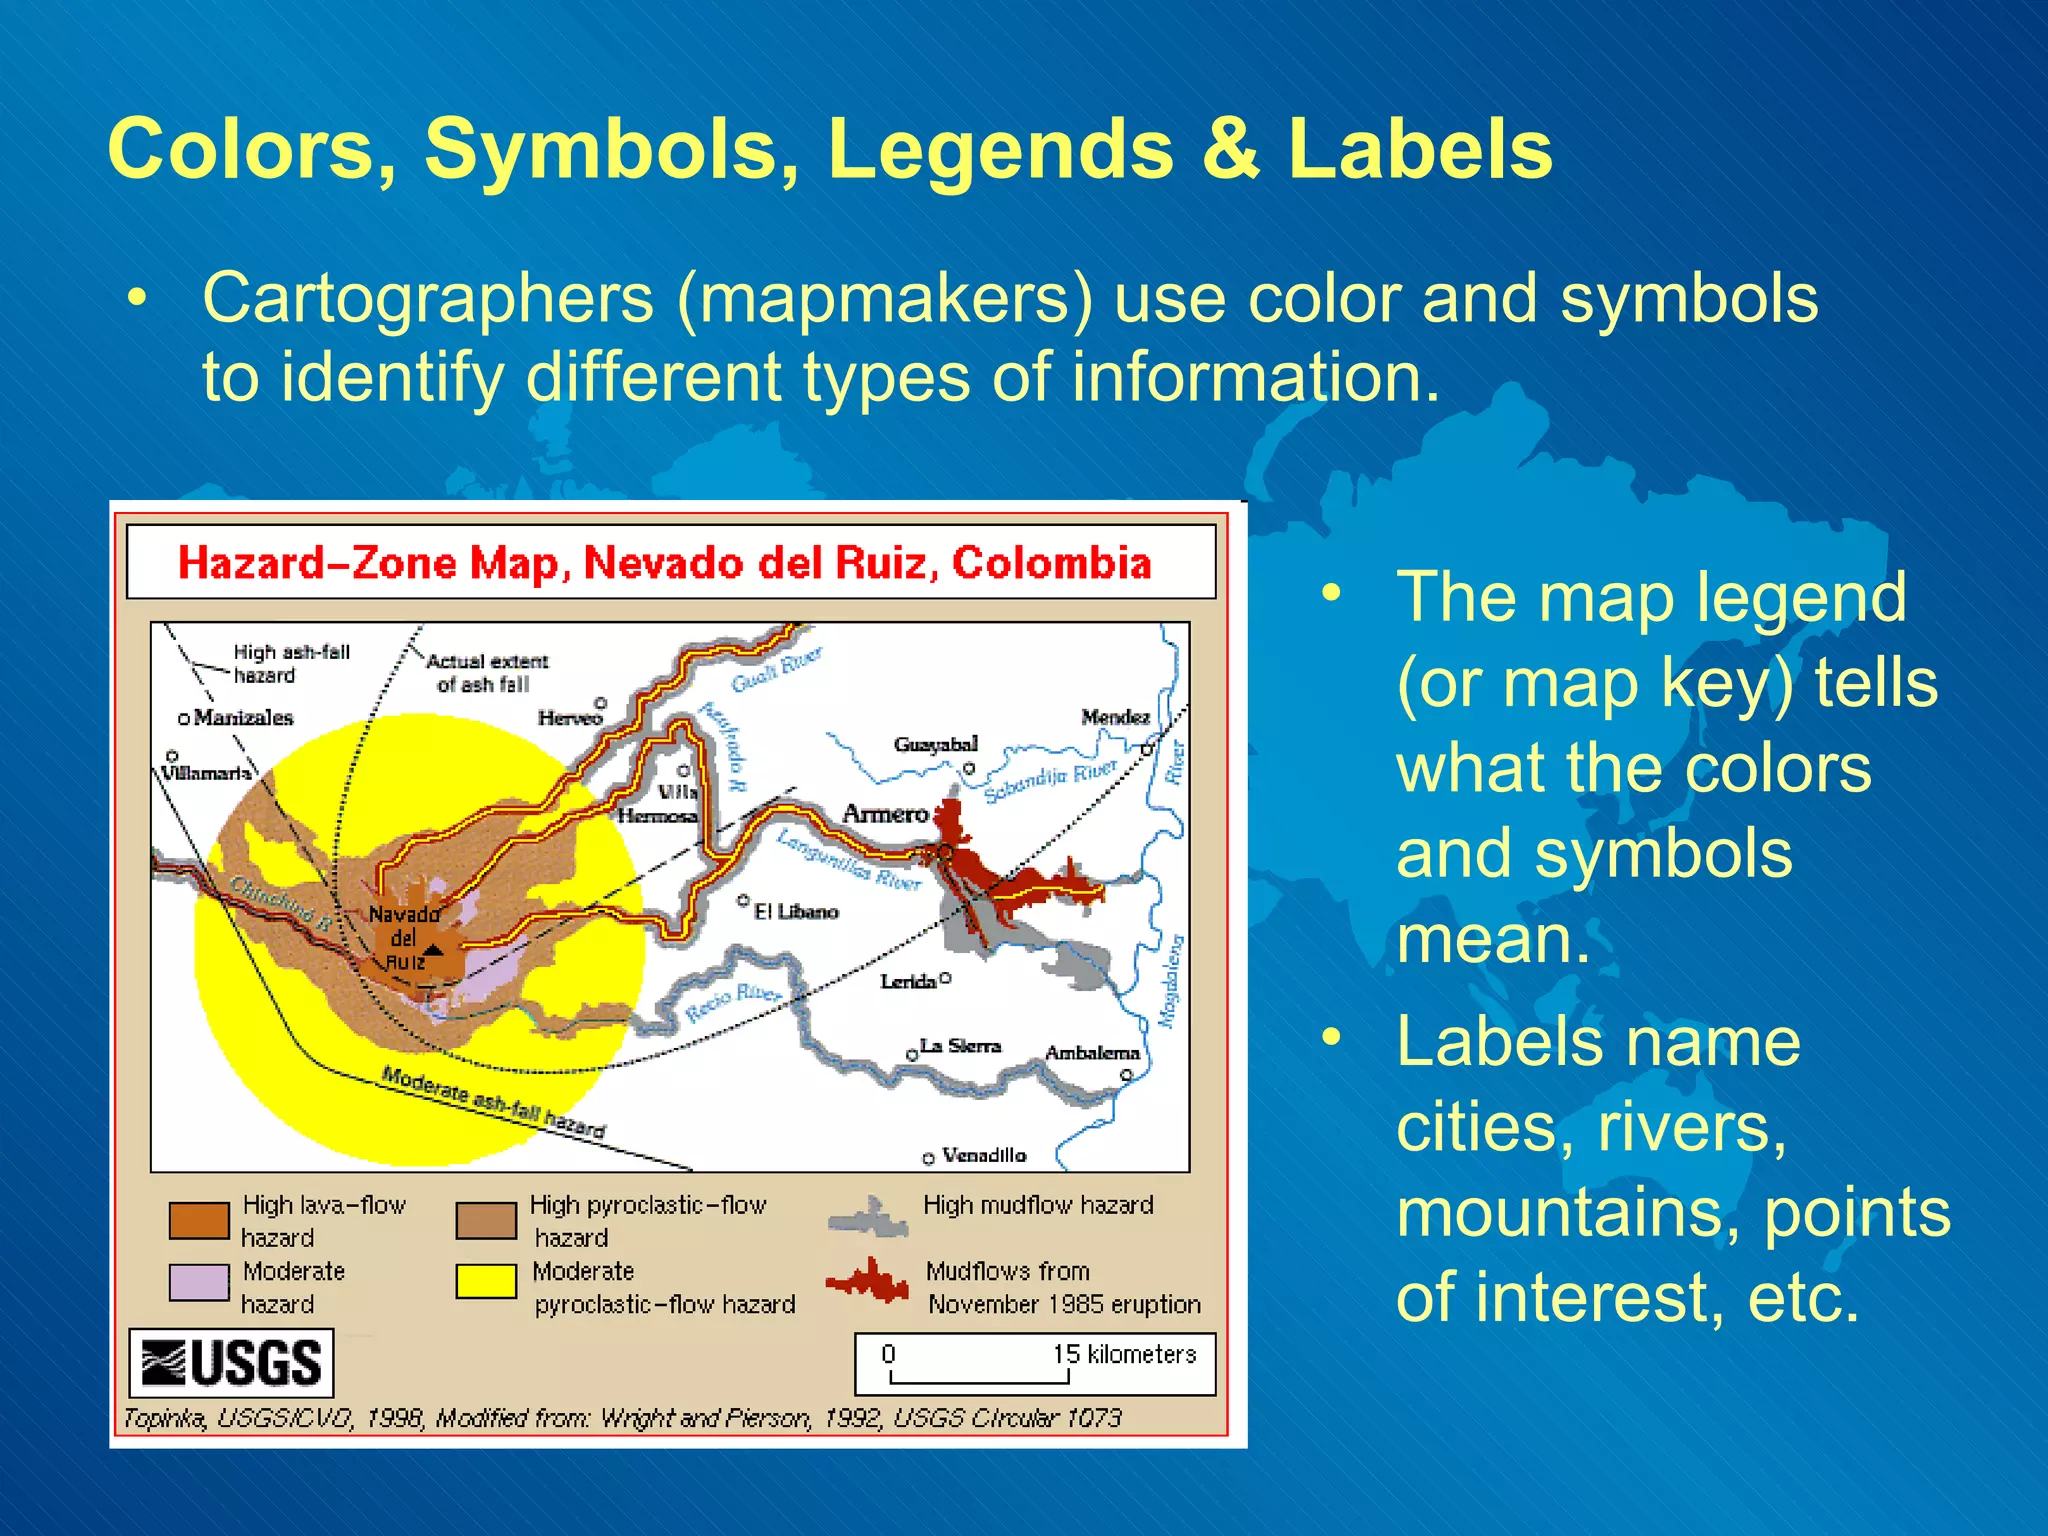
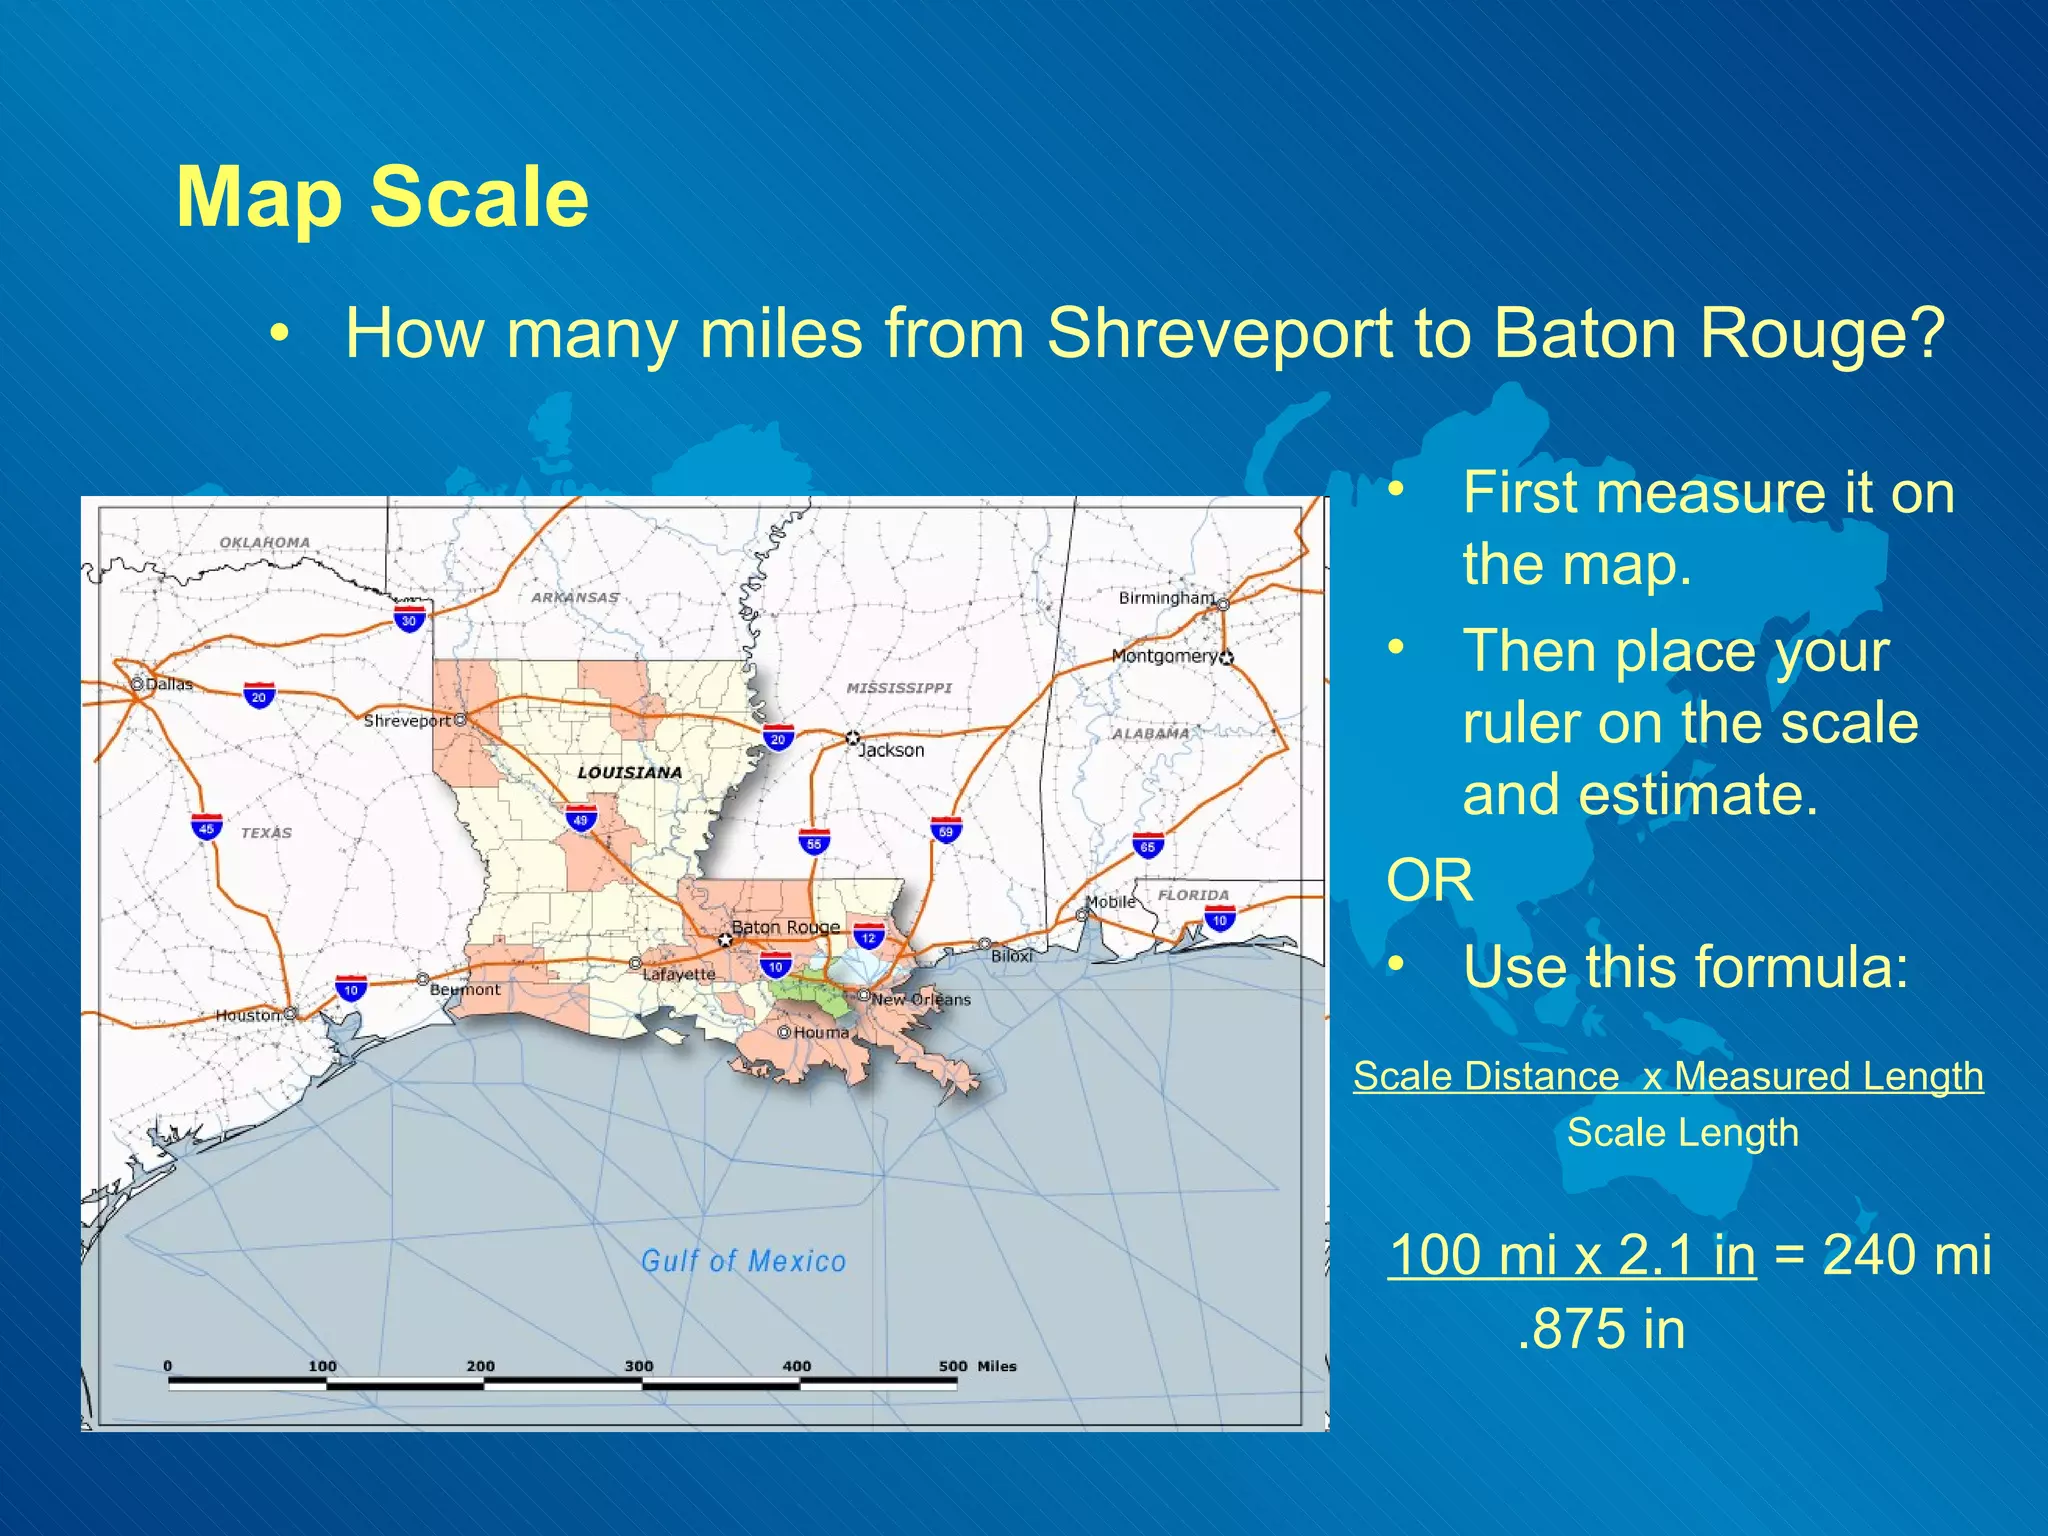
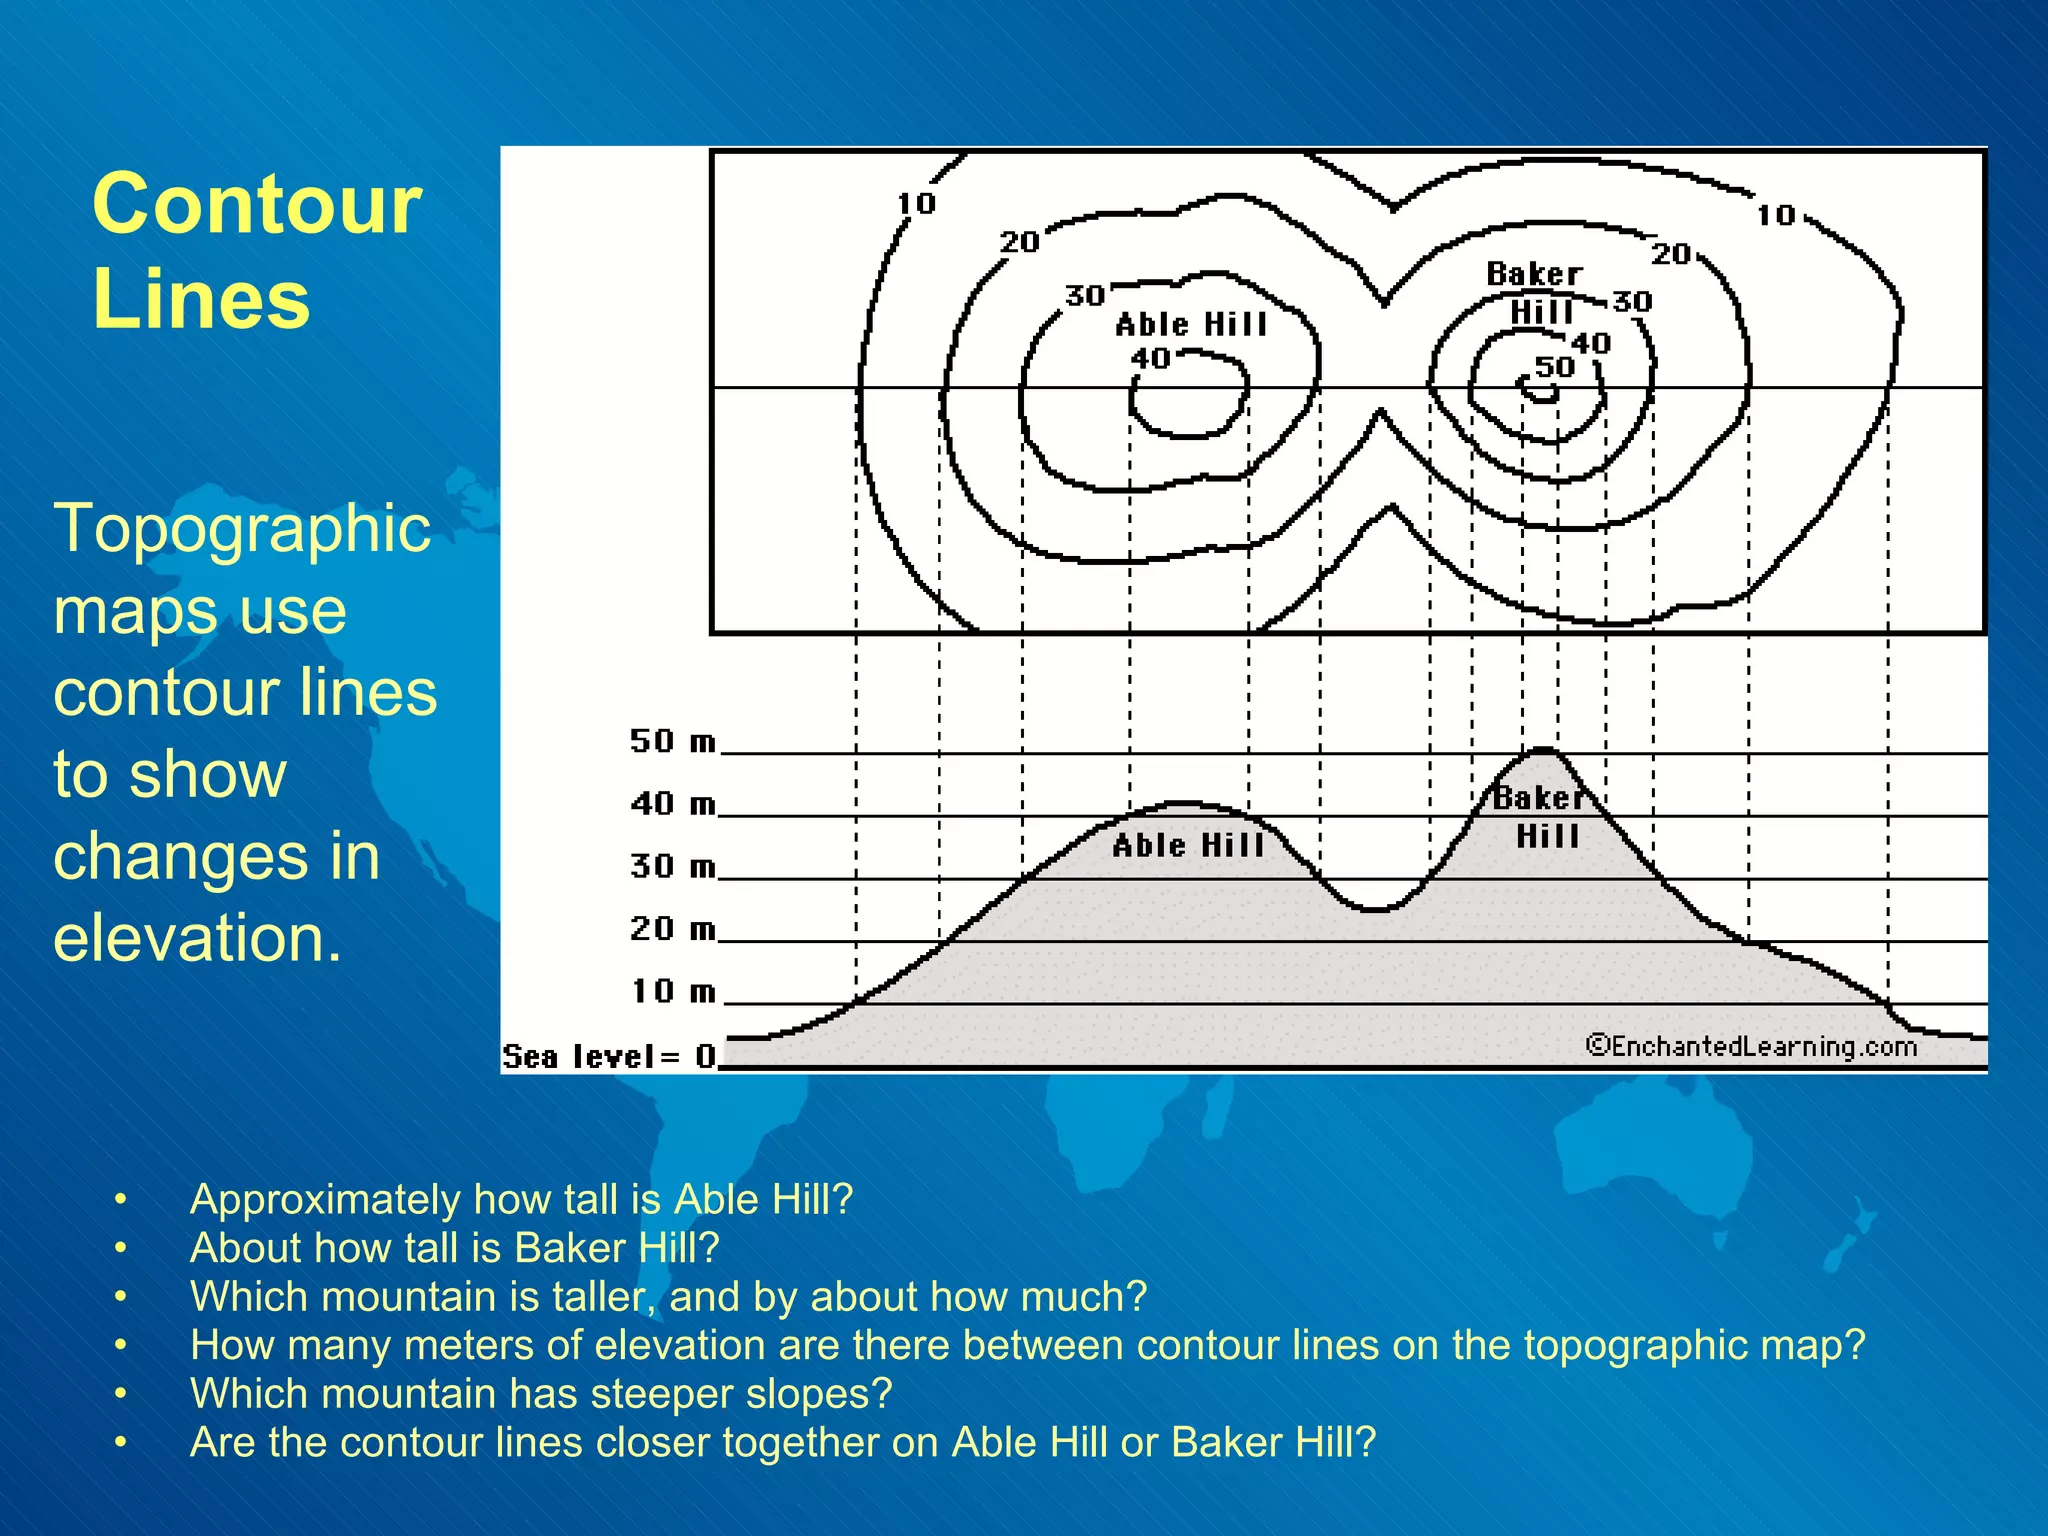
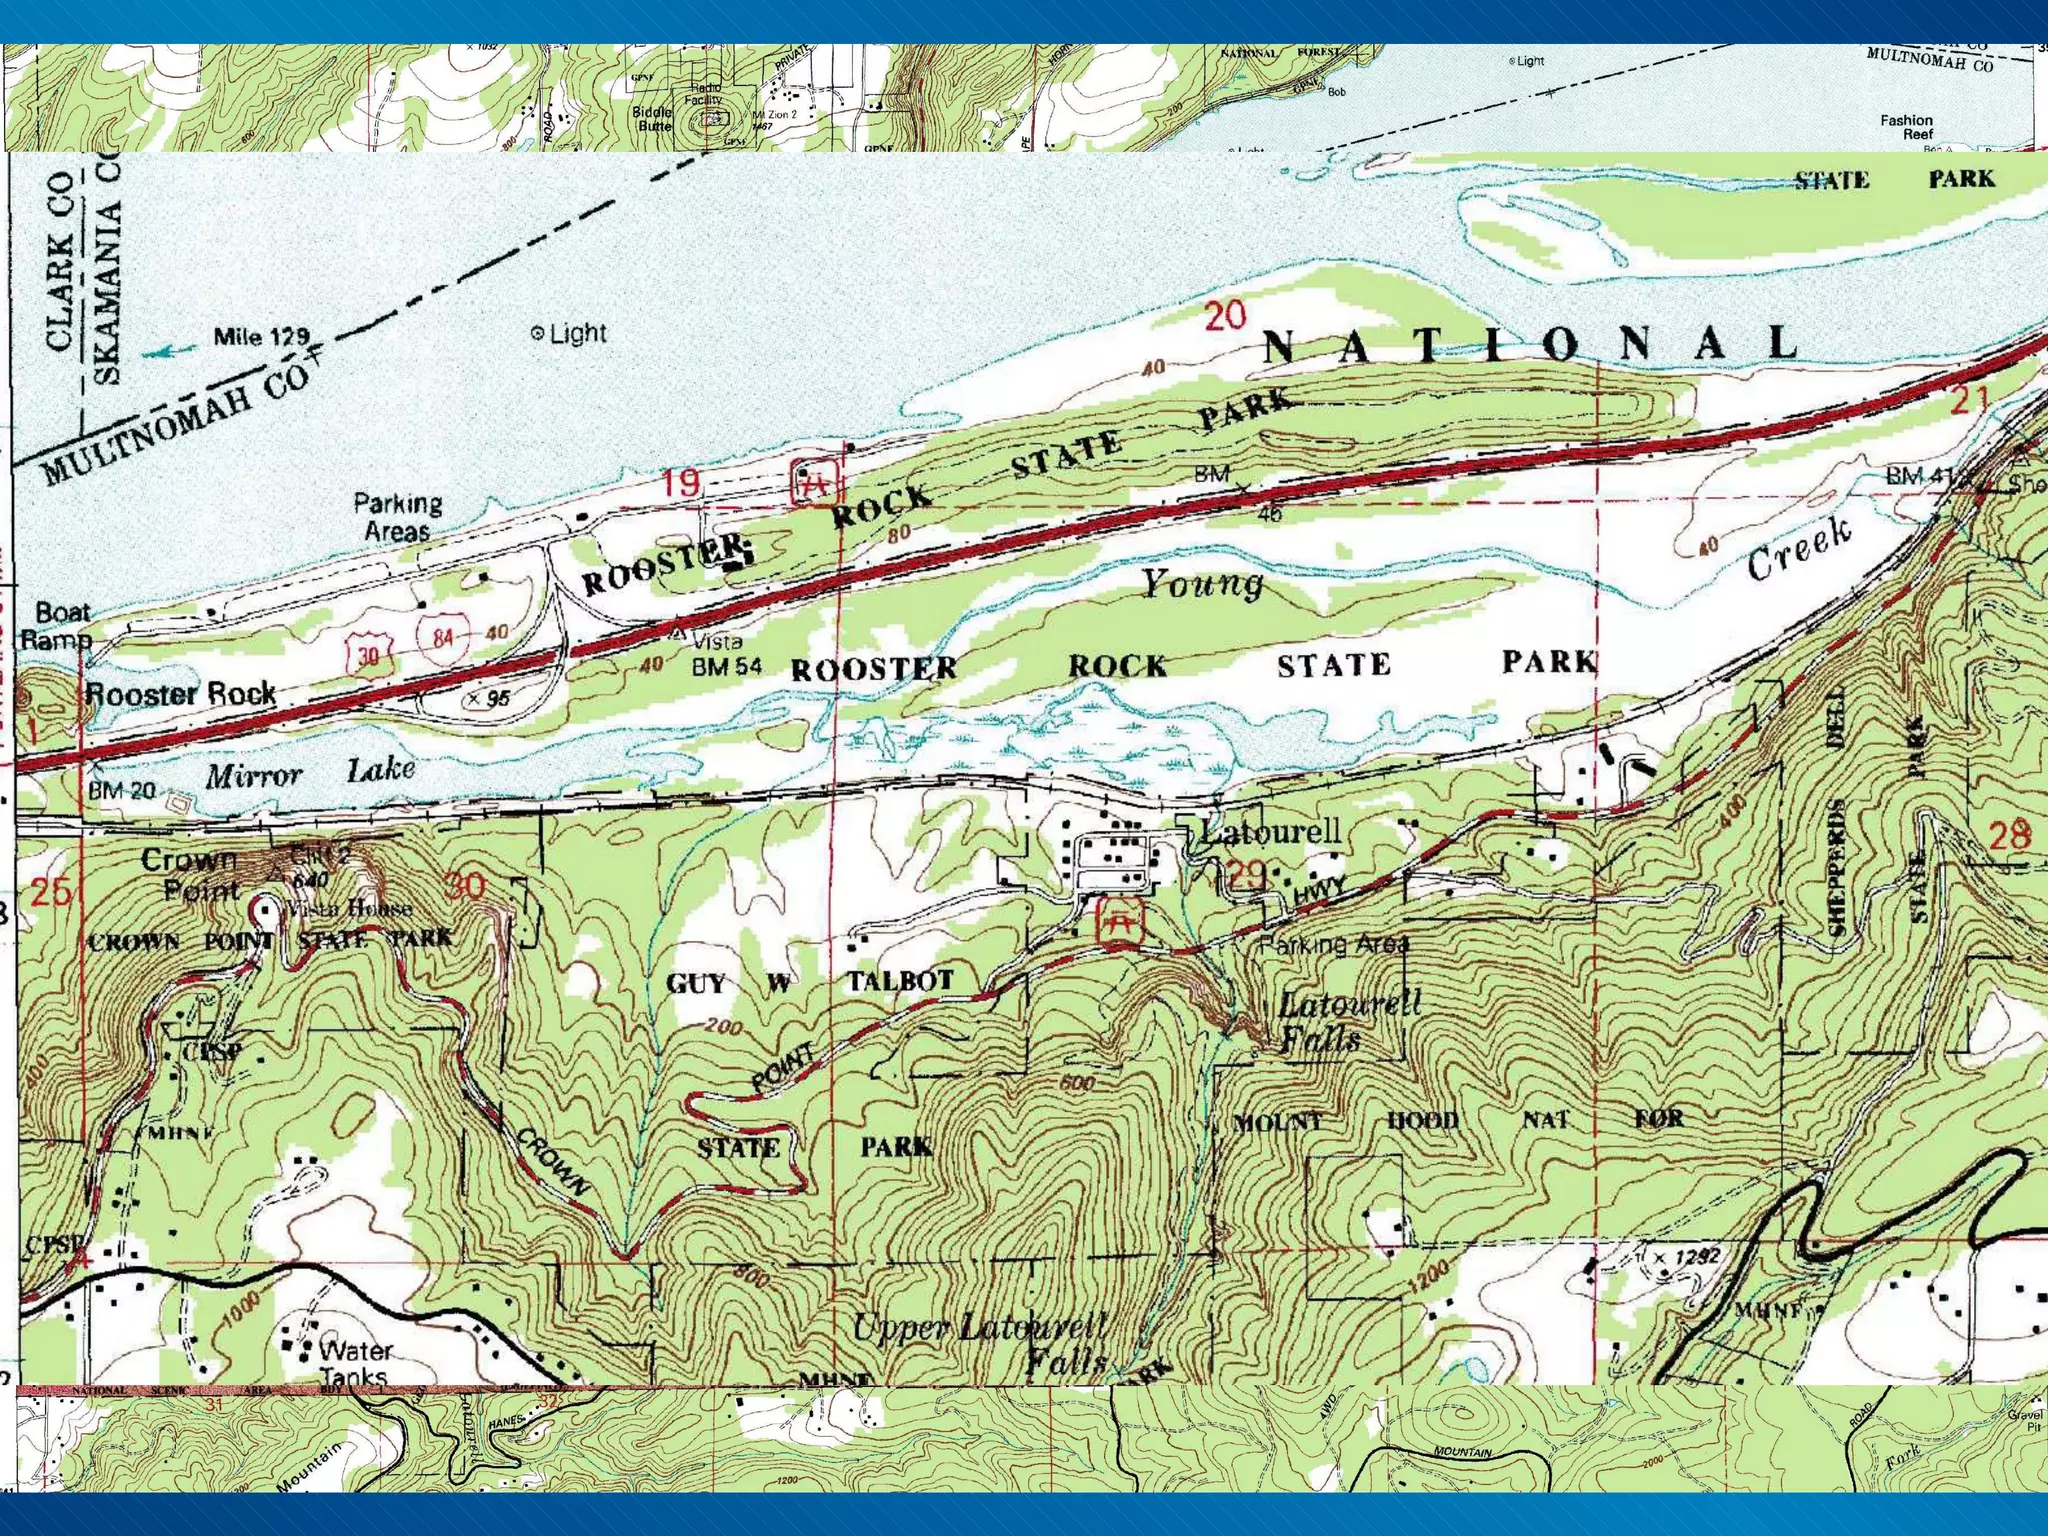
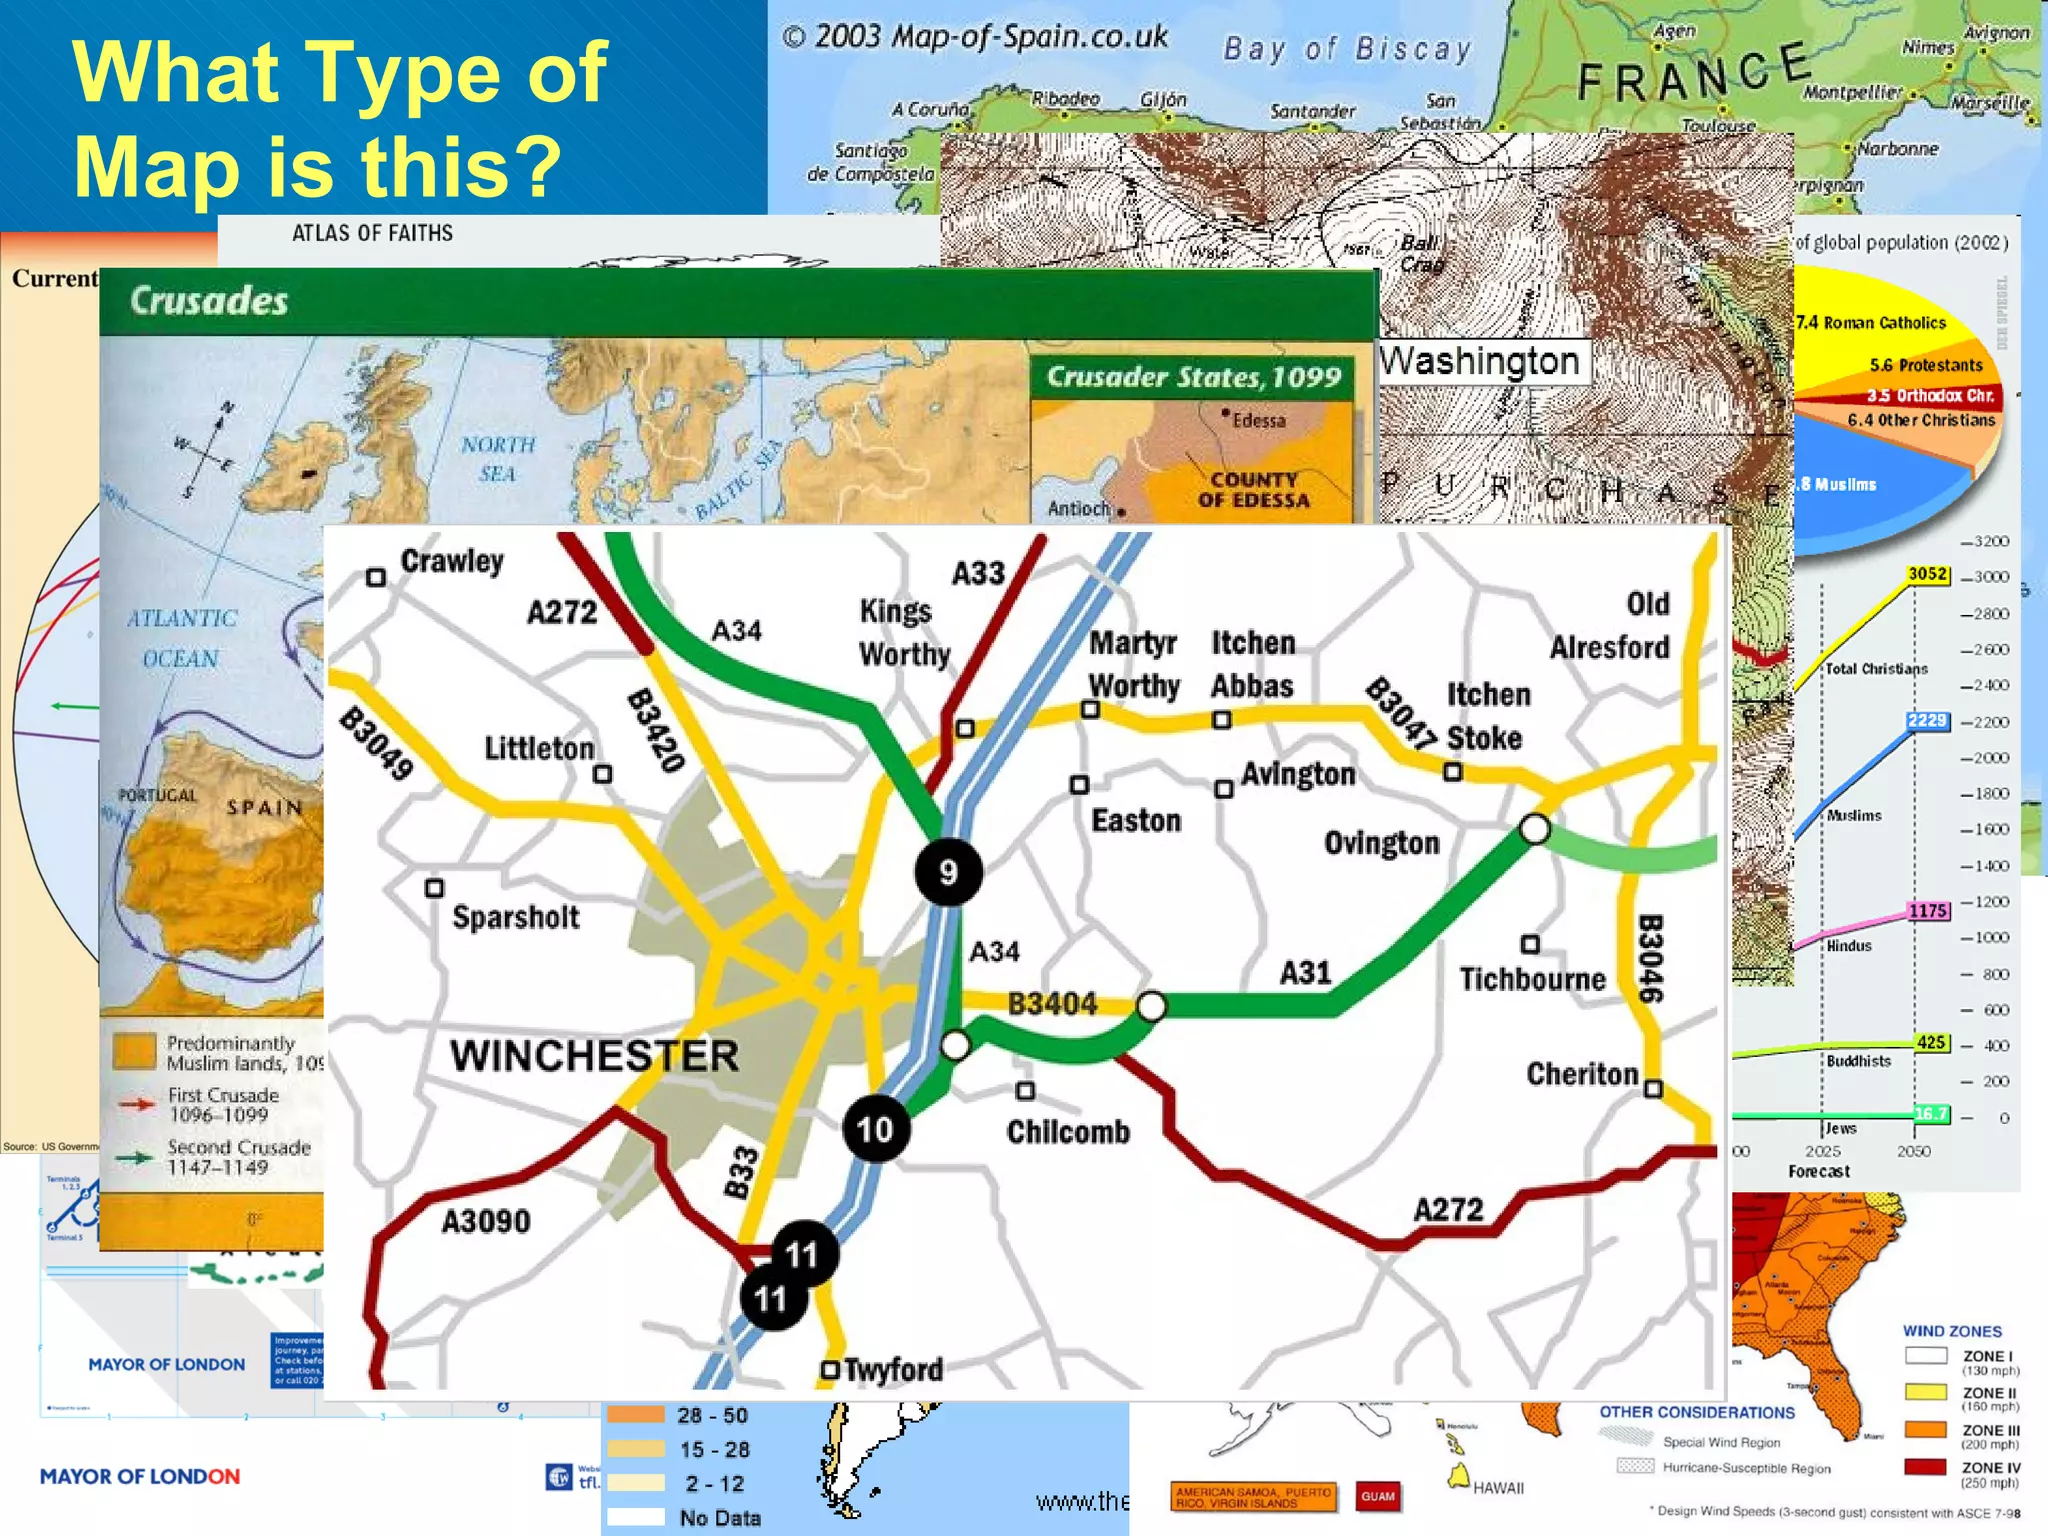
Mapping the Earth
World Geography Review North America South America Africa Australia/Oceania Asia Europe Antarctica Pacific Ocean Atlantic Ocean Indian Ocean Arctic Ocean
Types of Maps
Physical Maps illustrate the physical features of an area, such as the mountains, rivers and lakes
Political maps indicate state and national boundaries as well as capital and major cities.
Road maps show major roads, airports, railroad tracks, cities and other points of interest in an area.
Topographic maps include contour lines to show the shape and elevation of an area
Climate Maps give general information about the climate and precipitation (rain and snow) of a region
Economic or Resource Maps feature the type of natural resources or economic activity that dominates an area  Germany
Historical Maps display dynamic information about historical events such as international conflict, battles, colonization, and settlement
Map Projections Cylindrical Conic Planar
Map Projections Mercator cylindrical projection Albers or Lambert conic projections Azimuthal  planar projection
Map Features Compass Rose Colors & Symbols Legend (key) Labels Scale
The Compass Rose Naughty Elephants Squirt Water
Colors, Symbols, Legends & Labels Cartographers (mapmakers) use color and symbols to identify different types of information. The map legend (or map key) tells what the colors and symbols mean. Labels name cities, rivers, mountains, points of interest, etc.
Map Scale How many miles from Shreveport to Baton Rouge? First measure it on the map. Then place your ruler on the scale and estimate. OR Use this formula: Scale Distance  x Measured Length   Scale Length Ā  Ā  100 mi x 2.1 in  = 240 mi .875 inĀ  Ā Ā Ā Ā  Ā  Ā Ā Ā Ā Ā Ā Ā Ā Ā Ā Ā Ā Ā Ā 
Contour Lines Approximately how tall is Able Hill? About how tall is Baker Hill? Which mountain is taller, and by about how much? How many meters of elevation are there between contour lines on the topographic map? Which mountain has steeper slopes? Are the contour lines closer together on Able Hill or Baker Hill? Topographic maps use contour lines to show changes in elevation.
Intro to maps: nationalmap.gov  video
Explore Your World Get into groups of 2 or 3. Find something in your book/atlas that intrigues you. Formulate a question you have about the interesting picture/map/graph/text you found. Share your question with your group. You have 5 minutes to complete this drill Ready Set GO!
Latitude & Longitude Coordinates that describe locations on Earth i.e. Guatemala is 15Āŗ 30' N and 90Āŗ 15' W latitude is always given first, followed by longitude Angles of arc  o  = degrees ' = minutes " = seconds 20 o  angle 0 o 90 o  180 o  360 o  60 min. in a degree 60 sec. in a minute 15Āŗ 30' = 15.5 o
Latitude  Parallels  (lines of latitude) lateral (side to side) lines circle the globe circles extend North and South of the Equator units of degrees correspond to angles from center of Earth 20 o  N Equator 0 o North Pole 90 o  N Equator is latitude 0 o   (circling the middle of the globe) Poles are latitude 90 o   (at "top" and "bottom" of the globe) latitude 45 o  is halfway between the Equator and pole in each direction
Longitude Meridians  (lines of longitude)  lines run "up and down" from North to South pole  units of degrees correspond to angles from center of Earth Equator North Pole Prime Meridian 30 o  E 30 o  W Prime Meridian  is 0 o  longitude  (through the Royal Astronomical Observatory in Greenwich, England) meridians run 180 o  East and 180 o  West from the Prime Meridian  each 15 o  of longitude corresponds to a different time zone
How Latitude and Longitude Work Let's find 13° N, 122° E  Prime Meridian Equator
What Type of Map is this?
Ā 

Mapping the earth

  • 1.
  • 2.
    World Geography ReviewNorth America South America Africa Australia/Oceania Asia Europe Antarctica Pacific Ocean Atlantic Ocean Indian Ocean Arctic Ocean
  • 3.
  • 4.
    Physical Maps illustratethe physical features of an area, such as the mountains, rivers and lakes
  • 5.
    Political maps indicatestate and national boundaries as well as capital and major cities.
  • 6.
    Road maps showmajor roads, airports, railroad tracks, cities and other points of interest in an area.
  • 7.
    Topographic maps includecontour lines to show the shape and elevation of an area
  • 8.
    Climate Maps givegeneral information about the climate and precipitation (rain and snow) of a region
  • 9.
    Economic or ResourceMaps feature the type of natural resources or economic activity that dominates an area Germany
  • 10.
    Historical Maps displaydynamic information about historical events such as international conflict, battles, colonization, and settlement
  • 11.
  • 12.
    Map Projections Mercatorcylindrical projection Albers or Lambert conic projections Azimuthal planar projection
  • 13.
    Map Features CompassRose Colors & Symbols Legend (key) Labels Scale
  • 14.
    The Compass RoseNaughty Elephants Squirt Water
  • 15.
    Colors, Symbols, Legends& Labels Cartographers (mapmakers) use color and symbols to identify different types of information. The map legend (or map key) tells what the colors and symbols mean. Labels name cities, rivers, mountains, points of interest, etc.
  • 16.
    Map Scale Howmany miles from Shreveport to Baton Rouge? First measure it on the map. Then place your ruler on the scale and estimate. OR Use this formula: Scale Distance x Measured Length Scale Length Ā  Ā  100 mi x 2.1 in = 240 mi .875 inĀ  Ā Ā Ā Ā  Ā  Ā Ā Ā Ā Ā Ā Ā Ā Ā Ā Ā Ā Ā Ā 
  • 17.
    Contour Lines Approximatelyhow tall is Able Hill? About how tall is Baker Hill? Which mountain is taller, and by about how much? How many meters of elevation are there between contour lines on the topographic map? Which mountain has steeper slopes? Are the contour lines closer together on Able Hill or Baker Hill? Topographic maps use contour lines to show changes in elevation.
  • 18.
    Intro to maps:nationalmap.gov video
  • 19.
    Explore Your WorldGet into groups of 2 or 3. Find something in your book/atlas that intrigues you. Formulate a question you have about the interesting picture/map/graph/text you found. Share your question with your group. You have 5 minutes to complete this drill Ready Set GO!
  • 20.
    Latitude & LongitudeCoordinates that describe locations on Earth i.e. Guatemala is 15Āŗ 30' N and 90Āŗ 15' W latitude is always given first, followed by longitude Angles of arc o = degrees ' = minutes " = seconds 20 o angle 0 o 90 o 180 o 360 o 60 min. in a degree 60 sec. in a minute 15Āŗ 30' = 15.5 o
  • 21.
    Latitude Parallels (lines of latitude) lateral (side to side) lines circle the globe circles extend North and South of the Equator units of degrees correspond to angles from center of Earth 20 o N Equator 0 o North Pole 90 o N Equator is latitude 0 o (circling the middle of the globe) Poles are latitude 90 o (at "top" and "bottom" of the globe) latitude 45 o is halfway between the Equator and pole in each direction
  • 22.
    Longitude Meridians (lines of longitude) lines run "up and down" from North to South pole units of degrees correspond to angles from center of Earth Equator North Pole Prime Meridian 30 o E 30 o W Prime Meridian is 0 o longitude (through the Royal Astronomical Observatory in Greenwich, England) meridians run 180 o East and 180 o West from the Prime Meridian each 15 o of longitude corresponds to a different time zone
  • 23.
    How Latitude andLongitude Work Let's find 13° N, 122° E Prime Meridian Equator
  • 24.
    What Type ofMap is this?
  • 25.

Editor's Notes

  • #2Ā Review continents: N. & S. America, Europe/Asia, Africa, Austrailia/Oceania, Antarctica Review Oceans:
  • #3Ā Continents, then oceans. (Southern Ocean not listed) Middle East is a part of Asia, Greenland is a part of North America
  • #4Ā Old World map from 1500s, shortly after Columbus sailed to the New World Sightseeing map of Bulgaria Native Eskimo Languages of Alaska
  • #5Ā illustrate the physical features of an area, such as the mountains, rivers and lakes. The water is usually shown in blue. Colors are used to show relief—differences in land elevations. Green is typically used at lower elevations, and orange or brown indicate higher elevations.
  • #6Ā do not show physical features. Instead, they indicate state and national boundaries and capital and major cities. A capital city is usually marked with a star within a circle.
  • #7Ā road maps of Spain and Pakistan, tourist map of ?Belgium?
  • #8Ā Lines that are close together indicate steep terrain, and lines that are far apart indicate flat terrain. Very important for hikers and military or anyone traveling off-road or through the wilderness.
  • #9Ā Mapmakers, use colors to show different climate or precipitation zones.
  • #10Ā Cartographers use symbols to show the locations of natural resources or economic activities. For example, oranges on a map of Florida tell you that oranges are grown there.
  • #11Ā Civil war battles, Oregon trail and Pearl Harbor
  • #13Ā All are most accurate at points which touch the globe. Mercator is a cylindrical projection useful during sea navigation because the cardinal directions (N, S, E, W) are displayed as straight lines. Conic projections are generally used for smaller areas, such as maps of the U.S. Azimuthal projections are helpful for mapping air-travel routes because they can accurately show the shortest distance between two points.
  • #17Ā If all we had was this map and we happened to be in Shreveport, LA, it would be fairly simple to determine how many miles we'd need to drive before reaching Baton Rouge (the state capitol).
  • #19Ā Columbia Gorge - if you needed to get from "25" to "30", the quickest path would not be a straight line. Look at roads, railroads and notice how many lines of elevation are crossed.
  • #21Ā 30 minutes is the same as ½ a degree, so it's easier to use decimals.
  • #22Ā 45 th Parallel
  • #23Ā Where do the Prime Meridian and the Equator cross? 360degrees/24hours=15
  • #24Ā Where are the Prime Meridian and Equator? The Philippines
  • #25Ā Old World map from 1500s, shortly after Columbus sailed to the New World Sightseeing map of Bulgaria Native Eskimo Languages of Alaska