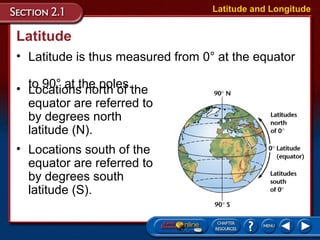
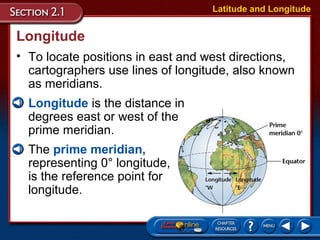
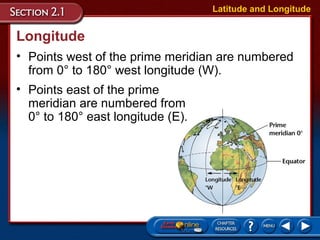
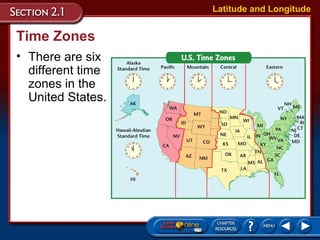
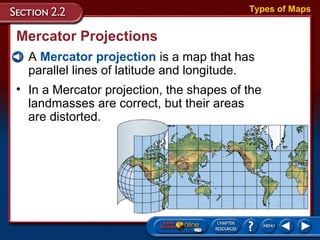
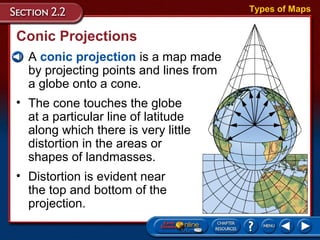
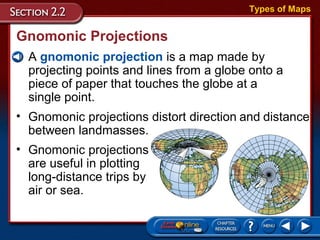
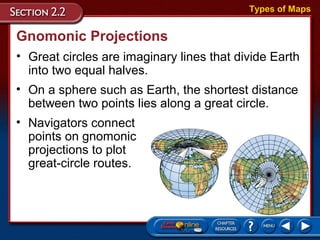
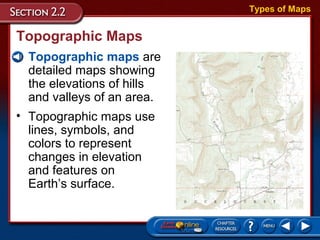
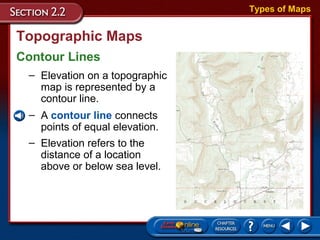
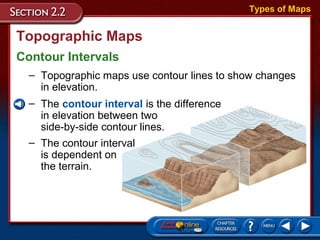
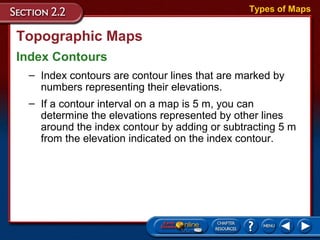
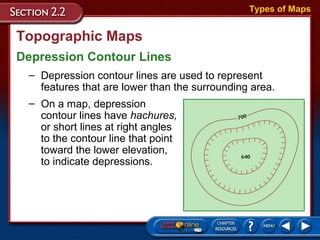
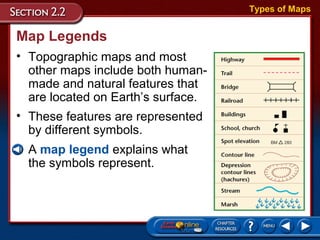
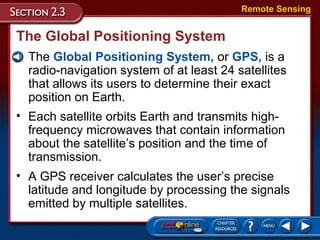
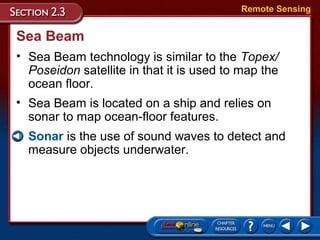
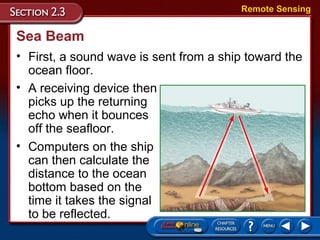
Objectives
• Compare and contrast latitude and longitude.
Latitude and Longitude
• Describe how time zones vary.
– cartography
– equator
– latitude
– longitude
– prime meridian
– International Date Line
Vocabulary
• Cartographers use an imaginary grid of parallel
lines and vertical lines to locate points on Earth.
• The equator circles Earth halfway between the
north and south poles separating Earth into two
equal halves called the northern hemisphere
and the southern hemisphere.
• Cartography is the science of mapmaking.
Latitude and Longitude
• For thousands of years, people have used maps
to define borders and to find places.
Latitude and Longitude
Latitude
• Lines of latitude are lines running parallel to
the equator.
Latitude and Longitude
• Latitude is the distance in
degrees north or south of
the equator.
Latitude
• Latitude is thus measured from 0° at the equator
to 90° at the poles.
Latitude and Longitude
• Locations north of the
equator are referred to
by degrees north
latitude (N).
• Locations south of the
equator are referred to
by degrees south
latitude (S).
Latitude
Degrees of Latitude
Latitude and Longitude
– Each degree of latitude is equivalent to about
111 km on Earth’s surface.
– To locate positions on Earth more precisely,
cartographers break down degrees of latitude into
60 smaller units, called minutes (´).
– A minute of latitude can be further divided into
seconds (´´).
– Longitude is also divided into degrees, minutes,
and seconds.
Longitude
• To locate positions in east and west directions,
cartographers use lines of longitude, also known
as meridians.
Latitude and Longitude
• Longitude is the distance in
degrees east or west of the
prime meridian.
• The prime meridian,
representing 0° longitude,
is the reference point for
longitude.
Longitude
• Points west of the prime meridian are numbered
from 0° to 180° west longitude (W).
Latitude and Longitude
• Points east of the prime
meridian are numbered from
0° to 180° east longitude (E).
Longitude
Semicircles
Latitude and Longitude
– Lines of longitude are not parallel; they are large
semicircles that extend vertically from pole to pole.
– The distances covered by
degrees of longitude vary
with location.
– One degree of longitude
varies from about 111 km
at the equator to essentially
the distance covered by a
point at the poles.
Degrees of Longitude
Longitude
Locating Places with Coordinates
Latitude and Longitude
– Both latitude and longitude
are needed to precisely
locate positions on Earth.
– For example, the location
of New Orleans is
29°57´N, 90°04´W.
– Note that latitude comes
first in reference to the
coordinates of a
particular location.
Time Zones
• Because Earth takes about 24 hours to rotate
once on its axis, it is divided into 24 times zones,
each representing a different hour.
Latitude and Longitude
Time Zones
• Each time zone is 15° wide, corresponding
roughly to lines of longitude.
Latitude and Longitude
• Time zone boundaries have been adjusted in
local areas for convenience.
Time Zones
• There are six
different time
zones in the
United States.
Latitude and Longitude
Time Zones
Calendar Dates
Latitude and Longitude
– Every time zone experiences this transition from one
day to the next, with the calendar advancing to the next
day at midnight.
– Each time you travel through a time zone, you gain or
lose time, eventually gaining or losing an entire day.
– The International Date Line, or 180° meridian, serves
as the transition line for calendar days.
– Traveling west across the International Date Line, you
would advance your calendar one day.
– Traveling east, you would move your calendar back
one day.
Objectives
• Compare and contrast different map projections.
• Analyze topographic maps.
• Describe map characteristics, such as map scales
and map legends
– Mercator projection
– conic projection
– gnomonic projection
– topographic map
– contour line
– contour interval
– map legend
– map scale
Vocabulary
Types of Maps
Types of Maps
• Maps are flat models of a three-dimensional
object, Earth.
Types of Maps
• All flat maps distort to some degree either the
shapes or the areas of landmasses.
• Cartographers use projections to make maps.
• A map projection is made by transferring points
and lines on a globe’s surface onto a sheet
of paper.
Mercator Projections
• A Mercator projection is a map that has
parallel lines of latitude and longitude.
Types of Maps
• In a Mercator projection, the shapes of the
landmasses are correct, but their areas
are distorted.
Conic Projections
• A conic projection is a map made
by projecting points and lines from
a globe onto a cone.
Types of Maps
• The cone touches the globe
at a particular line of latitude
along which there is very little
distortion in the areas or
shapes of landmasses.
• Distortion is evident near
the top and bottom of the
projection.
Gnomonic Projections
• A gnomonic projection is a map made by
projecting points and lines from a globe onto a
piece of paper that touches the globe at a
single point.
Types of Maps
• Gnomonic projections distort direction and distance
between landmasses.
• Gnomonic projections
are useful in plotting
long-distance trips by
air or sea.
Gnomonic Projections
• Great circles are imaginary lines that divide Earth
into two equal halves.
Types of Maps
• On a sphere such as Earth, the shortest distance
between two points lies along a great circle.
• Navigators connect
points on gnomonic
projections to plot
great-circle routes.
Topographic Maps
• Topographic maps are
detailed maps showing
the elevations of hills
and valleys of an area.
Types of Maps
• Topographic maps use
lines, symbols, and
colors to represent
changes in elevation
and features on
Earth’s surface.
Topographic Maps
Contour Lines
Types of Maps
– Elevation on a topographic
map is represented by a
contour line.
– A contour line connects
points of equal elevation.
– Elevation refers to the
distance of a location
above or below sea level.
Topographic Maps
Contour Intervals
Types of Maps
– Topographic maps use contour lines to show changes
in elevation.
– The contour interval is the difference
in elevation between two
side-by-side contour lines.
– The contour interval
is dependent on
the terrain.
Topographic Maps
Index Contours
Types of Maps
– Index contours are contour lines that are marked by
numbers representing their elevations.
– If a contour interval on a map is 5 m, you can
determine the elevations represented by other lines
around the index contour by adding or subtracting 5 m
from the elevation indicated on the index contour.
Topographic Maps
Depression Contour Lines
Types of Maps
– Depression contour lines are used to represent
features that are lower than the surrounding area.
– On a map, depression
contour lines have hachures,
or short lines at right angles
to the contour line that point
toward the lower elevation,
to indicate depressions.
• These features are represented
by different symbols.
• A map legend explains what
the symbols represent.
Map Legends
• Topographic maps and most
other maps include both human-
made and natural features that
are located on Earth’s surface.
Types of Maps
• A map scale is the ratio between distances on a
map and actual distances on the surface of Earth.
Map Scales
• When using a map, you need to know how to
measure distances.
Types of Maps
Map Scales
• There are three types of map scales: verbal
scales, graphic scales, and fractional scales.
Types of Maps
– A verbal scale expresses distance as a statement,
such as “One centimeter is equal to one kilometer.”
– A graphic scale consists of a line that represents a
certain distance, such as 5 km or 5 miles.
– A fractional scale expresses distance as a ratio,
such as 1:63 500.
• remote sensing
• electromagnetic spectrum
• frequency
• Landsat satellite
Objectives
• Compare and contrast the different forms of
radiation in the electromagnetic spectrum.
• Discuss how satellites and sonar are used to map
Earth’s surface and its oceans.
• Describe the Global Positioning System.
Vocabulary
Remote Sensing
• Topex/Poseidon satellite
• Global Positioning
System
• sonar
Remote Sensing
• Until recently, mapmakers had to go on-site to
collect the data needed to make maps.
Remote Sensing
• Today, advanced technology has changed the
way maps are made.
• Remote sensing is the process of collecting
data about Earth from far above Earth’s surface.
The Electromagnetic Spectrum
• Satellites detect different wavelengths of energy
reflected or emitted from Earth’s surface.
Remote Sensing
• This energy has both electric and magnetic
properties and is referred to as electromagnetic
radiation.
• Electromagnetic radiation includes visible light,
gamma rays, X rays, ultraviolet waves, infrared
waves, radio waves, and microwaves.
The Electromagnetic Spectrum
Wave Characteristics
Remote Sensing
– All electromagnetic waves travel at the speed of
300 000 km/s in a vacuum, a value commonly referred
to as the speed of light.
– Electromagnetic waves have distinct wavelengths and
frequencies.
– The electromagnetic spectrum is the arrangement of
electromagnetic radiation according to wavelengths.
– Frequency is the number of waves that pass a
particular point each second.
– These unique characteristics help determine how the
energy is used by different satellites to map Earth.
The Electromagnetic Spectrum
Wave Characteristics
Remote Sensing
Landsat Satellites
• A Landsat satellite receives reflected
wavelengths of energy emitted by Earth’s surface,
including some wavelengths of visible light and
infrared radiation.
Remote Sensing
• Since the features on Earth’s surface radiate
warmth at slightly different frequencies, they
show up as different colors in images
Topex/Poseidon Satellite
• The Topex/Poseidon satellite uses radar to
accurately map the ocean surface.
Remote Sensing
• Radar uses high-frequency
signals that are transmitted
from the satellite to the
surface of the ocean.
• A receiving device then
picks up the returning
echo as it is reflected off
the water.
Topex/Poseidon Satellite
• The distance to the water’s surface is
calculated using the known speed of light
and the time it takes for
the signal to be reflected.
Remote Sensing
• Variations in time
indicate the presence
of certain features on
the ocean floor as well as
many ocean surface
features and currents.
The Global Positioning System
• The Global Positioning System, or GPS, is a
radio-navigation system of at least 24 satellites
that allows its users to determine their exact
position on Earth.
Remote Sensing
• Each satellite orbits Earth and transmits high-
frequency microwaves that contain information
about the satellite’s position and the time of
transmission.
• A GPS receiver calculates the user’s precise
latitude and longitude by processing the signals
emitted by multiple satellites.
Sea Beam
• Sea Beam technology is similar to the Topex/
Poseidon satellite in that it is used to map the
ocean floor.
Remote Sensing
• Sea Beam is located on a ship and relies on
sonar to map ocean-floor features.
• Sonar is the use of sound waves to detect and
measure objects underwater.
Sea Beam
• First, a sound wave is sent from a ship toward the
ocean floor.
Remote Sensing
• A receiving device then
picks up the returning
echo when it bounces
off the seafloor.
• Computers on the ship
can then calculate the
distance to the ocean
bottom based on the
time it takes the signal
to be reflected.

Unit 1 mapping

  • 1.
    Objectives • Compare andcontrast latitude and longitude. Latitude and Longitude • Describe how time zones vary. – cartography – equator – latitude – longitude – prime meridian – International Date Line Vocabulary
  • 2.
    • Cartographers usean imaginary grid of parallel lines and vertical lines to locate points on Earth. • The equator circles Earth halfway between the north and south poles separating Earth into two equal halves called the northern hemisphere and the southern hemisphere. • Cartography is the science of mapmaking. Latitude and Longitude • For thousands of years, people have used maps to define borders and to find places. Latitude and Longitude
  • 3.
    Latitude • Lines oflatitude are lines running parallel to the equator. Latitude and Longitude • Latitude is the distance in degrees north or south of the equator.
  • 4.
    Latitude • Latitude isthus measured from 0° at the equator to 90° at the poles. Latitude and Longitude • Locations north of the equator are referred to by degrees north latitude (N). • Locations south of the equator are referred to by degrees south latitude (S).
  • 5.
    Latitude Degrees of Latitude Latitudeand Longitude – Each degree of latitude is equivalent to about 111 km on Earth’s surface. – To locate positions on Earth more precisely, cartographers break down degrees of latitude into 60 smaller units, called minutes (´). – A minute of latitude can be further divided into seconds (´´). – Longitude is also divided into degrees, minutes, and seconds.
  • 6.
    Longitude • To locatepositions in east and west directions, cartographers use lines of longitude, also known as meridians. Latitude and Longitude • Longitude is the distance in degrees east or west of the prime meridian. • The prime meridian, representing 0° longitude, is the reference point for longitude.
  • 7.
    Longitude • Points westof the prime meridian are numbered from 0° to 180° west longitude (W). Latitude and Longitude • Points east of the prime meridian are numbered from 0° to 180° east longitude (E).
  • 8.
    Longitude Semicircles Latitude and Longitude –Lines of longitude are not parallel; they are large semicircles that extend vertically from pole to pole. – The distances covered by degrees of longitude vary with location. – One degree of longitude varies from about 111 km at the equator to essentially the distance covered by a point at the poles. Degrees of Longitude
  • 9.
    Longitude Locating Places withCoordinates Latitude and Longitude – Both latitude and longitude are needed to precisely locate positions on Earth. – For example, the location of New Orleans is 29°57´N, 90°04´W. – Note that latitude comes first in reference to the coordinates of a particular location.
  • 10.
    Time Zones • BecauseEarth takes about 24 hours to rotate once on its axis, it is divided into 24 times zones, each representing a different hour. Latitude and Longitude
  • 11.
    Time Zones • Eachtime zone is 15° wide, corresponding roughly to lines of longitude. Latitude and Longitude • Time zone boundaries have been adjusted in local areas for convenience.
  • 12.
    Time Zones • Thereare six different time zones in the United States. Latitude and Longitude
  • 13.
    Time Zones Calendar Dates Latitudeand Longitude – Every time zone experiences this transition from one day to the next, with the calendar advancing to the next day at midnight. – Each time you travel through a time zone, you gain or lose time, eventually gaining or losing an entire day. – The International Date Line, or 180° meridian, serves as the transition line for calendar days. – Traveling west across the International Date Line, you would advance your calendar one day. – Traveling east, you would move your calendar back one day.
  • 14.
    Objectives • Compare andcontrast different map projections. • Analyze topographic maps. • Describe map characteristics, such as map scales and map legends – Mercator projection – conic projection – gnomonic projection – topographic map – contour line – contour interval – map legend – map scale Vocabulary Types of Maps
  • 15.
    Types of Maps •Maps are flat models of a three-dimensional object, Earth. Types of Maps • All flat maps distort to some degree either the shapes or the areas of landmasses. • Cartographers use projections to make maps. • A map projection is made by transferring points and lines on a globe’s surface onto a sheet of paper.
  • 16.
    Mercator Projections • AMercator projection is a map that has parallel lines of latitude and longitude. Types of Maps • In a Mercator projection, the shapes of the landmasses are correct, but their areas are distorted.
  • 17.
    Conic Projections • Aconic projection is a map made by projecting points and lines from a globe onto a cone. Types of Maps • The cone touches the globe at a particular line of latitude along which there is very little distortion in the areas or shapes of landmasses. • Distortion is evident near the top and bottom of the projection.
  • 18.
    Gnomonic Projections • Agnomonic projection is a map made by projecting points and lines from a globe onto a piece of paper that touches the globe at a single point. Types of Maps • Gnomonic projections distort direction and distance between landmasses. • Gnomonic projections are useful in plotting long-distance trips by air or sea.
  • 19.
    Gnomonic Projections • Greatcircles are imaginary lines that divide Earth into two equal halves. Types of Maps • On a sphere such as Earth, the shortest distance between two points lies along a great circle. • Navigators connect points on gnomonic projections to plot great-circle routes.
  • 20.
    Topographic Maps • Topographicmaps are detailed maps showing the elevations of hills and valleys of an area. Types of Maps • Topographic maps use lines, symbols, and colors to represent changes in elevation and features on Earth’s surface.
  • 21.
    Topographic Maps Contour Lines Typesof Maps – Elevation on a topographic map is represented by a contour line. – A contour line connects points of equal elevation. – Elevation refers to the distance of a location above or below sea level.
  • 22.
    Topographic Maps Contour Intervals Typesof Maps – Topographic maps use contour lines to show changes in elevation. – The contour interval is the difference in elevation between two side-by-side contour lines. – The contour interval is dependent on the terrain.
  • 23.
    Topographic Maps Index Contours Typesof Maps – Index contours are contour lines that are marked by numbers representing their elevations. – If a contour interval on a map is 5 m, you can determine the elevations represented by other lines around the index contour by adding or subtracting 5 m from the elevation indicated on the index contour.
  • 24.
    Topographic Maps Depression ContourLines Types of Maps – Depression contour lines are used to represent features that are lower than the surrounding area. – On a map, depression contour lines have hachures, or short lines at right angles to the contour line that point toward the lower elevation, to indicate depressions.
  • 25.
    • These featuresare represented by different symbols. • A map legend explains what the symbols represent. Map Legends • Topographic maps and most other maps include both human- made and natural features that are located on Earth’s surface. Types of Maps
  • 26.
    • A mapscale is the ratio between distances on a map and actual distances on the surface of Earth. Map Scales • When using a map, you need to know how to measure distances. Types of Maps
  • 27.
    Map Scales • Thereare three types of map scales: verbal scales, graphic scales, and fractional scales. Types of Maps – A verbal scale expresses distance as a statement, such as “One centimeter is equal to one kilometer.” – A graphic scale consists of a line that represents a certain distance, such as 5 km or 5 miles. – A fractional scale expresses distance as a ratio, such as 1:63 500.
  • 28.
    • remote sensing •electromagnetic spectrum • frequency • Landsat satellite Objectives • Compare and contrast the different forms of radiation in the electromagnetic spectrum. • Discuss how satellites and sonar are used to map Earth’s surface and its oceans. • Describe the Global Positioning System. Vocabulary Remote Sensing • Topex/Poseidon satellite • Global Positioning System • sonar
  • 29.
    Remote Sensing • Untilrecently, mapmakers had to go on-site to collect the data needed to make maps. Remote Sensing • Today, advanced technology has changed the way maps are made. • Remote sensing is the process of collecting data about Earth from far above Earth’s surface.
  • 30.
    The Electromagnetic Spectrum •Satellites detect different wavelengths of energy reflected or emitted from Earth’s surface. Remote Sensing • This energy has both electric and magnetic properties and is referred to as electromagnetic radiation. • Electromagnetic radiation includes visible light, gamma rays, X rays, ultraviolet waves, infrared waves, radio waves, and microwaves.
  • 31.
    The Electromagnetic Spectrum WaveCharacteristics Remote Sensing – All electromagnetic waves travel at the speed of 300 000 km/s in a vacuum, a value commonly referred to as the speed of light. – Electromagnetic waves have distinct wavelengths and frequencies. – The electromagnetic spectrum is the arrangement of electromagnetic radiation according to wavelengths. – Frequency is the number of waves that pass a particular point each second. – These unique characteristics help determine how the energy is used by different satellites to map Earth.
  • 32.
    The Electromagnetic Spectrum WaveCharacteristics Remote Sensing
  • 33.
    Landsat Satellites • ALandsat satellite receives reflected wavelengths of energy emitted by Earth’s surface, including some wavelengths of visible light and infrared radiation. Remote Sensing • Since the features on Earth’s surface radiate warmth at slightly different frequencies, they show up as different colors in images
  • 34.
    Topex/Poseidon Satellite • TheTopex/Poseidon satellite uses radar to accurately map the ocean surface. Remote Sensing • Radar uses high-frequency signals that are transmitted from the satellite to the surface of the ocean. • A receiving device then picks up the returning echo as it is reflected off the water.
  • 35.
    Topex/Poseidon Satellite • Thedistance to the water’s surface is calculated using the known speed of light and the time it takes for the signal to be reflected. Remote Sensing • Variations in time indicate the presence of certain features on the ocean floor as well as many ocean surface features and currents.
  • 36.
    The Global PositioningSystem • The Global Positioning System, or GPS, is a radio-navigation system of at least 24 satellites that allows its users to determine their exact position on Earth. Remote Sensing • Each satellite orbits Earth and transmits high- frequency microwaves that contain information about the satellite’s position and the time of transmission. • A GPS receiver calculates the user’s precise latitude and longitude by processing the signals emitted by multiple satellites.
  • 37.
    Sea Beam • SeaBeam technology is similar to the Topex/ Poseidon satellite in that it is used to map the ocean floor. Remote Sensing • Sea Beam is located on a ship and relies on sonar to map ocean-floor features. • Sonar is the use of sound waves to detect and measure objects underwater.
  • 38.
    Sea Beam • First,a sound wave is sent from a ship toward the ocean floor. Remote Sensing • A receiving device then picks up the returning echo when it bounces off the seafloor. • Computers on the ship can then calculate the distance to the ocean bottom based on the time it takes the signal to be reflected.