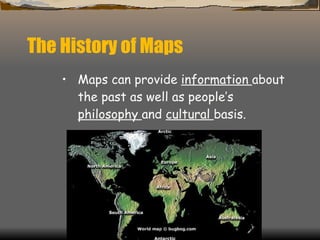
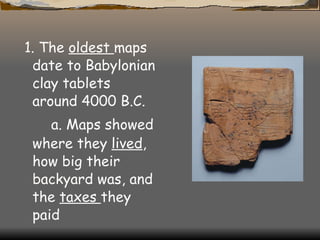
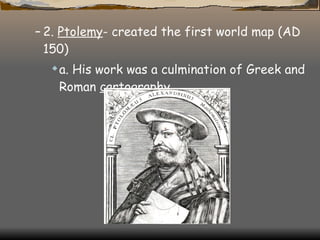
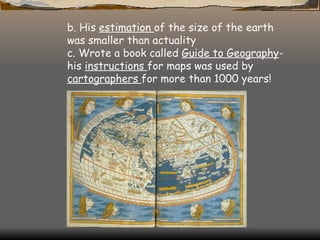
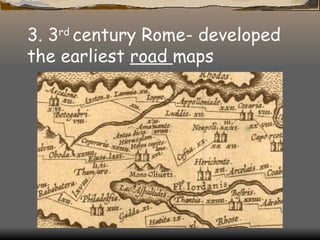
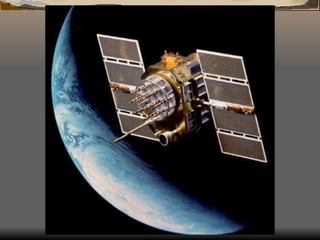
Maps Chapter 6
The History of Maps Maps can provide  information  about the past as well as people’s  philosophy  and  cultural  basis.
B. Maps are a universal medium for  communication , easily understood and appreciated by most people, regardless of language or culture. Incorporated in a map is   the   understanding   that it is a "snapshot" of an idea, a single  picture , a selection of  concepts  from a constantly changing database of geographic information.
1. The  oldest  maps date to Babylonian clay tablets around 4000 B.C. a. Maps showed where they  lived , how big their backyard was, and the  taxes  they paid
2.  Ptolemy - created the first world map (AD 150)  a. His work was a culmination of Greek and Roman  cartography
b. His  estimation  of the size of the earth was smaller than actuality c. Wrote a book called  Guide to Geography - his  instructions  for maps was used by  cartographers  for more than 1000 years!
3. 3 rd  century Rome- developed the earliest  road  maps
4. Middle Ages- maps reflect  life philosophy  a.  Jerusalem  was often depicted at the center of the world with East oriented at the top of the map  b. maps were often guidebooks to direct pilgrims to  sacred  places
5. 15 th  Century-  printing  made maps more readily available
6. 16 th  Century- whole  world maps  a.  Columbus  used Ptolemy’s map on his voyage to the new world  b. 1541 Geradus  Mercator  was a lead cartographer that created a whole world map (Mercator projections still exist today)
Mercator
7. 17 th  Century- cartographers measured land by means of  triangulation  to make maps more  accurate  8. 18 th  and 19 th  Century- the application of the scientific method helped improve the  accuracy  of maps  a. United States Geological survey began creating maps of the US in 1879  b.  Public Land Survey  created to systematically subdivide land areas (original thirteen colonies existed before the use this system)
Modern Mercator Projection Map
9. Post World War II-  Aerial  photographs were used to increase the accuracy of maps
10. 1970’s and 1980’s- major  shifts  in  cartography  a.  GPS  (Global Positioning System)- consists of 24 satellites taking  images  to help cartographers map with great accuracy  b. GIS (Geographic Information Systems)- uses  computer  software, hardware, digital  data,  people, organizations, institutions for collecting, storing and  analyzing  georeferenced materials to create maps
 
 
Review Questions 1. What has improved the accuracy of maps over time?  Aerial Photography GPS GIS
2. What do maps of the Middle Ages suggest about people’s life philosophy?   Jerusalem was the center of the world. Guidebooks to sacred places.
3. What other events did Ptolemy’s cartography influence?   His instructions for maps lasted for 1000 years.
Essential Components of Maps   A. Title- like a book, tells the  subject  to be addressed. B.  Date - when data for compilation were collected. C. Legend- (also called  key)  explains  symbols  the map may contain.
 
D.  Location  Reference- where on Earth are the map data applicable 1. Latitude and longitude
 
a.  Meridians - (lines of longitude) vertical lines running  North  and  South  ,  measure  of distance east and west of the Prime Meridian i. Prime Meridian- runs through  Greenwich  England, labeled 0 degrees longitude  ii. International Date Line- located along the  180  degree meridian
 
b.  Parallels - (lines of latitude) horizontal lines running  east  and  west , measure of distance north and south of the  equator ( 0 degrees latitude)  2. Public Land Survey System- uses a  grid system  of square miles to subdivide land
 
E. Scale- provides information on the  ratio  between map distance and earth surface distance  1.  Fractional  Scale- Ex. 1:800 – means one  unit  on the map represents 800 units on land (one inch on the map equals 800 inches on land)  2.  Graphic  or Bar scale- “map ruler” for measuring distance, commonly seen on  road  maps  F. Source- establishes a measure of map  reliability  (Where did you get your information?)
 
Review Questions 1. What are the six essential components of a map?  Title Scale Date Source Legend Location
 
2. What would a fractional scale of 1:24,000 suggest about the size of the area being mapped?  That it is very large.
III. Map Distortions- Unrealistic representations  A. Field measurements are subject to  errors  of accuracy and precision  B. All maps are  estimations , generalizations, and interpretations of true geographic conditions  C. All maps are a product of the  human  endeavor and can be  biased   D. No map can depict all physical, biological and cultural features
IV. Map Projections-  representations  of a three-dimensional object on a flat surface  A. Mercator projections- shows accurate  shapes  of continents but distorts  area
 
 
B. Equal Area Projection- shows  accurate  area but distorted shapes  C. Robinson Projection- has accurate continent shapes and land areas with some  distortion  at the  poles
 
Review Questions 1. If all maps are distorted to some extent, how are cartographers using technology to increase their accuracy?  Computer Models in 3D
2. What are possible sources of error in data that would cause a map to be inaccurate?  Accuracy, precision, bias, estimations
Types of Maps A. Political Maps- outline the borders of  countries  and  states
 
B. Physical  Relief  Map- similar to a topographic map but in  3-D
 
C. Road Map- a map that would have all the states and major  roads
 
D. Navigation Map- a map of the  oceans  usually gives miles in  nautical  miles, especially used by shipping and Navy
 
E. Topographic Map- accurately represents the earth’s  natural  and  manmade  features. Used as tools for  planning  (i.e. dams, highways, urban development).
Topographic Map
1. Shows relief (variations in  elevation ) by using  contour  lines (a line that passes through all points on a map with the same elevation)  2. Use  symbols  to represent  features
 
3. General rules to follow when reading a topographic map  a. A contour line of one elevation never  crosses , or  intersects  another elevation  b. Each contour line represents only  one elevation   c.  Closely  spaced contour lines represent a  steep slope , those placed far apart represent a gentle slope  d. Contour lines that cross a valley are  V shaped , the V points upstream
 
F. Geological Maps-shows  distribution , relationship, and composition of earth materials, different colors usually tell you the different types of  rocks  and  faults   1. Used by land-use planners to identify and determine which areas are suitable for  agriculture  and  urban  development
Geographic Map
2. Used to  locate  and  protect  sources of groundwater, mineral deposits and energy sources  a. Geologic maps help protect  groundwater  supplies from further pollution by allowing environmentalists knowledge of  permeable  rock types in areas where water supplies are recharged.  b. Scientists can  predict  possible mineral and  energy  sources based on rock types within regions.
3. Used to identify potential  geologic hazards  (earthquakes, landslides etc.) by identifying rock types, and fault lines allowing scientists to  predict  future events and threats.   4. Fundamental resource for  environmental  and engineering applications
 
G. Soil Maps- show broad areas that have  distinctive   patterns  of soil, relief ( topography), and drainage  1. Used by land, and  city planners   2. Practical uses- buying a home, building a home, decisions about  flood insurance , where to build roads
Soil Maps
 
H.  Atlas - a book of all kinds of maps
Review Questions 1. What types of maps might a contractor building a home use when considering properties to develop homes upon?  Topographic maps Geological maps Soil maps
2. How can geological maps be important economically for our society?   They show where oil and natural gas could be along with certain types of rocks that hold certain types of minerals. Ex. Gold, Diamonds
3. What professionals might find topographic maps useful to work with?  Construction companies, road builders, city planners

Chapter 6 maps

  • 1.
  • 2.
    The History ofMaps Maps can provide information about the past as well as people’s philosophy and cultural basis.
  • 3.
    B. Maps area universal medium for communication , easily understood and appreciated by most people, regardless of language or culture. Incorporated in a map is the understanding that it is a "snapshot" of an idea, a single picture , a selection of concepts from a constantly changing database of geographic information.
  • 4.
    1. The oldest maps date to Babylonian clay tablets around 4000 B.C. a. Maps showed where they lived , how big their backyard was, and the taxes they paid
  • 5.
    2. Ptolemy- created the first world map (AD 150) a. His work was a culmination of Greek and Roman cartography
  • 6.
    b. His estimation of the size of the earth was smaller than actuality c. Wrote a book called Guide to Geography - his instructions for maps was used by cartographers for more than 1000 years!
  • 7.
    3. 3 rd century Rome- developed the earliest road maps
  • 8.
    4. Middle Ages-maps reflect life philosophy a. Jerusalem was often depicted at the center of the world with East oriented at the top of the map b. maps were often guidebooks to direct pilgrims to sacred places
  • 9.
    5. 15 th Century- printing made maps more readily available
  • 10.
    6. 16 th Century- whole world maps a. Columbus used Ptolemy’s map on his voyage to the new world b. 1541 Geradus Mercator was a lead cartographer that created a whole world map (Mercator projections still exist today)
  • 11.
  • 12.
    7. 17 th Century- cartographers measured land by means of triangulation to make maps more accurate 8. 18 th and 19 th Century- the application of the scientific method helped improve the accuracy of maps a. United States Geological survey began creating maps of the US in 1879 b. Public Land Survey created to systematically subdivide land areas (original thirteen colonies existed before the use this system)
  • 13.
  • 14.
    9. Post WorldWar II- Aerial photographs were used to increase the accuracy of maps
  • 15.
    10. 1970’s and1980’s- major shifts in cartography a. GPS (Global Positioning System)- consists of 24 satellites taking images to help cartographers map with great accuracy b. GIS (Geographic Information Systems)- uses computer software, hardware, digital data, people, organizations, institutions for collecting, storing and analyzing georeferenced materials to create maps
  • 16.
  • 17.
  • 18.
    Review Questions 1.What has improved the accuracy of maps over time? Aerial Photography GPS GIS
  • 19.
    2. What domaps of the Middle Ages suggest about people’s life philosophy? Jerusalem was the center of the world. Guidebooks to sacred places.
  • 20.
    3. What otherevents did Ptolemy’s cartography influence? His instructions for maps lasted for 1000 years.
  • 21.
    Essential Components ofMaps A. Title- like a book, tells the subject to be addressed. B. Date - when data for compilation were collected. C. Legend- (also called key) explains symbols the map may contain.
  • 22.
  • 23.
    D. Location Reference- where on Earth are the map data applicable 1. Latitude and longitude
  • 24.
  • 25.
    a. Meridians- (lines of longitude) vertical lines running North and South , measure of distance east and west of the Prime Meridian i. Prime Meridian- runs through Greenwich England, labeled 0 degrees longitude ii. International Date Line- located along the 180 degree meridian
  • 26.
  • 27.
    b. Parallels- (lines of latitude) horizontal lines running east and west , measure of distance north and south of the equator ( 0 degrees latitude) 2. Public Land Survey System- uses a grid system of square miles to subdivide land
  • 28.
  • 29.
    E. Scale- providesinformation on the ratio between map distance and earth surface distance 1. Fractional Scale- Ex. 1:800 – means one unit on the map represents 800 units on land (one inch on the map equals 800 inches on land) 2. Graphic or Bar scale- “map ruler” for measuring distance, commonly seen on road maps F. Source- establishes a measure of map reliability (Where did you get your information?)
  • 30.
  • 31.
    Review Questions 1.What are the six essential components of a map? Title Scale Date Source Legend Location
  • 32.
  • 33.
    2. What woulda fractional scale of 1:24,000 suggest about the size of the area being mapped? That it is very large.
  • 34.
    III. Map Distortions-Unrealistic representations A. Field measurements are subject to errors of accuracy and precision B. All maps are estimations , generalizations, and interpretations of true geographic conditions C. All maps are a product of the human endeavor and can be biased D. No map can depict all physical, biological and cultural features
  • 35.
    IV. Map Projections- representations of a three-dimensional object on a flat surface A. Mercator projections- shows accurate shapes of continents but distorts area
  • 36.
  • 37.
  • 38.
    B. Equal AreaProjection- shows accurate area but distorted shapes C. Robinson Projection- has accurate continent shapes and land areas with some distortion at the poles
  • 39.
  • 40.
    Review Questions 1.If all maps are distorted to some extent, how are cartographers using technology to increase their accuracy? Computer Models in 3D
  • 41.
    2. What arepossible sources of error in data that would cause a map to be inaccurate? Accuracy, precision, bias, estimations
  • 42.
    Types of MapsA. Political Maps- outline the borders of countries and states
  • 43.
  • 44.
    B. Physical Relief Map- similar to a topographic map but in 3-D
  • 45.
  • 46.
    C. Road Map-a map that would have all the states and major roads
  • 47.
  • 48.
    D. Navigation Map-a map of the oceans usually gives miles in nautical miles, especially used by shipping and Navy
  • 49.
  • 50.
    E. Topographic Map-accurately represents the earth’s natural and manmade features. Used as tools for planning (i.e. dams, highways, urban development).
  • 51.
  • 52.
    1. Shows relief(variations in elevation ) by using contour lines (a line that passes through all points on a map with the same elevation) 2. Use symbols to represent features
  • 53.
  • 54.
    3. General rulesto follow when reading a topographic map a. A contour line of one elevation never crosses , or intersects another elevation b. Each contour line represents only one elevation c. Closely spaced contour lines represent a steep slope , those placed far apart represent a gentle slope d. Contour lines that cross a valley are V shaped , the V points upstream
  • 55.
  • 56.
    F. Geological Maps-shows distribution , relationship, and composition of earth materials, different colors usually tell you the different types of rocks and faults 1. Used by land-use planners to identify and determine which areas are suitable for agriculture and urban development
  • 57.
  • 58.
    2. Used to locate and protect sources of groundwater, mineral deposits and energy sources a. Geologic maps help protect groundwater supplies from further pollution by allowing environmentalists knowledge of permeable rock types in areas where water supplies are recharged. b. Scientists can predict possible mineral and energy sources based on rock types within regions.
  • 59.
    3. Used toidentify potential geologic hazards (earthquakes, landslides etc.) by identifying rock types, and fault lines allowing scientists to predict future events and threats. 4. Fundamental resource for environmental and engineering applications
  • 60.
  • 61.
    G. Soil Maps-show broad areas that have distinctive patterns of soil, relief ( topography), and drainage 1. Used by land, and city planners 2. Practical uses- buying a home, building a home, decisions about flood insurance , where to build roads
  • 62.
  • 63.
  • 64.
    H. Atlas- a book of all kinds of maps
  • 65.
    Review Questions 1.What types of maps might a contractor building a home use when considering properties to develop homes upon? Topographic maps Geological maps Soil maps
  • 66.
    2. How cangeological maps be important economically for our society? They show where oil and natural gas could be along with certain types of rocks that hold certain types of minerals. Ex. Gold, Diamonds
  • 67.
    3. What professionalsmight find topographic maps useful to work with? Construction companies, road builders, city planners