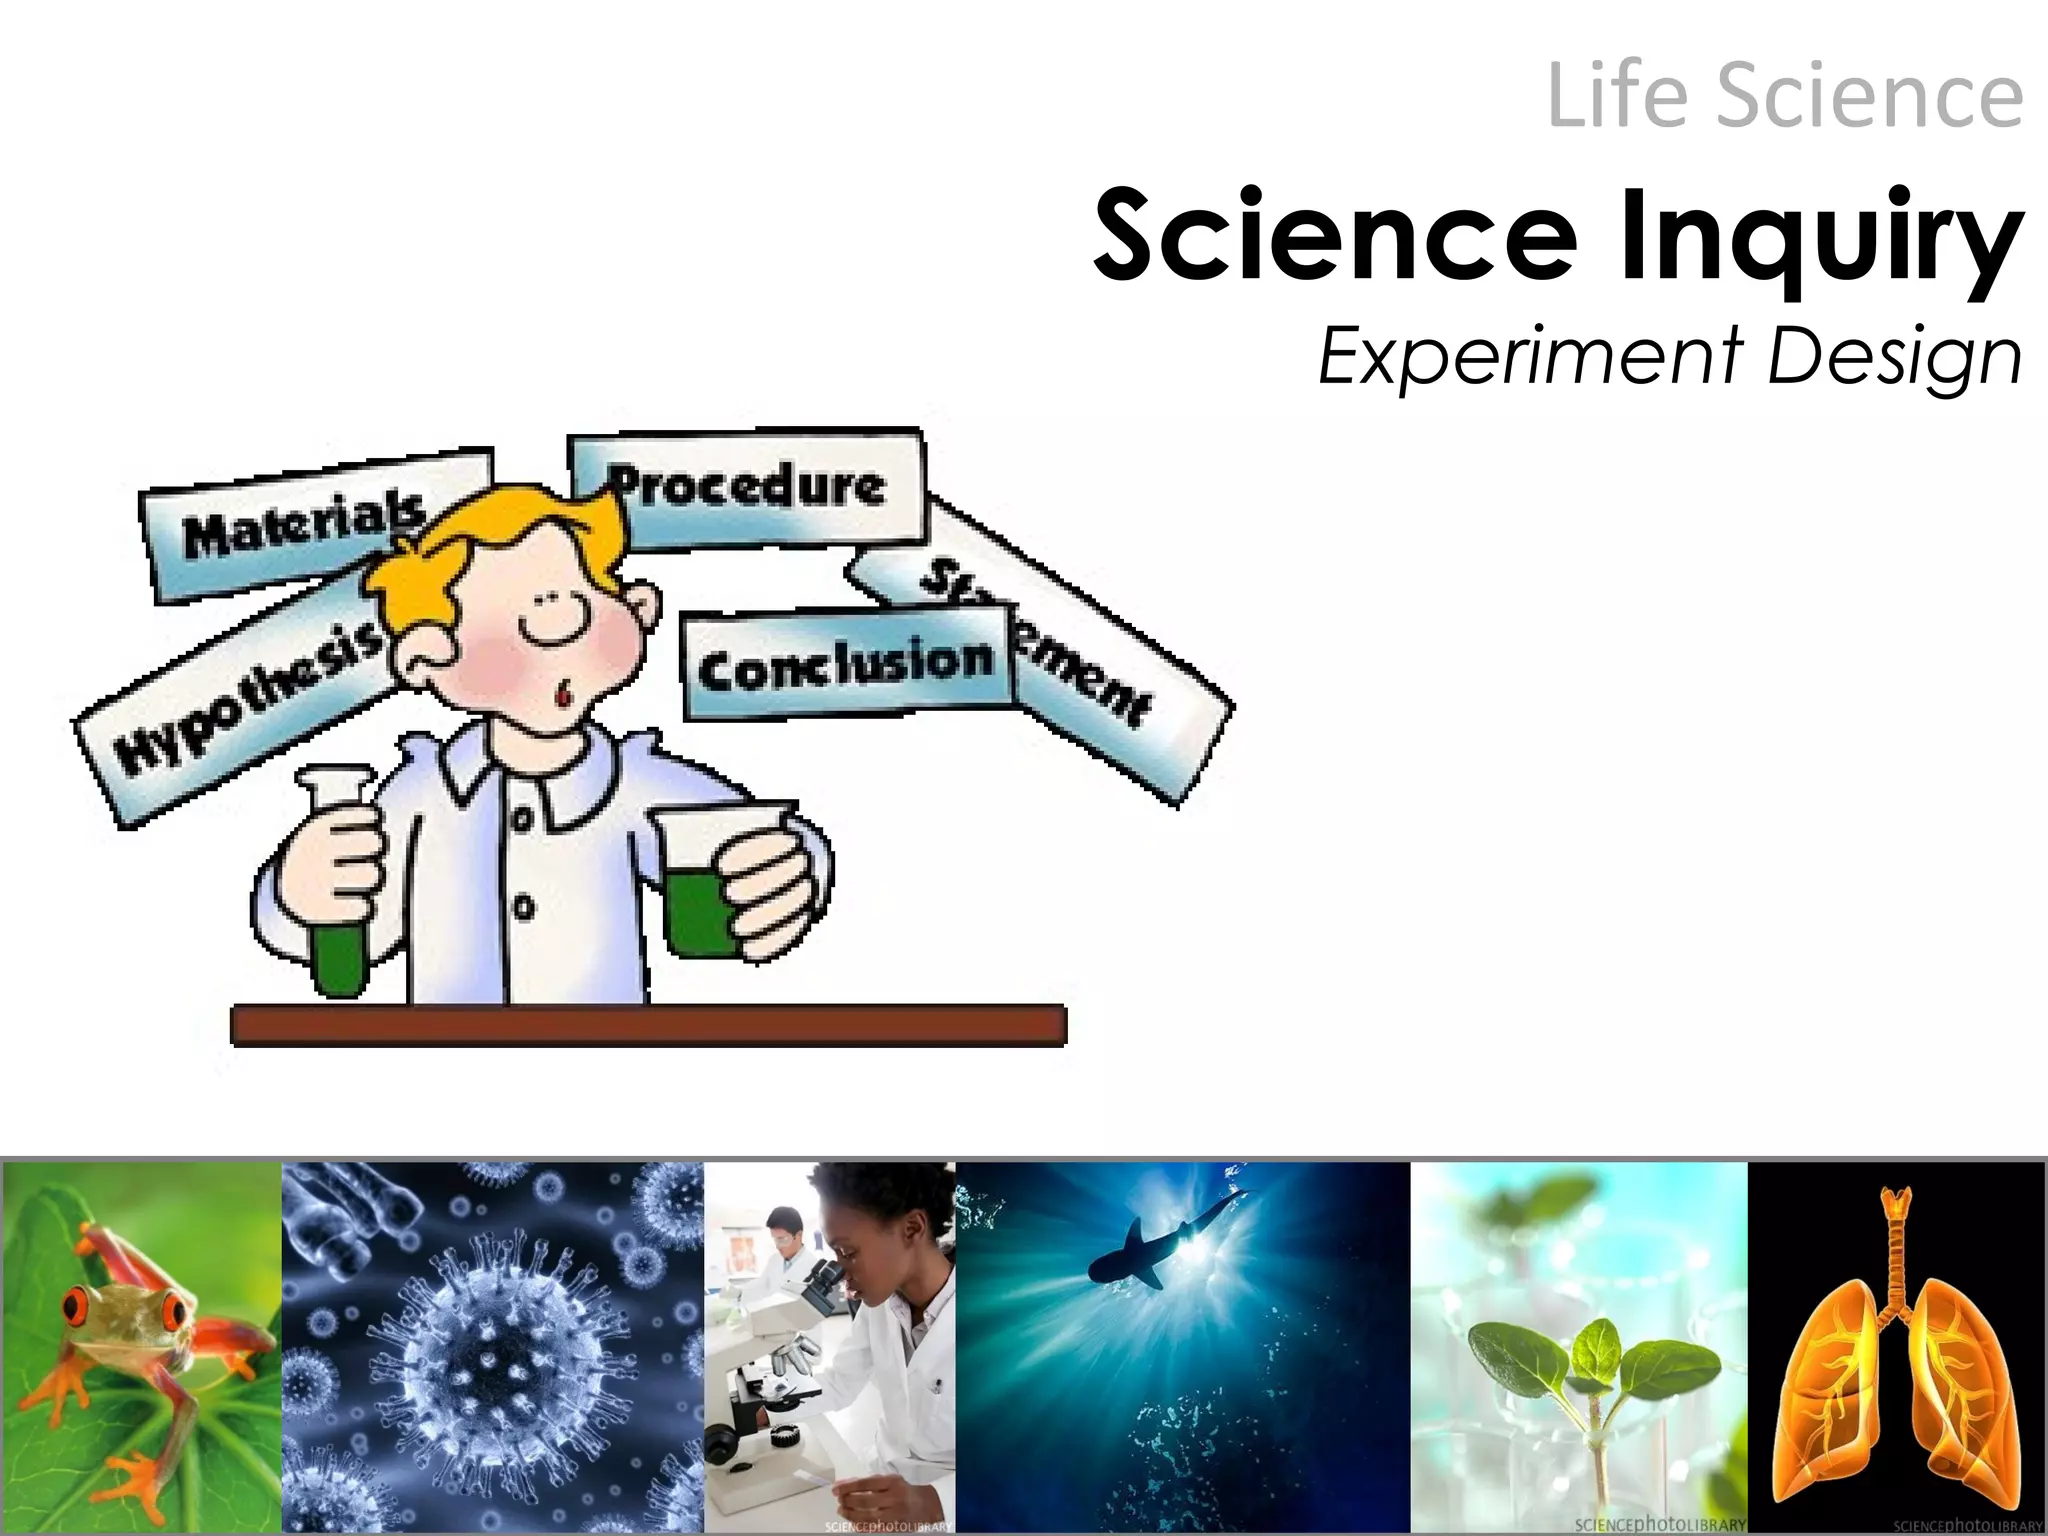
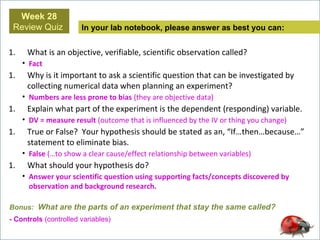
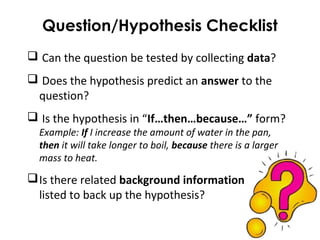
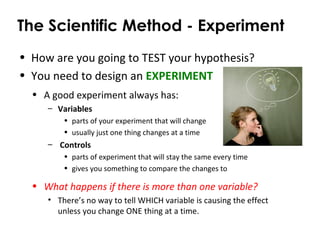
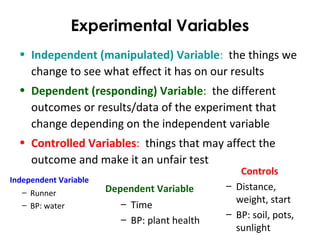
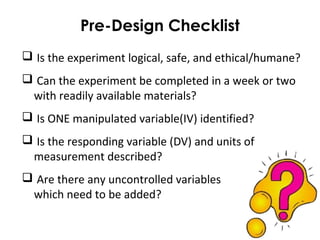
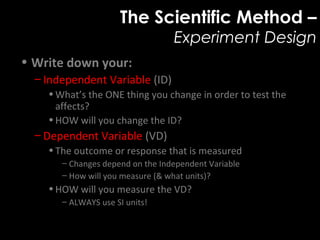
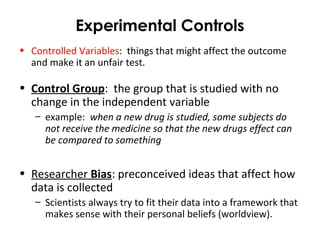
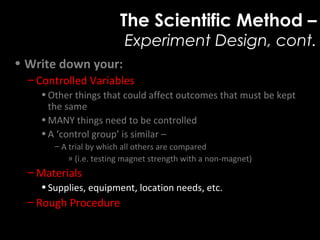
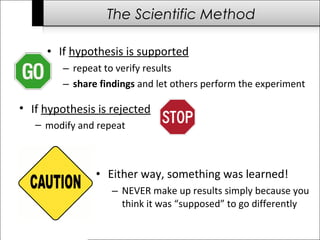
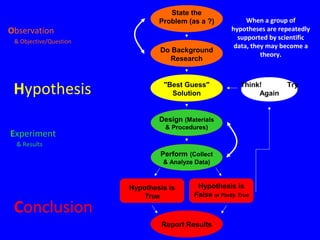
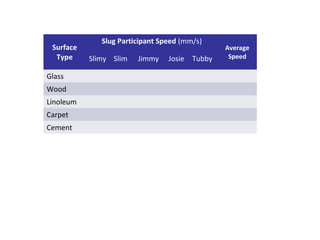
Life Science
Science Inquiry
Experiment Design
Bonus: What are the parts of an experiment that stay the same called?
- Controls (controlled variables)
1. What is an objective, verifiable, scientific observation called?
• Fact
1. Why is it important to ask a scientific question that can be investigated by
collecting numerical data when planning an experiment?
• Numbers are less prone to bias (they are objective data)
1. Explain what part of the experiment is the dependent (responding) variable.
• DV = measure result (outcome that is influenced by the IV or thing you change)
1. True or False? Your hypothesis should be stated as an, “If…then…because…”
statement to eliminate bias.
• False (…to show a clear cause/effect relationship between variables)
1. What should your hypothesis do?
• Answer your scientific question using supporting facts/concepts discovered by
observation and background research.
In your lab notebook, please answer as best you can:
Week 28
Review Quiz
Question/Hypothesis Checklist
 Can the question be tested by collecting data?
 Does the hypothesis predict an answer to the
question?
 Is the hypothesis in “If…then…because…” form?
Example: If I increase the amount of water in the pan,
then it will take longer to boil, because there is a larger
mass to heat.
Is there related background information
listed to back up the hypothesis?
"A Fair Test" Experiment
Identifying Variables
Who is the
Fastest?
Any volunteers?
The Scientific Method - Experiment
• How are you going to TEST your hypothesis?
• You need to design an EXPERIMENT
• A good experiment always has:
– Variables
• parts of your experiment that will change
• usually just one thing changes at a time
– Controls
• parts of experiment that will stay the same every time
• gives you something to compare the changes to
• What happens if there is more than one variable?
• There’s no way to tell WHICH variable is causing the effect
unless you change ONE thing at a time.
Experimental Variables
• Independent (manipulated) Variable: the things we
change to see what effect it has on our results
• Dependent (responding) Variable: the different
outcomes or results/data of the experiment that
change depending on the independent variable
• Controlled Variables: things that may affect the
outcome and make it an unfair test
Independent Variable
– Runner
– BP: water
Dependent Variable
– Time
– BP: plant health
Controls
– Distance,
weight, start
– BP: soil, pots,
sunlight
Data Collection
• Subjective data
– Results that involve an opinion or individual judgment to
record data
• examples:
– which flower is the prettiest
– which plant looks the healthiest
– how good does the food taste
• Objective data
– Results that require measurement to record data
• harder for researcher bias to affect
• examples:
– which flower has the largest petals
– which plant has the tallest stem (or greatest number of leaves)
– how much of the food was eaten
"I have known for years that the problem with microwaved anything is not the
radiation people used to worry about, it's how it corrupts the DNA in the food so the
body cannot recognize it.“ Quote from experiment designer.
What May Have Caused These Results?
• Microwaved water really is toxic
• Uncontrolled variables
– Disease/pests (before or during experiment)
– Contamination of containers, temp. of water
– Environmental factors (heat, light, soil)
• Other factors
– Age or type of plant is more/less susseptible
• Experimenter bias
– Faked photos (intentional)
– Unequal treatment of samples/trials (snipped stems?)
• Double-blind experiment
– Researcher doesn’t know what X, Y & Z represent
until end of the experiment to prevent bias in data
• Myth-busters tested
– Multiple samples, very controlled environment
– Plants with micro-heated water grew the largest!
Pre-Design Checklist
 Is the experiment logical, safe, and ethical/humane?
 Can the experiment be completed in a week or two
with readily available materials?
 Is ONE manipulated variable(IV) identified?
 Is the responding variable (DV) and units of
measurement described?
 Are there any uncontrolled variables
which need to be added?
The Scientific Method –
Experiment Design
• Write down your:
– Independent Variable (ID)
•What’s the ONE thing you change in order to test the
affects?
•HOW will you change the ID?
– Dependent Variable (VD)
•The outcome or response that is measured
– Changes depend on the Independent Variable
– How will you measure (& what units)?
•HOW will you measure the VD?
– ALWAYS use SI units!
Experimental Controls
• Controlled Variables: things that might affect the outcome
and make it an unfair test.
• Control Group: the group that is studied with no
change in the independent variable
– example: when a new drug is studied, some subjects do
not receive the medicine so that the new drugs effect can
be compared to something
• Researcher Bias: preconceived ideas that affect how
data is collected
– Scientists always try to fit their data into a framework that
makes sense with their personal beliefs (worldview).
The Scientific Method –
Experiment Design, cont.
• Write down your:
– Controlled Variables
•Other things that could affect outcomes that must be kept
the same
•MANY things need to be controlled
•A ‘control group’ is similar –
– A trial by which all others are compared
» (i.e. testing magnet strength with a non-magnet)
– Materials
•Supplies, equipment, location needs, etc.
– Rough Procedure
Controlling Bias
• Blind Studies: research subjects don’t know if
they are in the control group or the test group;
only researchers know who is in which group.
• Double Blind Studies: neither subjects
nor scientists know who is in which until
all data has been collected.
• Multiple Trials: more subjects and/or
trials = less prone to bias and error the
experiment.
Writing Detailed Procedures
• Step-by-step instructions:
– Number the steps (1, 2, 3…).
– Chunk instructions into one action per step.
– Use specific, descriptive commands.
– Include pictures/diagrams to clarify (identify
parts, materials, configuration/setup, etc.).
• Specific explanations:
– Logical order (makes sense)
– Easily followed (no experience needed).
– Include instructions for data collection.
The Scientific Method –
Experiment Procedure
• Draw a recognizable object with a fair
amount of detail
• Write down INSTRUCTIONS for drawing
that object using ONLY SHAPES (no saying
what the thing is, like, “draw a nose”)
– See if you can get me to copy your drawing
PERFECTLY using only your directions.
– Now try it with a neighbor.
Video Intro
The Scientific Method - Observation
• It starts with an OBSERVATION:
– you're on a hike with your classmates and you notice a
footprint
– you wonder, "What type
of creature made this track?"
– you're hiking near a stream,
so it's likely some sort of
aquatic bird or mammal
– looking closely at the track, you see there are
5 digits (toes or claws) which rules out birds,
and the left and right limbs seem to be
roughly 15 cm apart.
background research
• You snap a picture of the tracks (with your
foot in the shot for size reference) and head
home
• After a quick internet search for "aquatic
mammal tracks," you find the pictures
below:
Turtle
Otter Lizard
Alligator
Bullfrog
The Scientific Method - Hypothesis
• Based on the information you've gathered,
what HYPOTHESIS would you make?
– The tracks found near the stream on our hike
were made by...
» An Otter
» A Lizard
» A Turtle
» A Bullfrog
» An Alligator
The Scientific Method - Experiment
• How are you going to TEST your hypothesis?
• You need to design an EXPERIMENT
• A good experiment always has:
– Variables
• parts of your experiment that will change
• usually just one thing changes at a time
– Controls
• parts of experiment that will stay the same every time
• gives you something to compare the changes to
• What happens if there is more than one variable?
• Three aspects of an experiment:
• Materials, Procedures, and Data Collection
Experiment Procedures
• To perform an experiment, you need written
procedures. Why?
– to record EXACTLY what you did
• detailed, step-by-step instructions
– so it can be repeated (by you or others)
1. Measure imprints to nearest millimeter
• size of digits, length & width
• entire foot, length & width
• distance between prints, length & width
2. Measure actual prints of hypothesized animal
• compare measurements and record differences
3. Obtain cast of viewed prints
• follow procedures at http://www.bear-tracker.com/plastertracks.html
4. Obtain mold of hypothesized animal's foot
• follow 3D casting kit procedures
• See if cast fits into mold and note any differences.
Mold
Cast
Experiment Data Collection
• There are usually supplies needed, listed in the
materials section of the experiment.
1. Lab notebook and writing instrument
2. Metric ruler
3. Gypsum plaster and water
4. Cardboard strip and paper clip
5. Containers for mixing (margarine tubs or food cartons)
6. Wooden popsicle stick
7. Alginate molding powder
Experiment Data Collection
• As you perform the experiment, observations and
data will be recorded.
– measurements listed in a chart (OBJECTIVE data)
– written observations
– drawings
– photos
Hypothesized Animal Measurements (in mm)
#1 (L)
toe length
#1 (L)
toe width
#2 toe
length
#2 toe
width
#3 toe
length
#3 toe
width
#4 toe
length
#4 toe
width
#5 toe
length
#5 toe
width
8 mm 4 mm 9 mm 4 mm 11 mm 5 mm 11 mm 4 mm 10 mm 4 mm
Entire print length: 35 mm Entire print width: 30 mm
Length between prints: 97 mm Width between prints: 132 mm
Imprint Measurements
#1 (L)
toe length
#1 (L)
toe width
#2 toe
length
#2 toe
width
#3 toe
length
#3 toe
width
#4 toe
length
#4 toe
width
#5 toe
length
#5 toe
width
6 mm 3 mm 8 mm 3 mm 9 mm 4 mm 10 mm 4 mm 8 mm 3 mm
Entire print length: 28 mm Entire print width: 25 mm
Length between prints: 88 mm Width between prints: 127 mm
The Scientific Method - Conclusion
• Next, an analysis of the data is required:
– numbers, observations, and measurements are broken
down, organized, and studied to gain better understanding
– patterns often emerge, showing cause-and-effect
relationships
• After analyzing your data, you form a CONCLUSION
– The measurements, when compared, showed an average 1.6 mm
difference in length and .8 mm difference in width.
– The cast was almost identical in shape, but did not fit into the mold of
the hypothesized animal because it was 7 mm smaller in width and 4
mm shorter length-wise.
– This supports the hypothesis that the animal tracks were made by...
• A baby pond turtle!
The Scientific Method
• If hypothesis is rejected
– modify and repeat
• If hypothesis is supported
– repeat to verify results
– share findings and let others perform the experiment
• Either way, something was learned!
– NEVER make up results simply because you
think it was “supposed” to go differently
When a group of
hypotheses are repeatedly
supported by scientific
data, they may become a
theory.
State the
Problem (as a ?)
Do Background
Research
"Best Guess"
Solution
Design (Materials
& Procedures)
Perform (Collect
& Analyze Data)
Report Results
Hypothesis is
False or Partly True
Hypothesis is
True
Think! Try
Again
Conclusion
Experiment
& Results
Hypothesis
Observation
& Objective/Question
• “Only those who dare to fail greatly can
ever achieve greatly.” - Robert F. Kennedy
• “I have not failed. I've just found 10,000
ways that won't work.” - Thomas A. Edison
• “The only real mistake is the one from
which we learn nothing.” - Henry Ford
• “Failures are finger posts on the road to
achievement.” - C.S. Lewis
Surface
Type
Slug Participant Speed (mm/s)
Average
SpeedSlimy Slim Jimmy Josie Tubby
Glass
Wood
Linoleum
Carpet
Cement
O2 In Different
Stream Locations
(mg/l)
Rainbow Trout Gill Lice
Average # of fish
with lice# of fish
with
NO lice
# of fish
with
5-10 lice
# of fish
with
> 10 lice
NO
Lice
5-10
Lice
>10
Lice
Day
1
Day
2
Day
3
Day
1
Day
2
Day
3
Day
1
Day
2
Day
3
< 4 mg/l
4-5.9 mg/l
6-7.9 mg/l
8-10 mg/l
> 10 mg/l

Science Inquiry: Experiment Design

  • 1.
  • 2.
    Bonus: What arethe parts of an experiment that stay the same called? - Controls (controlled variables) 1. What is an objective, verifiable, scientific observation called? • Fact 1. Why is it important to ask a scientific question that can be investigated by collecting numerical data when planning an experiment? • Numbers are less prone to bias (they are objective data) 1. Explain what part of the experiment is the dependent (responding) variable. • DV = measure result (outcome that is influenced by the IV or thing you change) 1. True or False? Your hypothesis should be stated as an, “If…then…because…” statement to eliminate bias. • False (…to show a clear cause/effect relationship between variables) 1. What should your hypothesis do? • Answer your scientific question using supporting facts/concepts discovered by observation and background research. In your lab notebook, please answer as best you can: Week 28 Review Quiz
  • 3.
    Question/Hypothesis Checklist  Canthe question be tested by collecting data?  Does the hypothesis predict an answer to the question?  Is the hypothesis in “If…then…because…” form? Example: If I increase the amount of water in the pan, then it will take longer to boil, because there is a larger mass to heat. Is there related background information listed to back up the hypothesis?
  • 4.
    "A Fair Test"Experiment Identifying Variables Who is the Fastest? Any volunteers?
  • 5.
    The Scientific Method- Experiment • How are you going to TEST your hypothesis? • You need to design an EXPERIMENT • A good experiment always has: – Variables • parts of your experiment that will change • usually just one thing changes at a time – Controls • parts of experiment that will stay the same every time • gives you something to compare the changes to • What happens if there is more than one variable? • There’s no way to tell WHICH variable is causing the effect unless you change ONE thing at a time.
  • 6.
    Experimental Variables • Independent(manipulated) Variable: the things we change to see what effect it has on our results • Dependent (responding) Variable: the different outcomes or results/data of the experiment that change depending on the independent variable • Controlled Variables: things that may affect the outcome and make it an unfair test Independent Variable – Runner – BP: water Dependent Variable – Time – BP: plant health Controls – Distance, weight, start – BP: soil, pots, sunlight
  • 7.
    Data Collection • Subjectivedata – Results that involve an opinion or individual judgment to record data • examples: – which flower is the prettiest – which plant looks the healthiest – how good does the food taste • Objective data – Results that require measurement to record data • harder for researcher bias to affect • examples: – which flower has the largest petals – which plant has the tallest stem (or greatest number of leaves) – how much of the food was eaten
  • 8.
    "I have knownfor years that the problem with microwaved anything is not the radiation people used to worry about, it's how it corrupts the DNA in the food so the body cannot recognize it.“ Quote from experiment designer.
  • 9.
    What May HaveCaused These Results? • Microwaved water really is toxic • Uncontrolled variables – Disease/pests (before or during experiment) – Contamination of containers, temp. of water – Environmental factors (heat, light, soil) • Other factors – Age or type of plant is more/less susseptible • Experimenter bias – Faked photos (intentional) – Unequal treatment of samples/trials (snipped stems?)
  • 10.
    • Double-blind experiment –Researcher doesn’t know what X, Y & Z represent until end of the experiment to prevent bias in data • Myth-busters tested – Multiple samples, very controlled environment – Plants with micro-heated water grew the largest!
  • 11.
    Pre-Design Checklist  Isthe experiment logical, safe, and ethical/humane?  Can the experiment be completed in a week or two with readily available materials?  Is ONE manipulated variable(IV) identified?  Is the responding variable (DV) and units of measurement described?  Are there any uncontrolled variables which need to be added?
  • 12.
    The Scientific Method– Experiment Design • Write down your: – Independent Variable (ID) •What’s the ONE thing you change in order to test the affects? •HOW will you change the ID? – Dependent Variable (VD) •The outcome or response that is measured – Changes depend on the Independent Variable – How will you measure (& what units)? •HOW will you measure the VD? – ALWAYS use SI units!
  • 13.
    Experimental Controls • ControlledVariables: things that might affect the outcome and make it an unfair test. • Control Group: the group that is studied with no change in the independent variable – example: when a new drug is studied, some subjects do not receive the medicine so that the new drugs effect can be compared to something • Researcher Bias: preconceived ideas that affect how data is collected – Scientists always try to fit their data into a framework that makes sense with their personal beliefs (worldview).
  • 14.
    The Scientific Method– Experiment Design, cont. • Write down your: – Controlled Variables •Other things that could affect outcomes that must be kept the same •MANY things need to be controlled •A ‘control group’ is similar – – A trial by which all others are compared » (i.e. testing magnet strength with a non-magnet) – Materials •Supplies, equipment, location needs, etc. – Rough Procedure
  • 15.
    Controlling Bias • BlindStudies: research subjects don’t know if they are in the control group or the test group; only researchers know who is in which group. • Double Blind Studies: neither subjects nor scientists know who is in which until all data has been collected. • Multiple Trials: more subjects and/or trials = less prone to bias and error the experiment.
  • 16.
    Writing Detailed Procedures •Step-by-step instructions: – Number the steps (1, 2, 3…). – Chunk instructions into one action per step. – Use specific, descriptive commands. – Include pictures/diagrams to clarify (identify parts, materials, configuration/setup, etc.). • Specific explanations: – Logical order (makes sense) – Easily followed (no experience needed). – Include instructions for data collection.
  • 17.
    The Scientific Method– Experiment Procedure • Draw a recognizable object with a fair amount of detail • Write down INSTRUCTIONS for drawing that object using ONLY SHAPES (no saying what the thing is, like, “draw a nose”) – See if you can get me to copy your drawing PERFECTLY using only your directions. – Now try it with a neighbor. Video Intro
  • 18.
    The Scientific Method- Observation • It starts with an OBSERVATION: – you're on a hike with your classmates and you notice a footprint – you wonder, "What type of creature made this track?" – you're hiking near a stream, so it's likely some sort of aquatic bird or mammal – looking closely at the track, you see there are 5 digits (toes or claws) which rules out birds, and the left and right limbs seem to be roughly 15 cm apart. background research
  • 19.
    • You snapa picture of the tracks (with your foot in the shot for size reference) and head home • After a quick internet search for "aquatic mammal tracks," you find the pictures below: Turtle Otter Lizard Alligator Bullfrog
  • 20.
    The Scientific Method- Hypothesis • Based on the information you've gathered, what HYPOTHESIS would you make? – The tracks found near the stream on our hike were made by... » An Otter » A Lizard » A Turtle » A Bullfrog » An Alligator
  • 21.
    The Scientific Method- Experiment • How are you going to TEST your hypothesis? • You need to design an EXPERIMENT • A good experiment always has: – Variables • parts of your experiment that will change • usually just one thing changes at a time – Controls • parts of experiment that will stay the same every time • gives you something to compare the changes to • What happens if there is more than one variable? • Three aspects of an experiment: • Materials, Procedures, and Data Collection
  • 22.
    Experiment Procedures • Toperform an experiment, you need written procedures. Why? – to record EXACTLY what you did • detailed, step-by-step instructions – so it can be repeated (by you or others) 1. Measure imprints to nearest millimeter • size of digits, length & width • entire foot, length & width • distance between prints, length & width 2. Measure actual prints of hypothesized animal • compare measurements and record differences 3. Obtain cast of viewed prints • follow procedures at http://www.bear-tracker.com/plastertracks.html 4. Obtain mold of hypothesized animal's foot • follow 3D casting kit procedures • See if cast fits into mold and note any differences. Mold Cast
  • 23.
    Experiment Data Collection •There are usually supplies needed, listed in the materials section of the experiment. 1. Lab notebook and writing instrument 2. Metric ruler 3. Gypsum plaster and water 4. Cardboard strip and paper clip 5. Containers for mixing (margarine tubs or food cartons) 6. Wooden popsicle stick 7. Alginate molding powder
  • 24.
    Experiment Data Collection •As you perform the experiment, observations and data will be recorded. – measurements listed in a chart (OBJECTIVE data) – written observations – drawings – photos Hypothesized Animal Measurements (in mm) #1 (L) toe length #1 (L) toe width #2 toe length #2 toe width #3 toe length #3 toe width #4 toe length #4 toe width #5 toe length #5 toe width 8 mm 4 mm 9 mm 4 mm 11 mm 5 mm 11 mm 4 mm 10 mm 4 mm Entire print length: 35 mm Entire print width: 30 mm Length between prints: 97 mm Width between prints: 132 mm Imprint Measurements #1 (L) toe length #1 (L) toe width #2 toe length #2 toe width #3 toe length #3 toe width #4 toe length #4 toe width #5 toe length #5 toe width 6 mm 3 mm 8 mm 3 mm 9 mm 4 mm 10 mm 4 mm 8 mm 3 mm Entire print length: 28 mm Entire print width: 25 mm Length between prints: 88 mm Width between prints: 127 mm
  • 25.
    The Scientific Method- Conclusion • Next, an analysis of the data is required: – numbers, observations, and measurements are broken down, organized, and studied to gain better understanding – patterns often emerge, showing cause-and-effect relationships • After analyzing your data, you form a CONCLUSION – The measurements, when compared, showed an average 1.6 mm difference in length and .8 mm difference in width. – The cast was almost identical in shape, but did not fit into the mold of the hypothesized animal because it was 7 mm smaller in width and 4 mm shorter length-wise. – This supports the hypothesis that the animal tracks were made by...
  • 26.
    • A babypond turtle!
  • 27.
    The Scientific Method •If hypothesis is rejected – modify and repeat • If hypothesis is supported – repeat to verify results – share findings and let others perform the experiment • Either way, something was learned! – NEVER make up results simply because you think it was “supposed” to go differently
  • 28.
    When a groupof hypotheses are repeatedly supported by scientific data, they may become a theory. State the Problem (as a ?) Do Background Research "Best Guess" Solution Design (Materials & Procedures) Perform (Collect & Analyze Data) Report Results Hypothesis is False or Partly True Hypothesis is True Think! Try Again Conclusion Experiment & Results Hypothesis Observation & Objective/Question
  • 29.
    • “Only thosewho dare to fail greatly can ever achieve greatly.” - Robert F. Kennedy • “I have not failed. I've just found 10,000 ways that won't work.” - Thomas A. Edison • “The only real mistake is the one from which we learn nothing.” - Henry Ford • “Failures are finger posts on the road to achievement.” - C.S. Lewis
  • 30.
    Surface Type Slug Participant Speed(mm/s) Average SpeedSlimy Slim Jimmy Josie Tubby Glass Wood Linoleum Carpet Cement
  • 31.
    O2 In Different StreamLocations (mg/l) Rainbow Trout Gill Lice Average # of fish with lice# of fish with NO lice # of fish with 5-10 lice # of fish with > 10 lice NO Lice 5-10 Lice >10 Lice Day 1 Day 2 Day 3 Day 1 Day 2 Day 3 Day 1 Day 2 Day 3 < 4 mg/l 4-5.9 mg/l 6-7.9 mg/l 8-10 mg/l > 10 mg/l

Editor's Notes

  • #5 Engage: Tell students you are going to have a race to see who is the fastest. Pick volunteers Tell them that to really know how to decide who is the fastest; you are making the participants do things differently.   _____________ will get a 5 second head start.   _____________ will only have to run ½ of the distance.   _____________ will have to carry a heavy backpack during the race.   _____________ will have to run backwards.   _____________ will have to hop like a rabbit all of the way.   Have students form a hypothesis. Run the race. Collect the data. Form conclusions. Does the data support your hypothesis? Typically they will say that the race is not fair. No matter how it comes out, no one will know who is the fastest because it is not fair. To be fair, everyone should have to complete the same distance, in the same way, and start at the same time. How can we make this a fair test? What other variables may have affected the outcome? (shoes, clothing, etc.) 10. Run the race again with the variables controlled this time. Ask, “Was this race fair?”   Explore: Ask them to list as a class the variables &amp; graph the data. Independent variable – students (here on your x axis would the names of the participants and you would have to use a bar graph. The 5th grade standards, however, stress numerical variables that can be represented by a line graph.) Dependent variable – time it takes for them to run around the building. Controlled variables – all participants should run the same distance, the same way, and start at the same time.
  • #9 Anti-microwave quote: &amp;quot;I have known for years that the problem with microwaved anything is not the radiation people used to worry about, it&amp;apos;s how it corrupts the DNA in the food so the body cannot recognize it. So the body wraps it in fat cells to protect itself from the dead food or it eliminates it fast.. Think of all the Mothers heating up milk in these “Safe” appliances. What about the nurse in Canada that warmed up blood for a transfusion patient and accidently killed them when the blood went in dead. But the makers say it’s safe. Never mind then, keep using them. Ask your Doctor I am sure they will say it’s safe too. Proof is in the pictures of living plants dying. Remember You are also Living. Take Care.” - What’s wrong with this conclusion? - NO DNA in water! - living food cells cannot survive the digestive process – food DNA is broken down into nucleic acids which are then “built” by your own cells’ DNA patterns - toxins (or “corrupted DNA”) are not stored in fat cells: liver and/or kidneys filter out - connects water/plant to milk/babies and blood/patient – but not tested - blood is not “dead” or “alive” - just because plants and humans are both living, it doesn’t mean we are affected by the same chemicals/nutrients/substances (you wouldn’t want to breathe CO2 just because it’s what plants need to survive) - all forms of heat degrade nutrients - appeal to fear/pity &amp; lack of understanding
  • #11 Some people hold to their bias so strongly that even when presented with solid evidence, they refuse to believe it. Science takes an open, objective, honest mind that seeks to verify the evidence presented. We do this by working together (many minds, a community, brings more creativity). Does the number of studies make any difference in how convincing the evidence is?
  • #28 ...or unrecognized variable (maybe two different animals made tracks on top of each other - they&amp;apos;d be hard to distinguish)? ...or no control (you couldn&amp;apos;t tell what&amp;apos;s causing a change)