Downloaded 497 times
![Analysis and Classification of Electromyogram
(EMG) Signals
Nur Hasanah Binti Shafei, Nur Sabrina Binti Risman, Kartini Binti Ibrahim, Idayu Binti Mohamed Rasid
Faculty of Electrical Engineering
Universiti Teknologi Malaysia, 81310 UTM Skudai, Johor Darul Ta’zim
Abstract – The early diagnosis in medical healthcare
application were really needed and crucial. It is
therefore important to devise accurate methods of
diagnosis. Currently, methods of diagnosis include
assessing the patients’ history, blood tests and
muscle biopsies. The latter two methods, whilst
being relatively accurate, may take weeks to obtain a
result [1]. This paper investigates another commonly
used method is electromyography by analysis and
classification the EMG signals. The system has
successfully implemented by using MATLAB’s
software that was able to differentiate the EMG
signal coming from different patients. The signal Figure 1: How to perform EMG instrument
from respective patients can be easily identified by
development of Graphical User Interface (GUI). The input EMG signal can be captured
nicely and useful for diagnosis if the placing of
I. INTRODUCTION electrode heavily considered. The figure 2 below,
show the different signals captured for different
Electromyography (EMG) is a technique for
place of muscles.
evaluating and recording the electrical activity
produced by skeletal muscles. EMG is performed
using an instrument called an electromyograph, to
produce a record called an electromyogram. An
electromyograph detects the electrical potential
generated by muscle cells when these cells are
electrically or neurologically activated [2].
The action of nerves and muscle is essentially
electrical. Information is transmitted along nerves
as a series of electrical discharges carrying
information in pulse repetition frequency. [3] Figure
1 shows how to perform EMG instrument by placing Figure 2: Time & frequency graphs for different
the electrode at the muscle. place of muscles](https://image.slidesharecdn.com/dsplabreport-111212102514-phpapp01/85/Dsp-lab-report-Analysis-and-classification-of-EMG-signal-using-MATLAB-1-320.jpg)
![EMG signals acquire advanced methods then would be used as input to a rule base classifier
for detection, decomposition, processing, and to be implemented in the software.
classification. The purpose to provide efficient
and effective ways of understanding the signal
and its nature, we further point up some of the
software implementation for identifying the
signals coming from different patients. This
knowledge may help in medical healthcare center
to develop more powerful, flexible, and efficient
applications [4].
II. METHODOLOGY
First and foremost, a block diagram must
be designed to be the basic reference. Based on
Figure 4: The step involves for designing the
figure 3, this is a general block diagram of this
complete system.
experiment. The system was received two
difference EMG signals coming from two different
patients. Then, the system was identified the signal
belong to which patient.
Patient 1 Identify the
SYSTEM
Patient’s
Patient 2 (MATLAB)
signal
Figure 3: The block diagram of analysis of EMG
signal.
In order to design the system, there are six
steps to be done. Below, in the figure 4, there were
the sequences of our procedure. The first step was
we needed to identify the EMG characteristic in
terms of its power and frequency. Those
characteristic helped us to continue the next step.
From the input signals, the system
generated the power spectrum. By using the fast
Fourier transformation the EMG power spectrum
can be obtained with a better resolution. We
examined the power spectrum of the EMG patents
to define the parameters that can be used to
Figure 5: The flow chart of Matlab Programming.
identify the various patients. The signal parameters](https://image.slidesharecdn.com/dsplabreport-111212102514-phpapp01/85/Dsp-lab-report-Analysis-and-classification-of-EMG-signal-using-MATLAB-2-320.jpg)
![The coding implemented for the above ideas in elseif(absx > 10)
figure 5 were as follow [5]: % xH = avex2
msgbox('The signal belong to patient 2')
a) For load the data end
%DSP Laboratory
% Parameter3: Root mean square
%Analysis and Classification of EMG Signals
rms_x = sqrt(mean(Y.^2))
%Load Data from user absrms = abs (rms_x)
A = load ('emg1.txt'); % A = load ('emg2.txt') if % Classification for the result process
emg2 signal xH = 0;
Y = fft(A(:,1),1024); % FFT of sample data if (absrms < 370)
figure, plot (A) % Show FFT Figure % xH = avex1;
xlabel('Time (ms)') msgbox('The signal belong to patient 1')
ylabel ('Amplitude (uV)') elseif(absrms > 370)
figure,stem (abs(Y)); % To generate power spectrum % xH = avex2
xlabel('Frequency') msgbox('The signal belong to patient 2')
ylabel ('Amplitude') end
b) There are several parameters that can be used % Parameter4: Maximum power
as an input of rule base classifier. The system z = abs (Y);
designed for obtaining results by simply using maxz = max (z)
one of the following signal parameters. % Classification for the result process
xH = 0;
% Parameter1: Median value if (maxz < 5200)
medianx = median (Y) % xH = avex1;
absx = abs(median msgbox('The signal belong to patient 1')
% Classification for the result process elseif(maxz > 5200)
xH = 0; % xH = avex2
if (absx < 580) msgbox('The signal belong to patient 2')
% xH = avex1; end
msgbox('The signal belong to patient 1')
elseif(absx > 580) % Parameter5: Minimum power
% xH = avex2 z = abs (Y);
msgbox('The signal belong to patient 2') minz = min (z)
end % Classification for the result process
xH = 0;
% Parameter2: Average value if (minz < 20)
avex = mean (Y) % xH = avex1;
absx= abs(avex) msgbox('The signal belong to patient 1')
% Classification for the result process elseif(minz > 20)
xH = 0; % xH = avex2
if (absx < 10) msgbox('The signal belong to patient 2')
% xH = avex1; end
msgbox('The signal belong to patient 1')](https://image.slidesharecdn.com/dsplabreport-111212102514-phpapp01/85/Dsp-lab-report-Analysis-and-classification-of-EMG-signal-using-MATLAB-3-320.jpg)
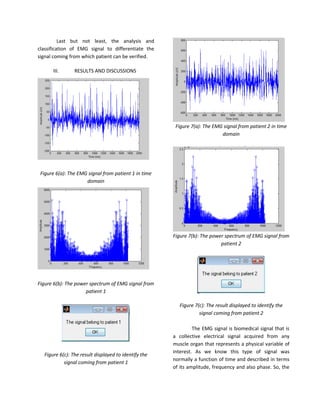
![power spectrum that was generated from the input EMG signals coming from which patient. The figures
signal was examined in order to identify the 6 showed the results obtained when the system
suitable signals parameters to differentiate the was loaded the EMG signal from patient 1. The
signal from respective patients. In terms of power displaying box was used to verify the performance
spectrum, the obvious characteristics of both of our system. While the figures 7 were the results
signals which are in terms of amplitude, power obtained when the system was loaded the EMG
spectrum density can be easily analyzed and signal coming from another patient which was
classified. patient 2. Last but not least, figures 8 below show
the verification of the results by using GUI.
Several parameters can be accounted to
use as the input of rule base classifier which were IV. CONCLUSIONS
median frequency, mean frequency, the amplitude
in terms of root mean square, maximum and The study investigates the rule based
minimum power spectrum density. classifier from the EMG signal parameters to
differentiate the EMG signal coming from different
patients. This application of EMG signals that were
generated by the muscles in human body
commonly use in medical field for diagnostic
purpose. According to our experimental results, the
suitable parameters were determined to successful
implemented to complete system. The performance
of the system which is the ability to identify the
EMG signals coming from different patients was
verified.
V. REFERENCES
Figure 8(a): the result obtaining for patient 1 by
using GUI
[1]. Martin, L., Diagnosis of Neuromuscular
disease using surface EMG with neural network
analysis. COIN512(Comp.) Project Brief
[2]. David, M. Blake, Procedures Offered for
Lexington Neurology General Services. Lexington,
KY.
[3]. Malcown, C. Brown, The Medical
Equipment Dictionary- Electromygram. 2007.
Liverpool, United Kingdom.
[4]. M.B.I Raez, et al. Zhu, J., et al. Techniques
of EMG Signal Analysis: Detection, Processing,
Classification and Applications. 2006
Figure 8(b): the result obtaining for patient 2 by [5]. Wan Mohd Bukhari Bin Wan Daud
using GUI Classification of EOG signals of Eye Movement
Potentials. 2009
Simply using only one of the above signal
parameter, the system was able to differentiate the](https://image.slidesharecdn.com/dsplabreport-111212102514-phpapp01/85/Dsp-lab-report-Analysis-and-classification-of-EMG-signal-using-MATLAB-5-320.jpg)

This document discusses a study analyzing and classifying electromyogram (EMG) signals. The researchers developed a MATLAB-based system that can differentiate EMG signals coming from different patients. The system analyzes time and frequency domain characteristics of the EMG signals, including median value, average value, root mean square, maximum power, and minimum power. It then uses these characteristics to identify which patient a given EMG signal belongs to through a graphical user interface. The system was able to accurately classify EMG signals from two patients based on their power spectrum signatures.