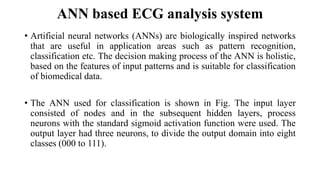
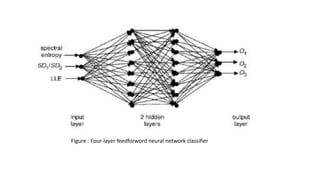
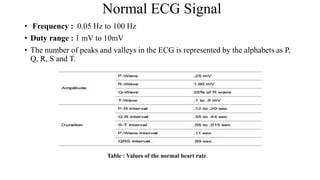
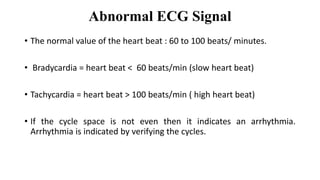
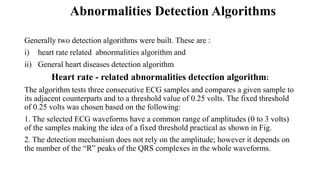
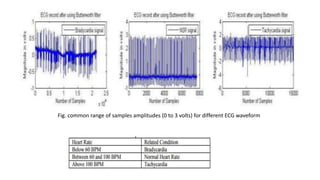
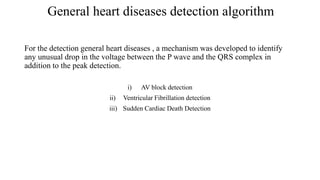
The document discusses ECG signal analysis and abnormality detection using artificial neural networks. It defines normal and abnormal ECG signals, describing abnormalities like bradycardia and tachycardia. Two algorithms are described for detecting abnormalities: one analyzes heart rate and the other detects general heart diseases. An ANN system is used for ECG analysis and classification, taking spectral entropy, Poincare plot geometry, and largest Lyapunov exponent as inputs to classify eight cardiac conditions.
![Ventricular Fibrillation Condition
The VF is mainly characterized by the absence of peaks and drops with large magnitudes, the
samples magnitude ranges from .3 volts to -.15 volts only. The algorithm tests if any given sample
lies outside the interval [-0.5, 0.5]. The samples of the VF ECG waveform have narrow range of
magnitudes as shown in Fig., therefore the threshold of ± .5 volts was chosen. If the number of peaks
counted is equal to 0, it is concluded that the patient suffers from Ventricular Fibrillation.
Fig. VF Ventricular Fibrillation ECG waveform with a narrow range of amplitudes](https://image.slidesharecdn.com/biomedicalsignalprocessing-171217065055/85/Biomedical-signal-processing-10-320.jpg)
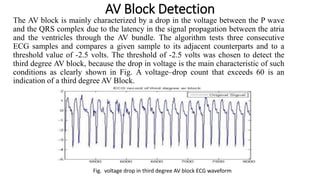
![Sudden Cardiac Death Detection
The SCD is mainly characterized by the absence of peaks and drops along with a semi-linear
behavior of the signal. The algorithm tests if any given sample lies outside the range [- 0.15,0.15].
The threshold of ± .15 is very adequate to the SCD condition, as the absence of the electrical activity
of the heart on the second half of the ECG waveform has dramatically narrowed the range of the
amplitudes of the samples as shown in Fig.
Fig. Absence of the electrical activity of the heart on the second half of the ECG
waveform in the SCD Condition](https://image.slidesharecdn.com/biomedicalsignalprocessing-171217065055/85/Biomedical-signal-processing-11-320.jpg)