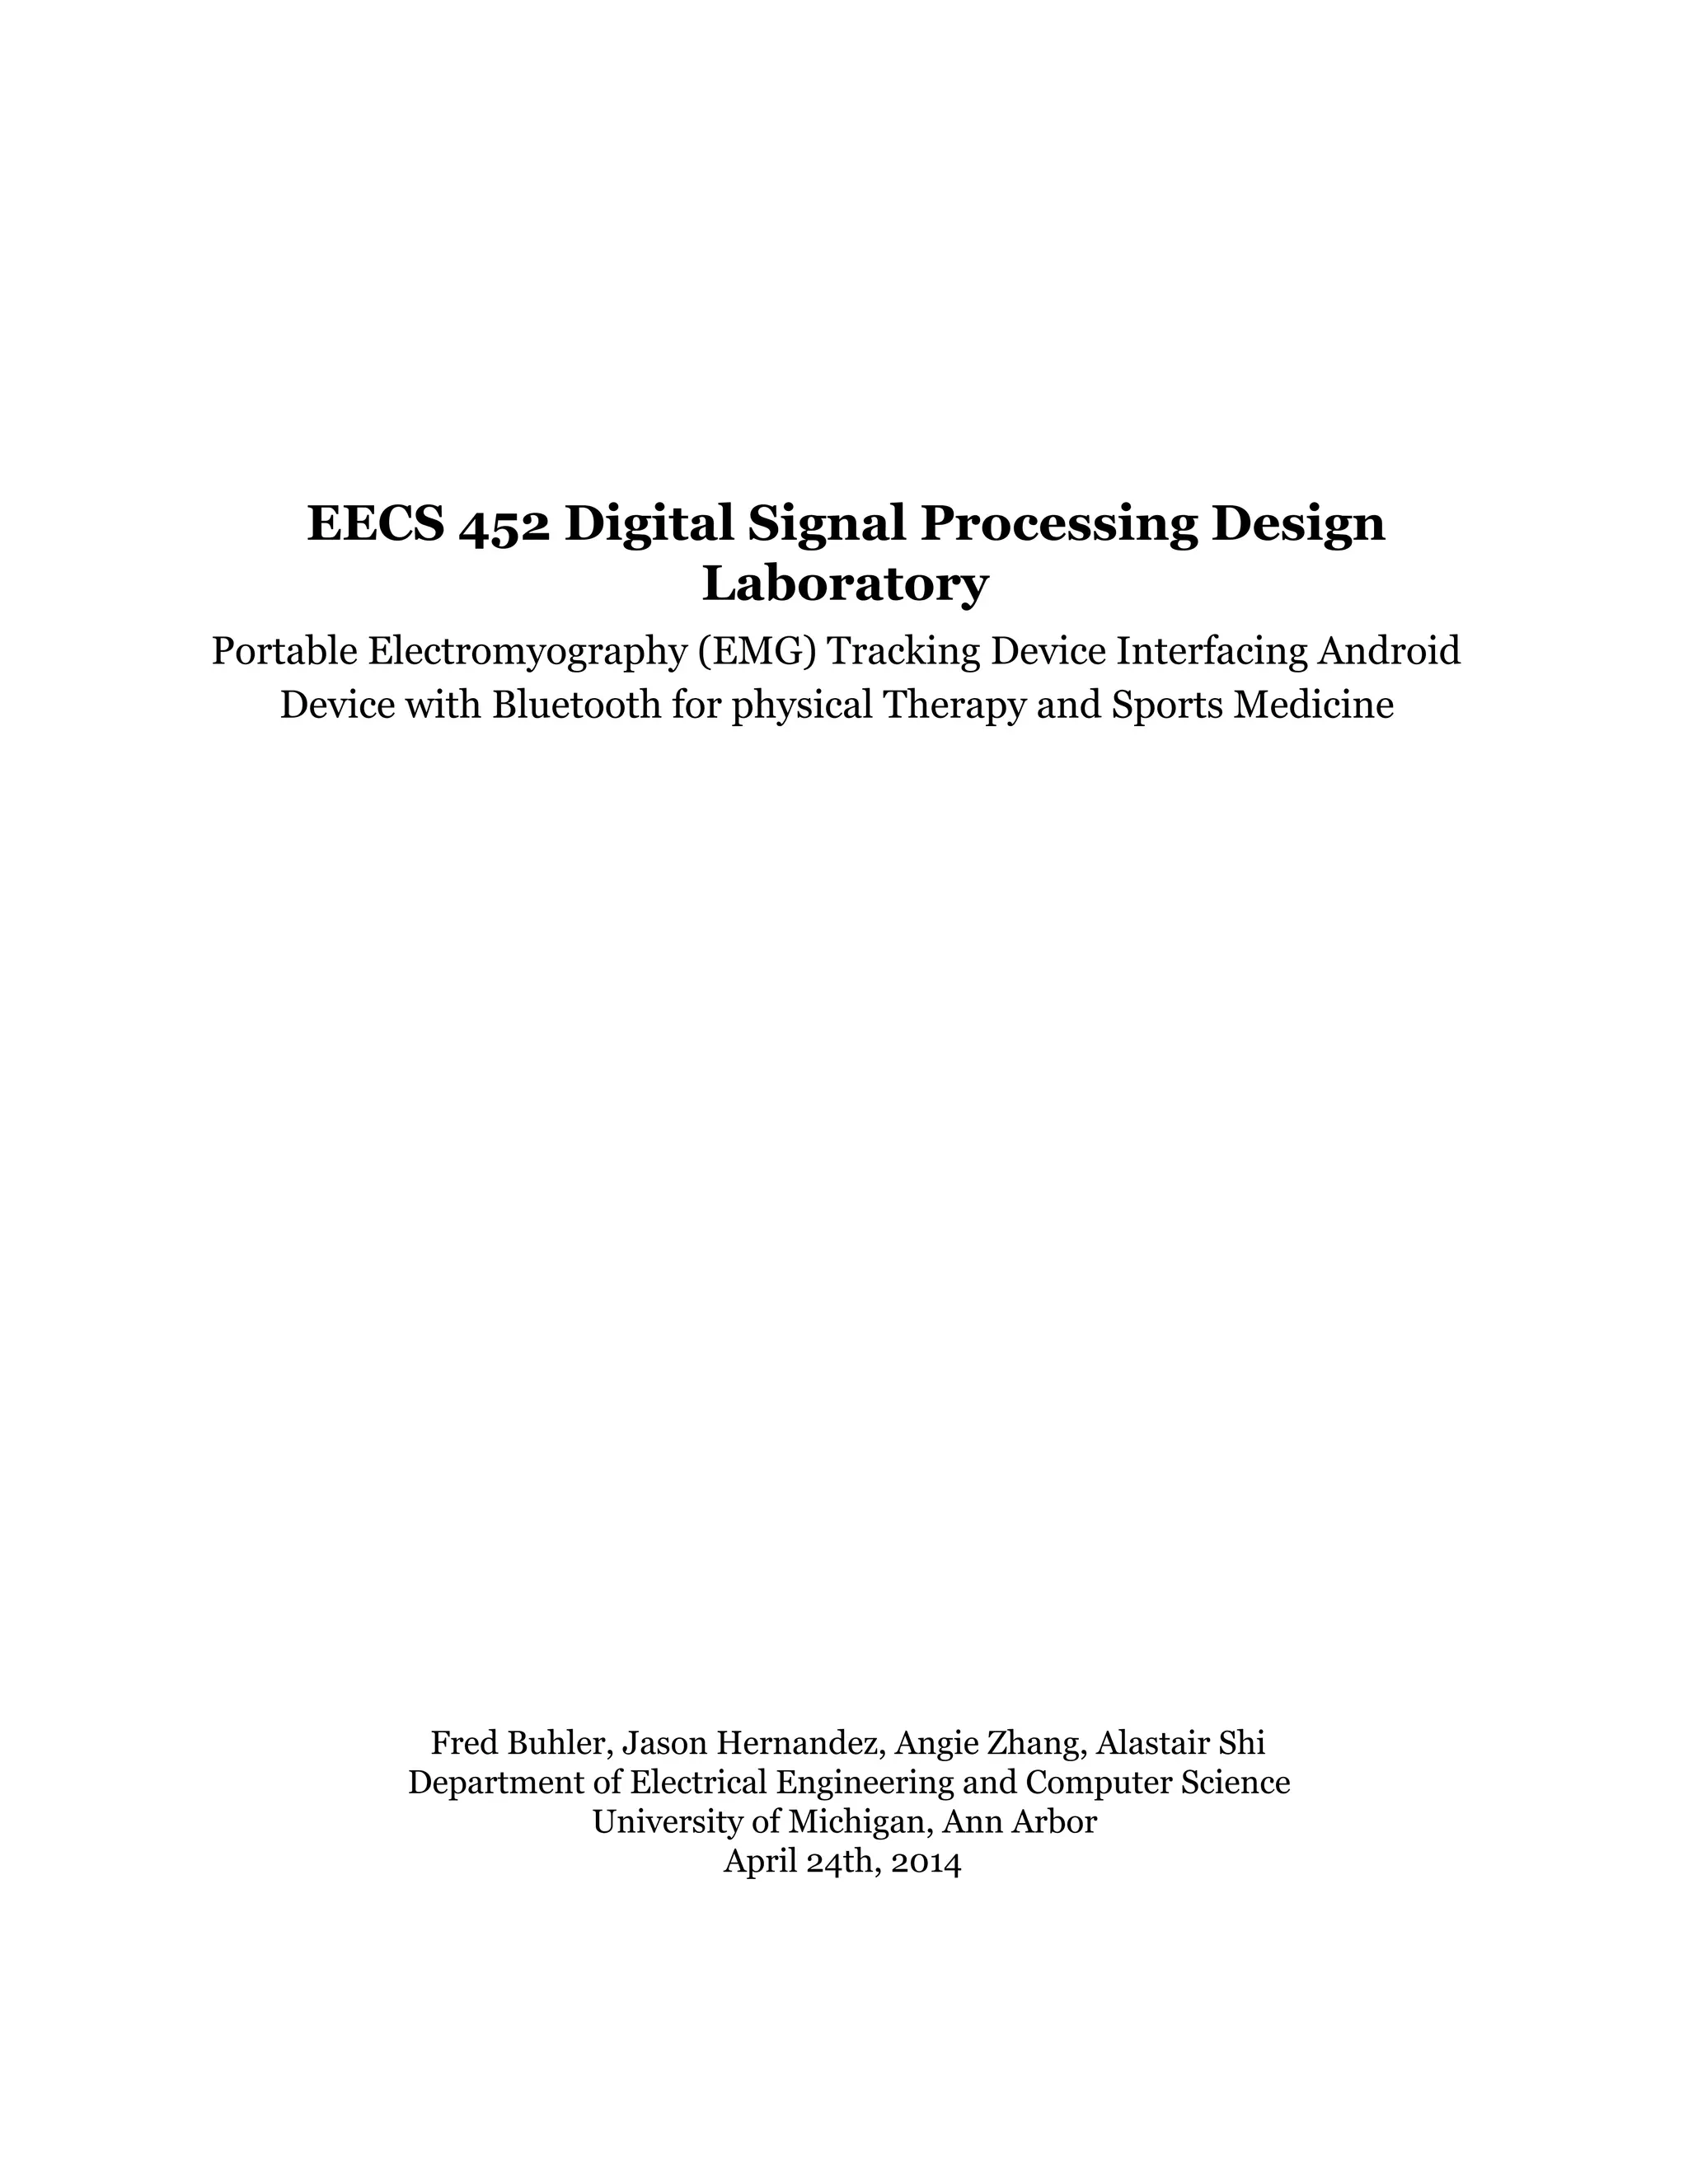
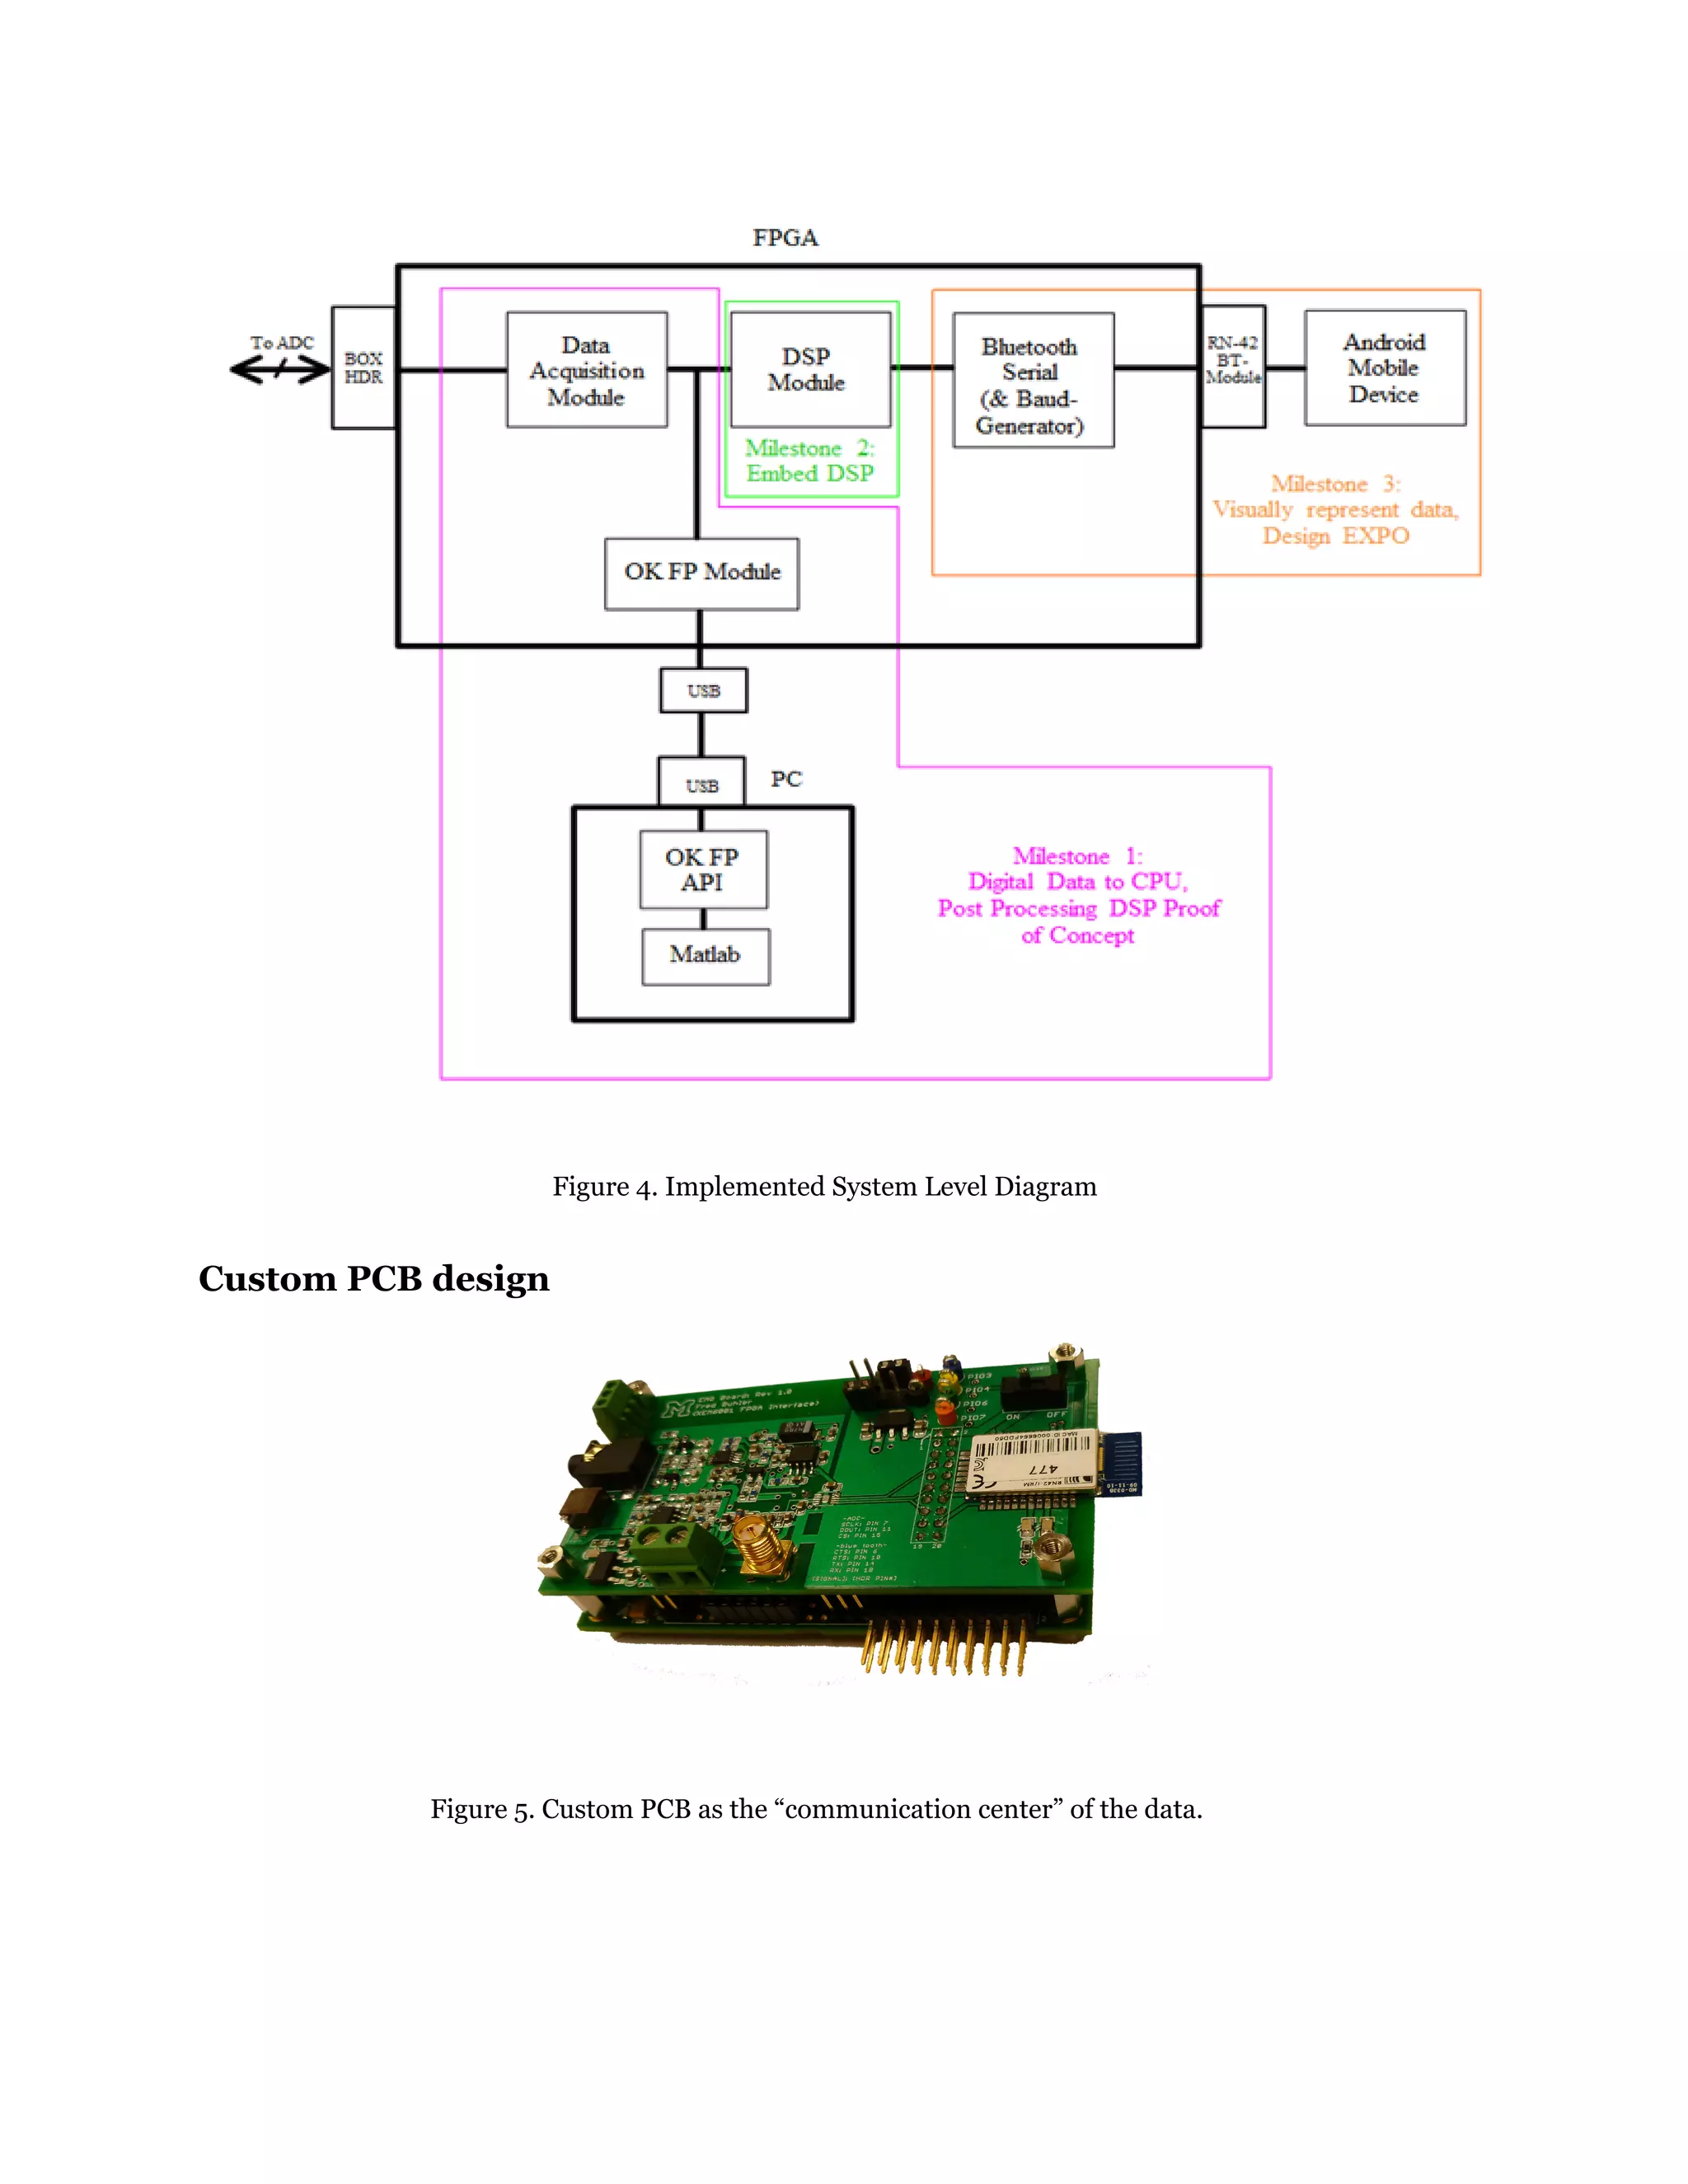
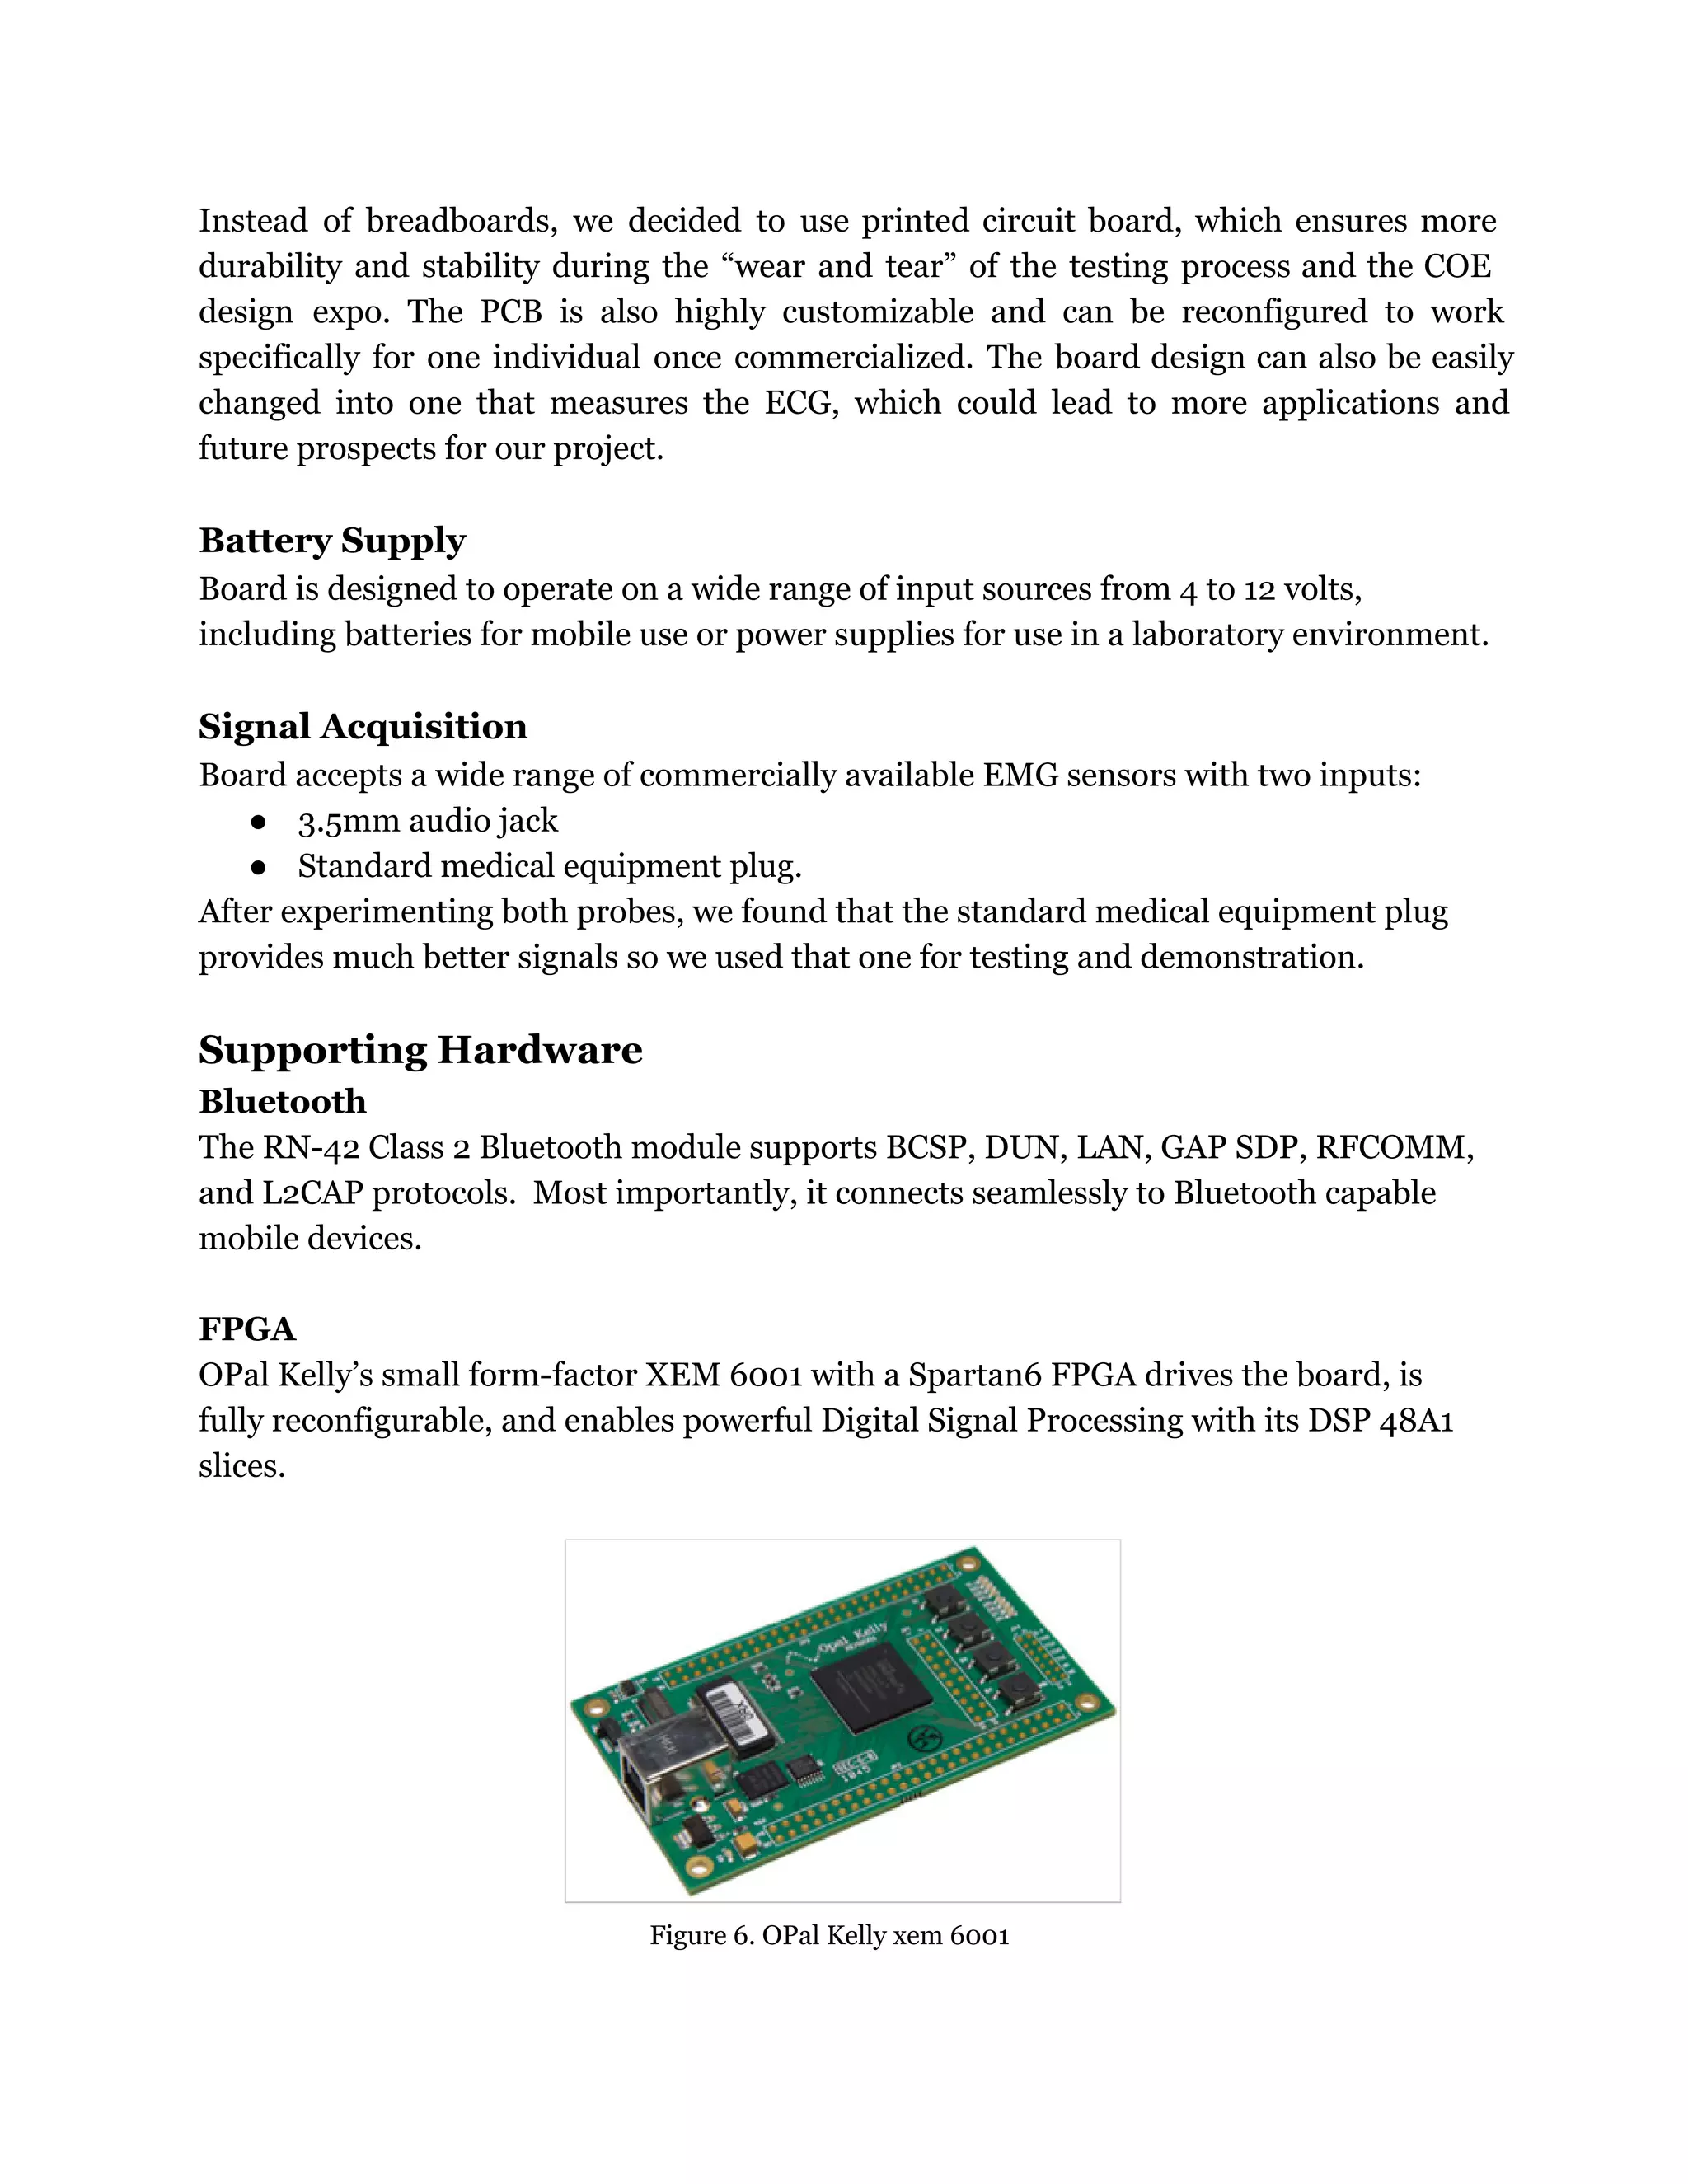
The document describes a project to develop a portable electromyography (EMG) tracking device that interfaces with an Android device via Bluetooth. The goals were to implement a custom printed circuit board design with EMG signal processing capabilities, fatigue identification and force output algorithms, and wireless data transmission to a mobile device. Key aspects included acquiring EMG signals, filtering and processing the data using an FPGA and developed algorithms, and transmitting information over Bluetooth about muscle fatigue levels and force output.

![DSP Algorithm Development
Figure 7. Exhibits a simplified block diagram representing the DSP aspects found within the project.
The first 3 modules prepare the data for our information extraction modules that are present later in
the datapath.
1) Fatigue Identifier Algorithm
Initial Method: Mean Frequency
Before beginning work on our DSP algorithm, our team read through many EMG
publications in order to identify the most appropriate means for obtaining the
information we wanted. An earlier option of ours was to detect something known as the
median frequency within the power spectrum. This was considered to be a valuable
parameter because of the way it behaved during a muscle's state of fatigue.
Figure 8. Mean frequency spectrum and its correlation with muscle fatigue. [1]](https://image.slidesharecdn.com/d1938a17-05c2-443a-a375-e2796b60e675-151204194305-lva1-app6892/75/EECS452EMGFinalProjectReportPDF-8-2048.jpg)
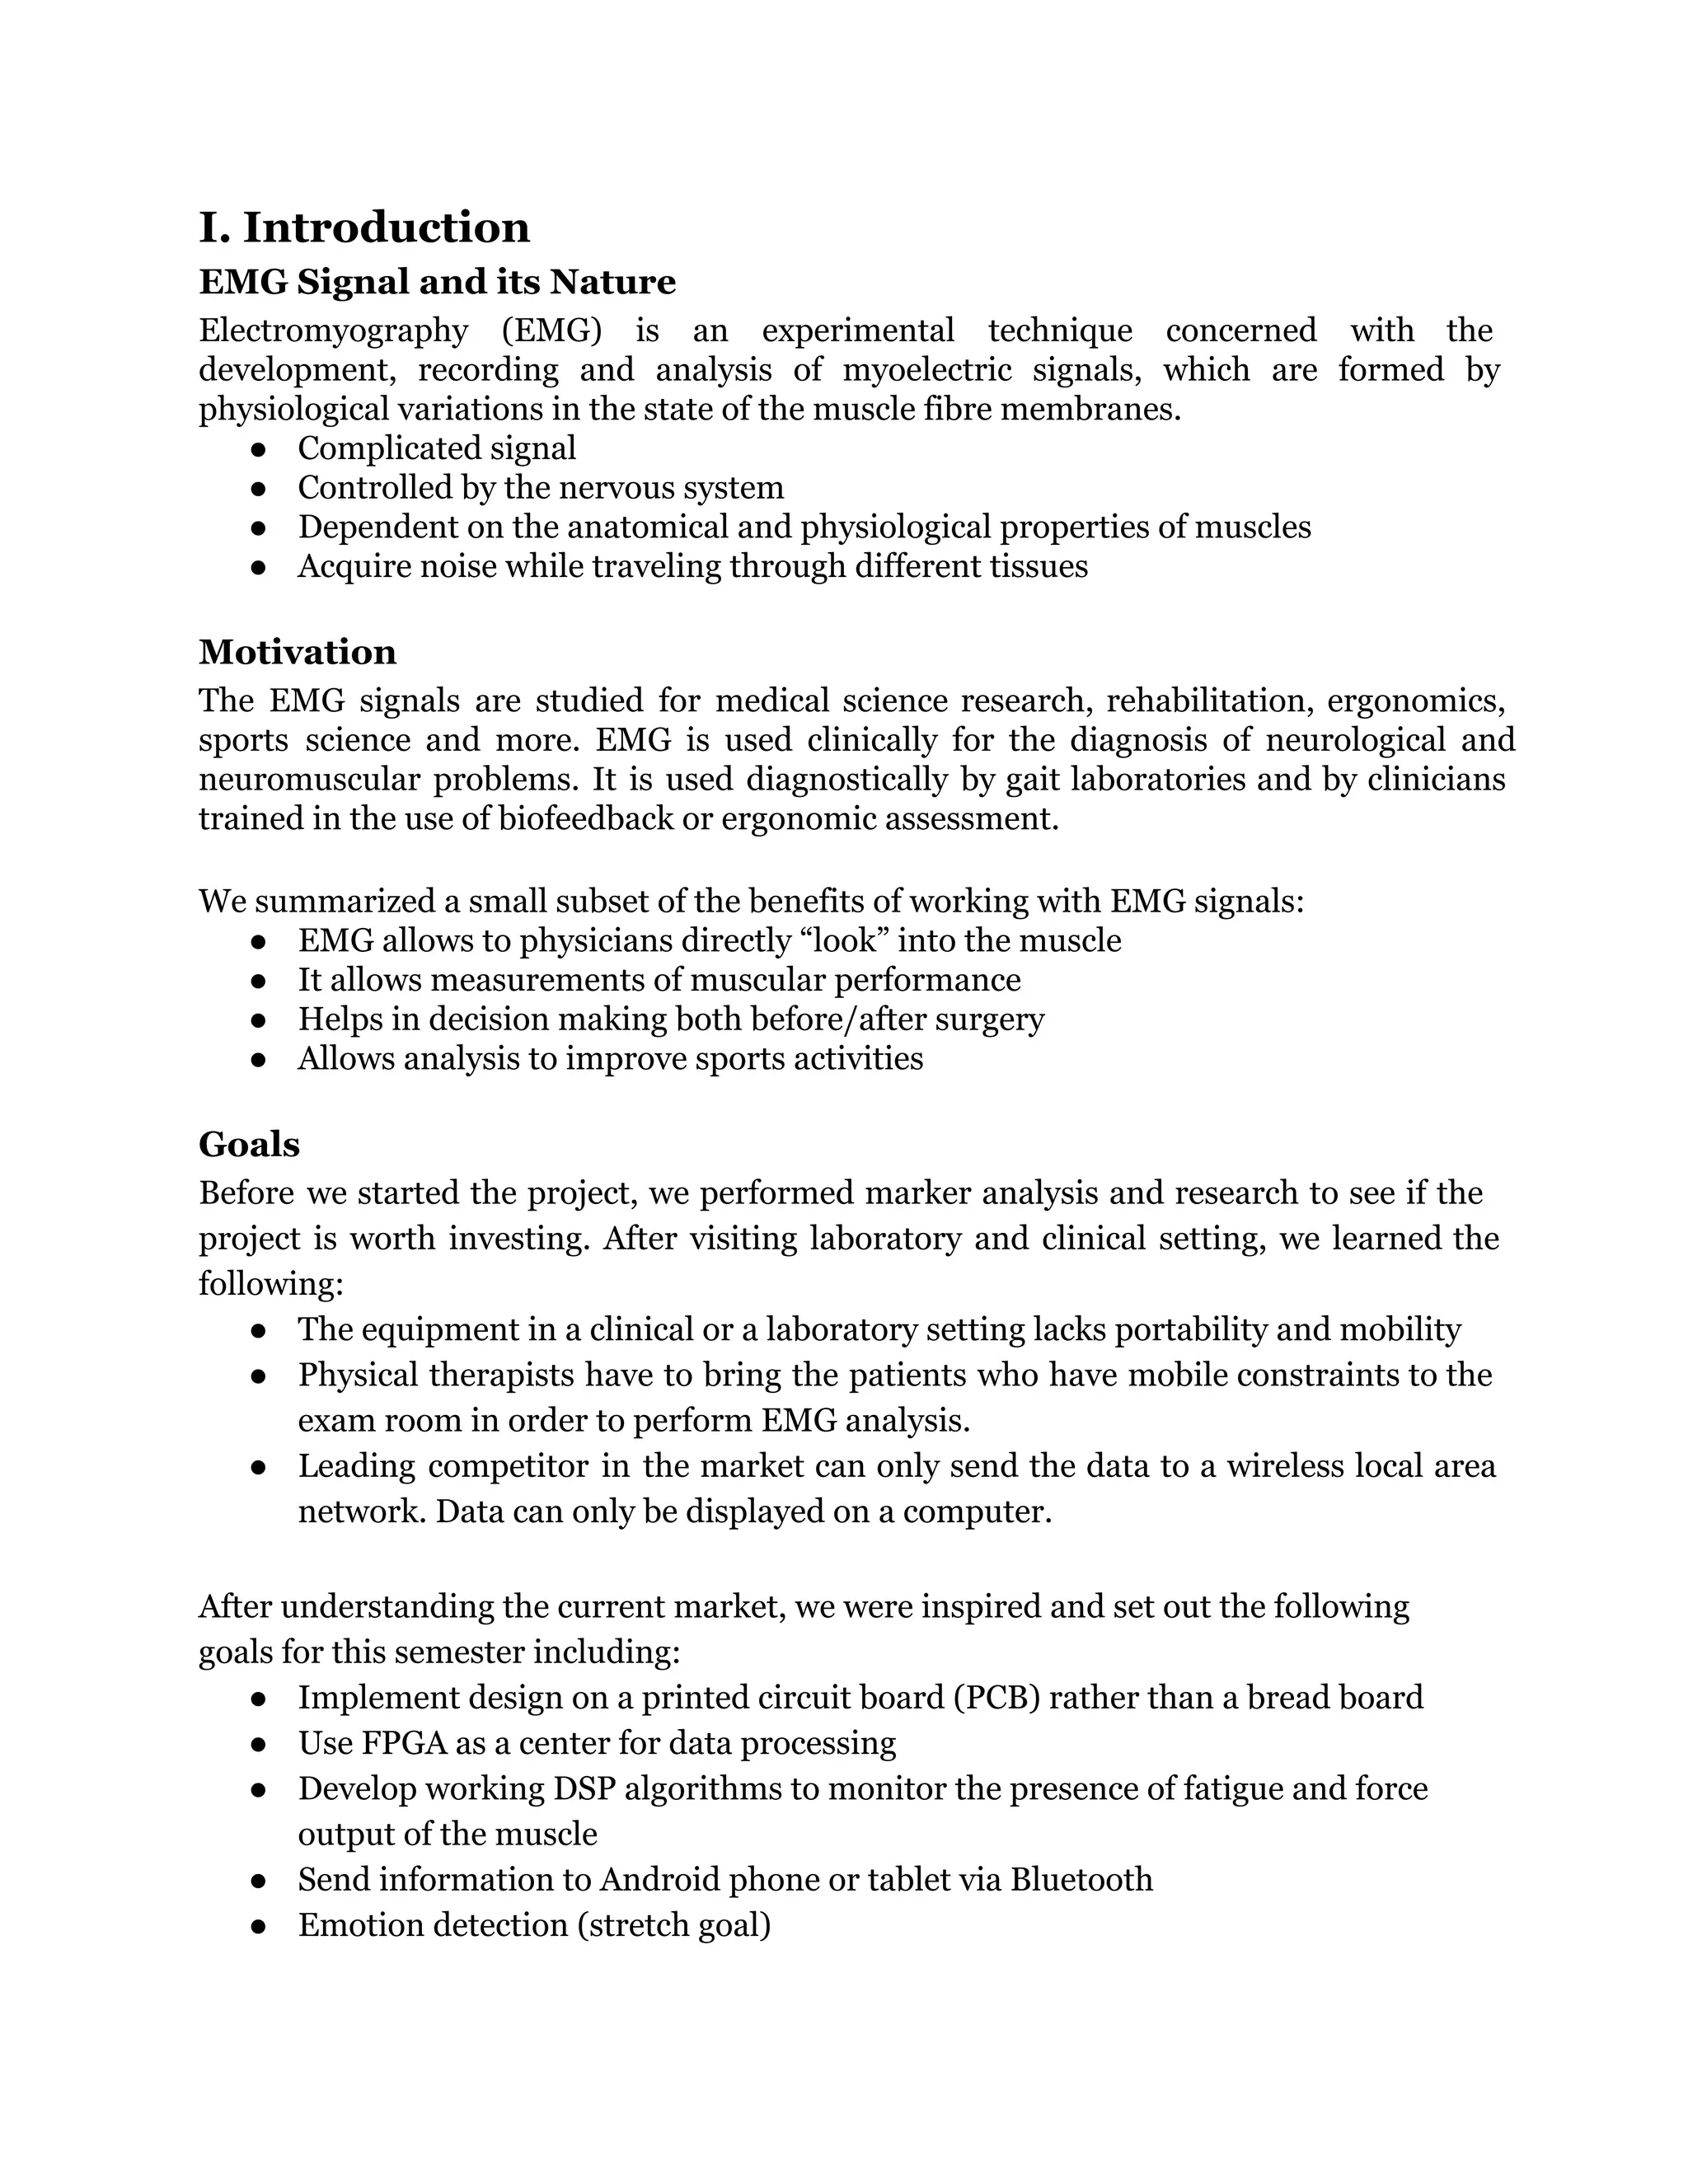
![A New Route: Power Spectrum
As we began implementing an algorithm which monitored this ability, out team
continued to research alternatives to identifying levels of muscle fatigue. We eventually
found out that not only did the median frequency shift a certain way during fatigue, but
there was a distinct change in the total power as well (Figure 8). Amplitudes at
frequencies greater than 30 Hz remained consistent as a muscle grew tired while
amplitudes for frequencies below 30 Hz increased dramatically. This phenomenon
explains both why the median point on the spectrum falls to a lower frequency, and why
there is an overall power increase in the spectrum [2].
After confirming that our newly obtained knowledge was persistent with our own data,
we settled on a means for observing the power spectrum. We chose to implement a
moving average filter as the core means for preparing our data for the nonconventional
processes that would occur later in our datapath. Initial Matlab tests with MA filters not
only proved its effectiveness on our datasets, but also demonstrated its applicability for a
variety of information extractions.
When visually observing the output of the MA filter, the biological properties which we
sought were clearly evident from one dataset to the next. Not only did the output
clearly resemble the force being exerted by the muscle of interest, but there was a
distinct definition of when the onset of fatigue occurred (Figure 9).
Figure 9. The input (rectified data) and output to the MA filter on a dataset that describes a
repetitive lifting of a 10 lb weight. Note the distinct vertical shift around the 25,000th
sample,
representing the onset of fatigue in the measured muscle](https://image.slidesharecdn.com/d1938a17-05c2-443a-a375-e2796b60e675-151204194305-lva1-app6892/75/EECS452EMGFinalProjectReportPDF-9-2048.jpg)
![fatigue is present, and this shift would have to be accounted for in order prevent an
overestimation of the force [3].
Implementing Logic on FPGA
After fully develop the algorithms, we needed to implement them on the FPGA. The
elements of the DSP algorithm block diagram were implemented as individual modules
in HDL. The primary tool used to generate these modules was a built-in “Core
Generator” module known as “IP Core”. Through this tool various filters were built. The
“Core Generator” requires various configuration parameters such as filter coefficients,
data input type, sampling rate, and other things specific to core such as when data is
ready to leave and enter the core. This tool was used in the design of the blocks “Low
Pass Filter”, and “MA Filter” in conjunction to fdatool. The MA filter has all coefficients
set to “1”. There are various other handwritten VHDL modules to interface all of the
core generator modules, along with to handle the rectification/offset block, calibration,
and fatigue/force output.
Fatigue Identifier Module
The fatigue module detected fatigue based on a theory regarding an increase in values of
the EMG amplitude. Through the Calibration module we would acquire the average
value of the EMG, we would then calculate 25% more than that value indicating fatigue.
Once this value was acquired we would raise a flag showing fatigue signaling for the
Bluetooth communication module to tell the phone app to show fatigue.
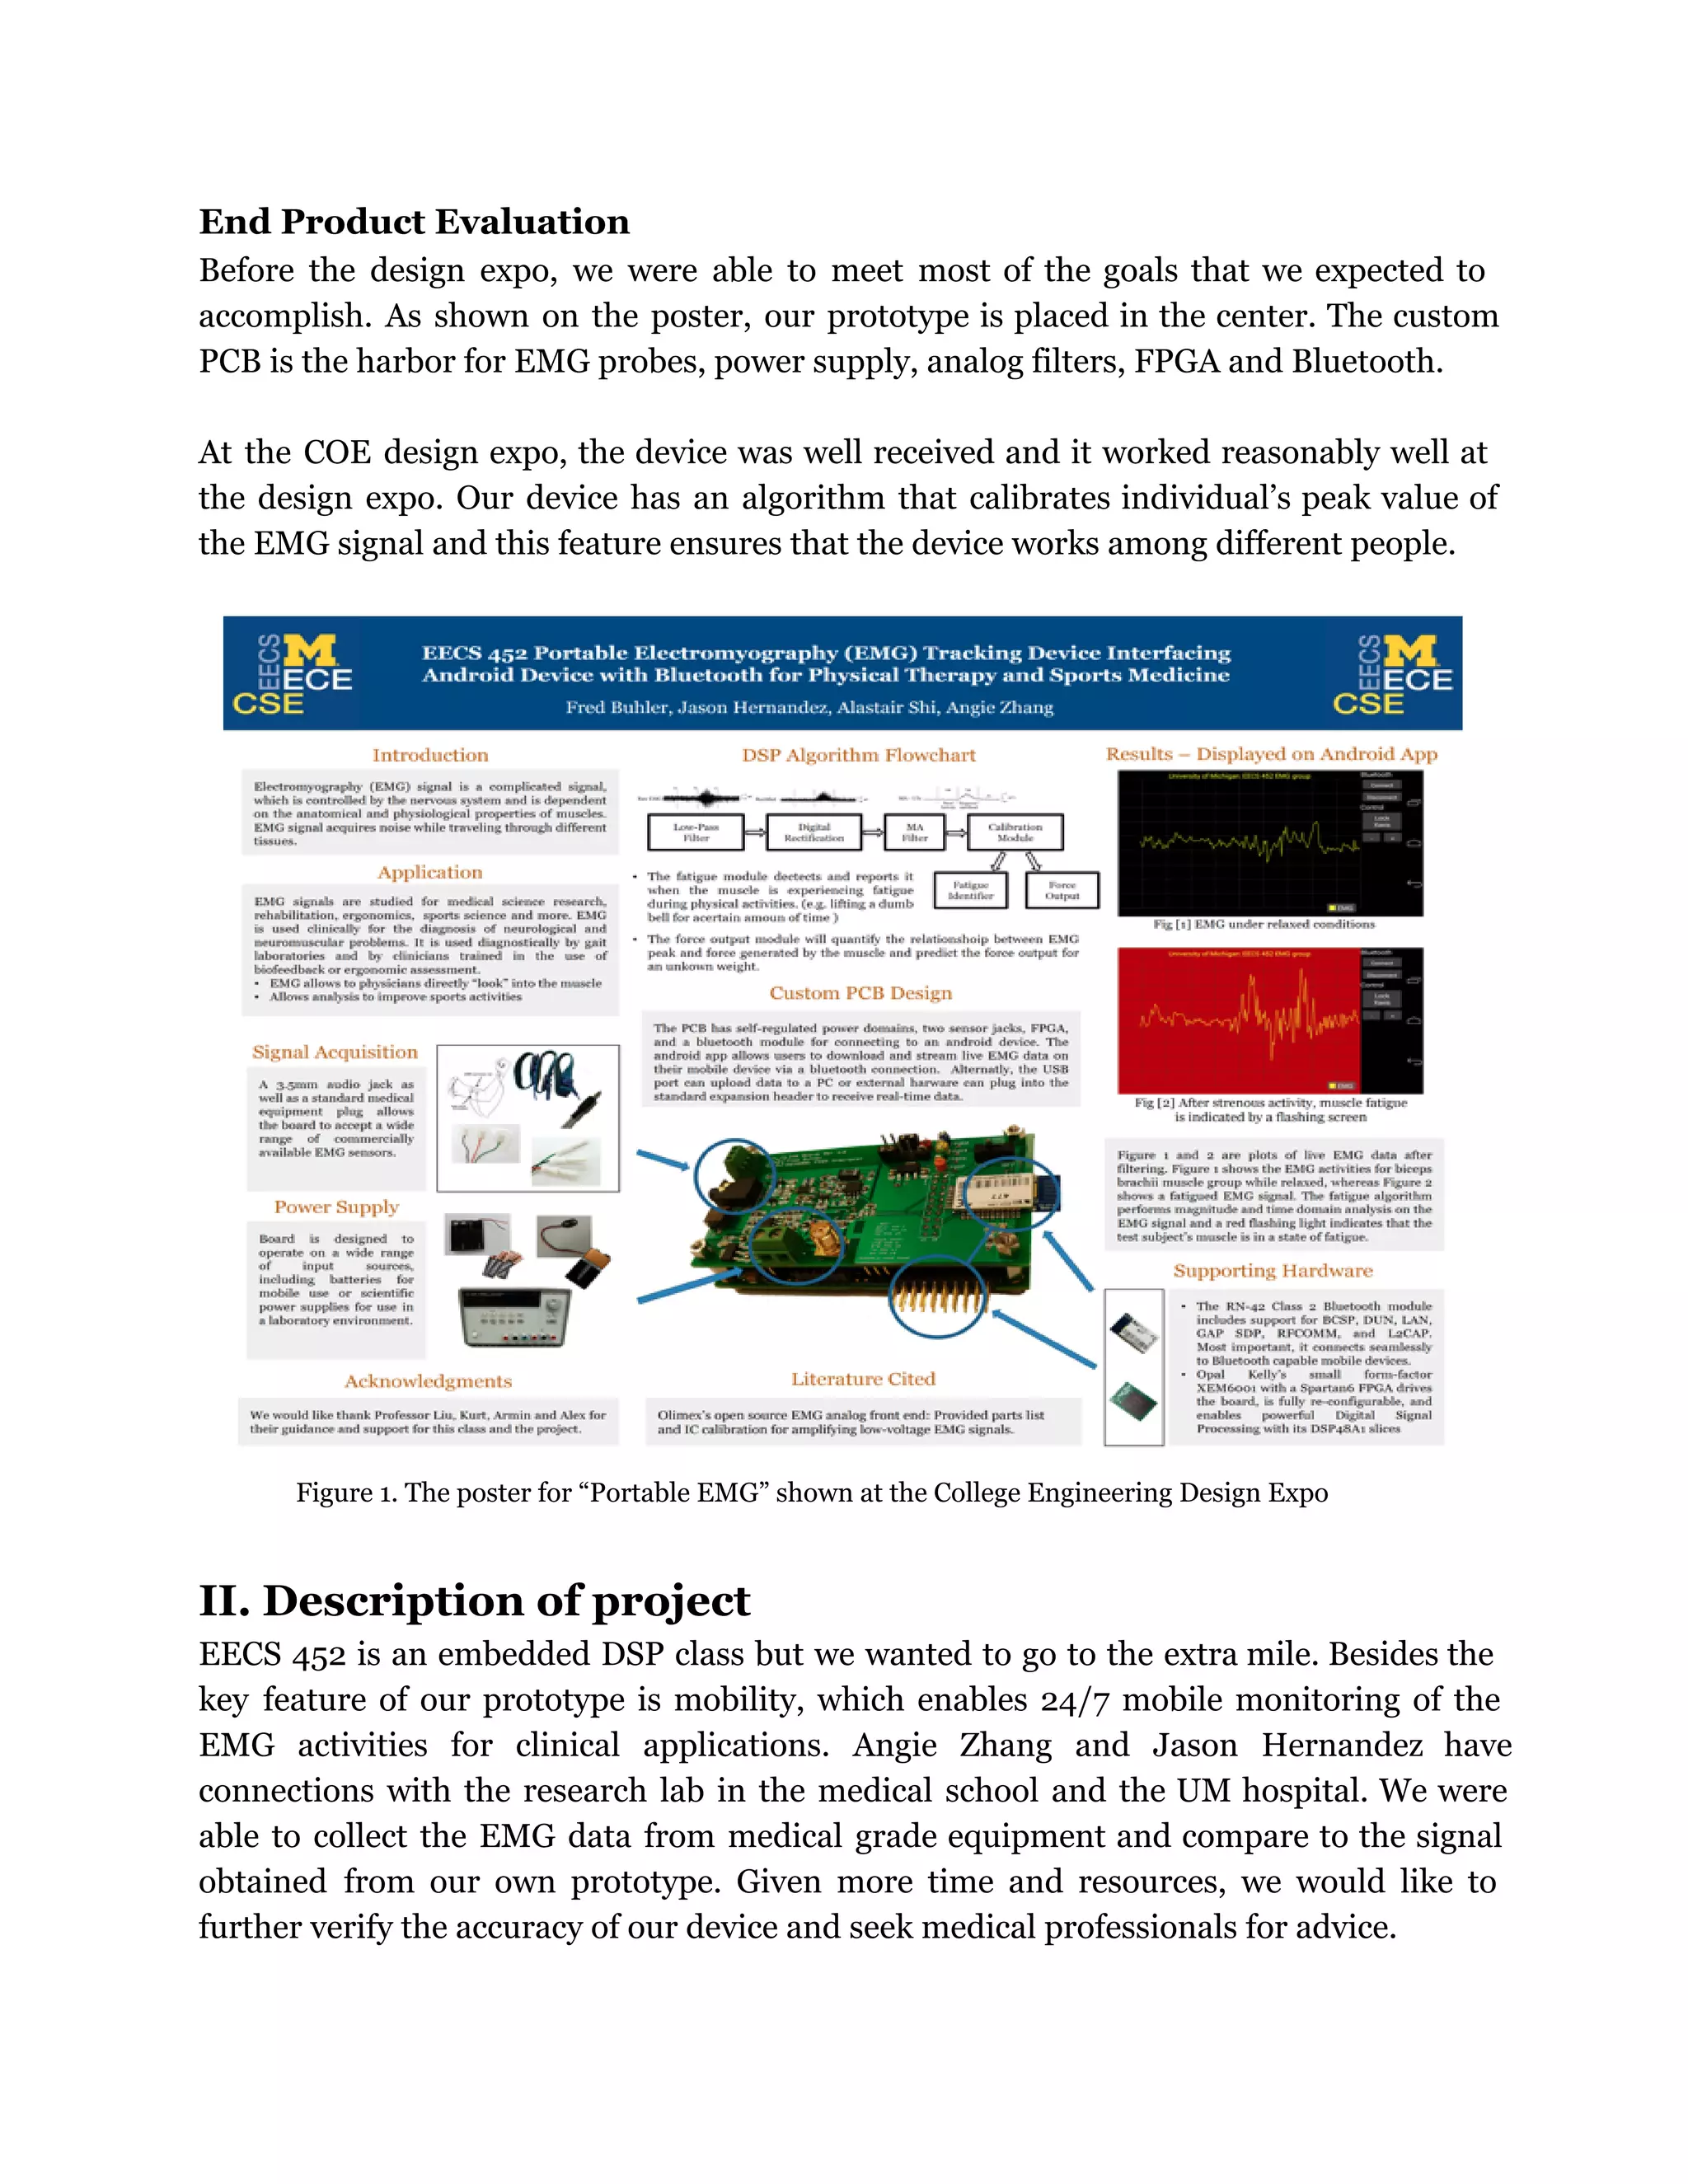
Force Output Module
Figure 10. Shows the results of the force output module (above) after receiving input data from the
MA filter (below). The calibration coefficients are circled in red, the current fatigue it in yellow, and
the force output is in blue. Note the correlation between the peaks, troughs, and force output value.
This data was acquired while lifting and then lowering a 10 lb weight.](https://image.slidesharecdn.com/d1938a17-05c2-443a-a375-e2796b60e675-151204194305-lva1-app6892/75/EECS452EMGFinalProjectReportPDF-11-2048.jpg)

![V. Team Member Contribution
Fred Buhler (Senior in Electrical Engineering)
1) Designed PCB
2) Wrote FPGA-PC interface
3) Wrote several hardware communication modules to interface FPGA with external
components
4) Wrote Android Application
5) Assisted in writing test code as well as writing code generation scripts in Matlab
Jason Hernandez (Senior in Electrical Engineering and computer Engineering)
1) Initial and subsequent research on fatigue presence and force output
2) Tested preliminary algorithms in Matlab before hardware implementation
3) Transcribed fatigue identifier and force output into verilog from Matlab test code
4) Wrote and executed testbenches to simulate algorithms under various conditions
5) Designed early version of calibration module and median frequency calculator
Alastair Shi (Senior in Electrical Engineering)
1) EMG Signal Research on fatigue presence and force output
2) EMG Signal Processing Implementation (HDL) - all filters and fatigue module
3) Wrote and executed testbenches to simulate algorithms under various conditions
4) Guinea pig - lab test subject
Angie Zhang (Senior in Electrical Engineering)
1) Proposed the original idea and researched potential commercial value of the project
2) Worked closely with team members on the concept and development calibration
module, fatigue identifier and force output in both MATLAB and FPGA;
3) Learned to use ISIM, VHDL and helped convert Verilog code into VHDL
4) Collected data and tested the algorithms;
5) Poster design and final report
VI. References and citations
[1]
http://www.pt.ntu.edu.tw/hmchai/Biomechanics/BMmeasure/MuscleStrengthMeasure
.files/EMGwithFatigue.png
[2]
http://link.springer.com/article/10.1007%2FBF00421697
[3]
http://rsta.royalsocietypublishing.org/content/368/1920/2765.short](https://image.slidesharecdn.com/d1938a17-05c2-443a-a375-e2796b60e675-151204194305-lva1-app6892/75/EECS452EMGFinalProjectReportPDF-15-2048.jpg)