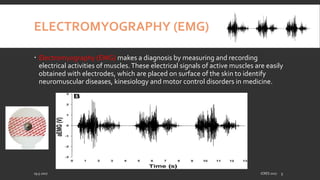
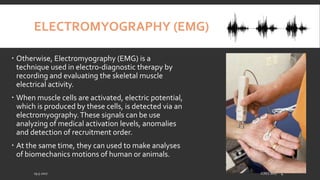
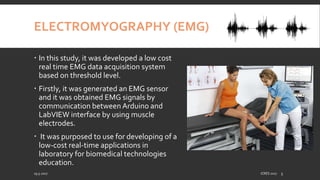
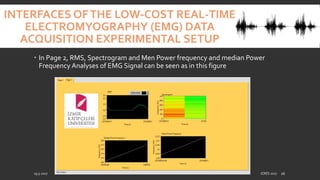
LOW-COST REAL-TIME ELECTROMYOGRAPHY (EMG)
DATA ACQUISITION EXPERIMENTAL SETUP FOR
BIOMEDICAL TECHNOLOGIES EDUCATION
Naciye MULAYIM, Samet ÇIKLAÇANDIR,
Assist. Prof. Fatih Cemal CAN, Assist. Prof. Savaş ŞAHIN
Izmir Katip Celebi University
19.5.2017 ICRES 2017 1
19.5.2017 ICRES 2017 2
• Introduction
• Muscle Sensor / EMG Cırcuıt Desıgnıng
• EMGThresholdıng Algorıthm By Usıng LabVIEW
• Interfaces of the Low-Cost Real-Tıme Electromyography (EMG) Data
Acquısıtıon Experımental Setup
• Conclusion
OVERVIEW
ELECTROMYOGRAPHY (EMG)
 Electromyography (EMG) makes a diagnosis by measuring and recording
electrical activities of muscles.These electrical signals of active muscles are easily
obtained with electrodes, which are placed on surface of the skin to identify
neuromuscular diseases, kinesiology and motor control disorders in medicine.
19.5.2017 ICRES 2017 3
ELECTROMYOGRAPHY (EMG)
 Otherwise, Electromyography (EMG) is a
technique used in electro-diagnostic therapy by
recording and evaluating the skeletal muscle
electrical activity.
 When muscle cells are activated, electric potential,
which is produced by these cells, is detected via an
electromyography.These signals can be use
analyzing of medical activation levels, anomalies
and detection of recruitment order.
 At the same time, they can used to make analyses
of biomechanics motions of human or animals.
19.5.2017 ICRES 2017 4
ELECTROMYOGRAPHY (EMG)
 In this study, it was developed a low cost
real time EMG data acquisition system
based on threshold level.
 Firstly, it was generated an EMG sensor
and it was obtained EMG signals by
communication between Arduino and
LabVIEW interface by using muscle
electrodes.
 It was purposed to use for developing of a
low-cost real-time applications in
laboratory for biomedical technologies
education.
19.5.2017 ICRES 2017 5
MUSCLE SENSOR / EMG
CIRCUIT DESIGNING
 In designing of EMG sensor, it is exploited from the cite which is
http://www.instructables.com/id/Muscle-EMG-Sensor-for-a-
Microcontroller/
but it is used INA 122 instead of INA106 because it is obtained good
results from «Application Of INA122 AmplifierTo Measure of
EmgSignals, Ada ANDRYNOWSKA, Tomasz KLEKIEL, Aktualne
Problemy Biomechaniki, nr 5/2011 «
and the signal was boosted 7 times by using resistors.
19.5.2017 ICRES 2017 6
MUSCLE SENSOR / EMG CIRCUIT
DESIGNING
EMG Circuit / Muscle Sensor, INA122 and TL072 pin
configurations.
19.5.2017 ICRES 2017 7
MUSCLE SENSOR / EMG CIRCUIT
DESIGNING
 As Circuit Chips, three TL072 IC Chip and one INA122 IC Chip were used and, as Cables and as
Electrodes, one EMG Cables (set of 3) and three EMG Electrodes were used. As Capacitors, two 1.0
uF Tant, one 0.01 uF Ceramic Disc and one1.0 uF Ceramic Disc were used and as Resistors three 150
kOhm (1%), two 1 MOhm (1%), two 80.6 kOhm (1%), six 10 kOhm(1%), three100 kOhm Trimmer
and one 1 kOhm (1%) were used. As Misc, two 1N4148 Diode, some Jumper wires, three Alligator
clip cables were used.
EMG circuit design
19.5.2017 ICRES 2017 8
EMGTHRESHOLDING ALGORITHM
BY USING LABVIEW
 In this system, it is needed a +9V and a -9V
power supplies.
 If it is connected two 9V batteries as series, it
is gotten a +18V power supply.To obtain -9V,
battery1’s positive terminal is connected to
battery2’s negative terminal and it is chosen
ground or reference point.Thus it is obtained
+9V as positive terminal of battery 2 and -9V
as negative terminal of battery 1 as seen in
19.5.2017 ICRES 2017 9
EMGTHRESHOLDING ALGORITHM
BY USING LABVIEW
 It was used VISA in NI LabVIEW programming for taking of EMG raw signal. The figure,
showsVISA code.
 This block diagram displays real EMG signal and it is fed into with low pass filter as what
is wanted in the EMG acquation system. Obtaining sample data with providing 200
sampling frequency is important in this step.
This signal bases on FFT and FFT is a
system makes spectral measurements
which include the power spectrum,
averaged magnitude spectrum and
phase spectrum.
At the same time, it is needed high pass
filter which has equi-ripple
characteristics for obtaining this signal.
19.5.2017 ICRES 2017 10
EMGTHRESHOLDING ALGORITHM
BY USING LABVIEW
 In this Figure, it is shown the
wavelet denoise and it is
benefit for reduction of the
noise both in 1D and 2D.
Filtered signal is given by using
Building Waveform and this
signal is used as an input signal
for multiscale peak detection.
In this step, a threshold value
of this filtered EMG signal is
set for EMG thresholding Peak
Level. In this algorithm, initial
value is set 0.001 and it can be
chosen as per needing of
muscle potential.
19.5.2017 ICRES 2017 11
EMGTHRESHOLDING ALGORITHM
BY USING LABVIEW
 Biosignal RMSVI is used to calculate the RMS of EMG signal. EMG Median Power FrequencyVI and
EMG Mean Power FrequencyVI are used to calculate the MDF and MNF.They also provide the
spectrogram of EMG signal, which can be visualized usingTFA Configure Spectrogram IndicatorVI in
LabVIEW Advanced Signal ProcessingToolkit.
19.5.2017 ICRES 2017 12
EMGTHRESHOLDING ALGORITHM
BY USING LABVIEW
 Biosignal RMSVI is used for calculating EMG signal's RMS and, EMG Median Power FrequencyVI and
EMG Mean Power FrequencyVI calculates MNF and MDF.
 Also it can be obtained the spectrogram of EMG signal by usingTFA Configure Spectrogram
IndicatorVI in LabVIEW Advanced Signal ProcessingToolkit.
Phinyomark A.,Thongpanja S., Hu H., Phukpattaranont P., Limsakul C.
2012The Usefulness of Mean and Median Frequencies in Electromyography Analysis,
10.5772/50639
19.5.2017 ICRES 2017 13
INTERFACES OFTHE LOW-COST REAL-TIME
ELECTROMYOGRAPHY (EMG) DATA
ACQUISITION EXPERIMENTAL SETUP
 Interfaces of the system were designed in LabVIEW programming.
 EMG signals is taken via Arduino by making connection between EMG electrodes
and Muscle Sensor andArduino with alligator cables as in these figures .
Low-Cost Real-Time Electromyography (EMG) Data Acquisition Experimental
Setup system working schema19.5.2017 ICRES 2017 14
INTERFACES OFTHE LOW-COST REAL-TIME
ELECTROMYOGRAPHY (EMG) DATA
ACQUISITION EXPERIMENTAL SETUP
 It was usedVISA in NI LabVIEW programming. It is chosen resource name and the
system is started. In Page 1, Filtered Signal, peak plot, sEMG( FFT-Peak) and Raw
EMG Signal are obtained as in seen this figure
19.5.2017 ICRES 2017 15
INTERFACES OFTHE LOW-COST REAL-TIME
ELECTROMYOGRAPHY (EMG) DATA
ACQUISITION EXPERIMENTAL SETUP
 In Page 2, RMS, Spectrogram and Men Power frequency and median Power
Frequency Analyses of EMG Signal can be seen as in this figure
19.5.2017 ICRES 2017 16
INTERFACES OFTHE LOW-COST REAL-
TIME ELECTROMYOGRAPHY (EMG) DATA
ACQUISITION EXPERIMENTAL SETUP
Arduino codes of the data
aquation system
19.5.2017 ICRES 2017 17
CONCLUSION
 In this study it is designed Low-Cost Real-Time Electromyography (EMG) Data
Acquisition Experimental Setup for biomedical technologies department.
 It can be used by the biomedical engineering students to understand of EMG
signal analysis and obtained data can be used favor for different studies and
analysis. It is hoped that this system can be benefit for student who makes
investigation in this area.
19.5.2017 ICRES 2017 18
19.5.2017 ICRES 2017 19

Electromyography (EMG)

  • 1.
    LOW-COST REAL-TIME ELECTROMYOGRAPHY(EMG) DATA ACQUISITION EXPERIMENTAL SETUP FOR BIOMEDICAL TECHNOLOGIES EDUCATION Naciye MULAYIM, Samet ÇIKLAÇANDIR, Assist. Prof. Fatih Cemal CAN, Assist. Prof. Savaş ŞAHIN Izmir Katip Celebi University 19.5.2017 ICRES 2017 1
  • 2.
    19.5.2017 ICRES 20172 • Introduction • Muscle Sensor / EMG Cırcuıt Desıgnıng • EMGThresholdıng Algorıthm By Usıng LabVIEW • Interfaces of the Low-Cost Real-Tıme Electromyography (EMG) Data Acquısıtıon Experımental Setup • Conclusion OVERVIEW
  • 3.
    ELECTROMYOGRAPHY (EMG)  Electromyography(EMG) makes a diagnosis by measuring and recording electrical activities of muscles.These electrical signals of active muscles are easily obtained with electrodes, which are placed on surface of the skin to identify neuromuscular diseases, kinesiology and motor control disorders in medicine. 19.5.2017 ICRES 2017 3
  • 4.
    ELECTROMYOGRAPHY (EMG)  Otherwise,Electromyography (EMG) is a technique used in electro-diagnostic therapy by recording and evaluating the skeletal muscle electrical activity.  When muscle cells are activated, electric potential, which is produced by these cells, is detected via an electromyography.These signals can be use analyzing of medical activation levels, anomalies and detection of recruitment order.  At the same time, they can used to make analyses of biomechanics motions of human or animals. 19.5.2017 ICRES 2017 4
  • 5.
    ELECTROMYOGRAPHY (EMG)  Inthis study, it was developed a low cost real time EMG data acquisition system based on threshold level.  Firstly, it was generated an EMG sensor and it was obtained EMG signals by communication between Arduino and LabVIEW interface by using muscle electrodes.  It was purposed to use for developing of a low-cost real-time applications in laboratory for biomedical technologies education. 19.5.2017 ICRES 2017 5
  • 6.
    MUSCLE SENSOR /EMG CIRCUIT DESIGNING  In designing of EMG sensor, it is exploited from the cite which is http://www.instructables.com/id/Muscle-EMG-Sensor-for-a- Microcontroller/ but it is used INA 122 instead of INA106 because it is obtained good results from «Application Of INA122 AmplifierTo Measure of EmgSignals, Ada ANDRYNOWSKA, Tomasz KLEKIEL, Aktualne Problemy Biomechaniki, nr 5/2011 « and the signal was boosted 7 times by using resistors. 19.5.2017 ICRES 2017 6
  • 7.
    MUSCLE SENSOR /EMG CIRCUIT DESIGNING EMG Circuit / Muscle Sensor, INA122 and TL072 pin configurations. 19.5.2017 ICRES 2017 7
  • 8.
    MUSCLE SENSOR /EMG CIRCUIT DESIGNING  As Circuit Chips, three TL072 IC Chip and one INA122 IC Chip were used and, as Cables and as Electrodes, one EMG Cables (set of 3) and three EMG Electrodes were used. As Capacitors, two 1.0 uF Tant, one 0.01 uF Ceramic Disc and one1.0 uF Ceramic Disc were used and as Resistors three 150 kOhm (1%), two 1 MOhm (1%), two 80.6 kOhm (1%), six 10 kOhm(1%), three100 kOhm Trimmer and one 1 kOhm (1%) were used. As Misc, two 1N4148 Diode, some Jumper wires, three Alligator clip cables were used. EMG circuit design 19.5.2017 ICRES 2017 8
  • 9.
    EMGTHRESHOLDING ALGORITHM BY USINGLABVIEW  In this system, it is needed a +9V and a -9V power supplies.  If it is connected two 9V batteries as series, it is gotten a +18V power supply.To obtain -9V, battery1’s positive terminal is connected to battery2’s negative terminal and it is chosen ground or reference point.Thus it is obtained +9V as positive terminal of battery 2 and -9V as negative terminal of battery 1 as seen in 19.5.2017 ICRES 2017 9
  • 10.
    EMGTHRESHOLDING ALGORITHM BY USINGLABVIEW  It was used VISA in NI LabVIEW programming for taking of EMG raw signal. The figure, showsVISA code.  This block diagram displays real EMG signal and it is fed into with low pass filter as what is wanted in the EMG acquation system. Obtaining sample data with providing 200 sampling frequency is important in this step. This signal bases on FFT and FFT is a system makes spectral measurements which include the power spectrum, averaged magnitude spectrum and phase spectrum. At the same time, it is needed high pass filter which has equi-ripple characteristics for obtaining this signal. 19.5.2017 ICRES 2017 10
  • 11.
    EMGTHRESHOLDING ALGORITHM BY USINGLABVIEW  In this Figure, it is shown the wavelet denoise and it is benefit for reduction of the noise both in 1D and 2D. Filtered signal is given by using Building Waveform and this signal is used as an input signal for multiscale peak detection. In this step, a threshold value of this filtered EMG signal is set for EMG thresholding Peak Level. In this algorithm, initial value is set 0.001 and it can be chosen as per needing of muscle potential. 19.5.2017 ICRES 2017 11
  • 12.
    EMGTHRESHOLDING ALGORITHM BY USINGLABVIEW  Biosignal RMSVI is used to calculate the RMS of EMG signal. EMG Median Power FrequencyVI and EMG Mean Power FrequencyVI are used to calculate the MDF and MNF.They also provide the spectrogram of EMG signal, which can be visualized usingTFA Configure Spectrogram IndicatorVI in LabVIEW Advanced Signal ProcessingToolkit. 19.5.2017 ICRES 2017 12
  • 13.
    EMGTHRESHOLDING ALGORITHM BY USINGLABVIEW  Biosignal RMSVI is used for calculating EMG signal's RMS and, EMG Median Power FrequencyVI and EMG Mean Power FrequencyVI calculates MNF and MDF.  Also it can be obtained the spectrogram of EMG signal by usingTFA Configure Spectrogram IndicatorVI in LabVIEW Advanced Signal ProcessingToolkit. Phinyomark A.,Thongpanja S., Hu H., Phukpattaranont P., Limsakul C. 2012The Usefulness of Mean and Median Frequencies in Electromyography Analysis, 10.5772/50639 19.5.2017 ICRES 2017 13
  • 14.
    INTERFACES OFTHE LOW-COSTREAL-TIME ELECTROMYOGRAPHY (EMG) DATA ACQUISITION EXPERIMENTAL SETUP  Interfaces of the system were designed in LabVIEW programming.  EMG signals is taken via Arduino by making connection between EMG electrodes and Muscle Sensor andArduino with alligator cables as in these figures . Low-Cost Real-Time Electromyography (EMG) Data Acquisition Experimental Setup system working schema19.5.2017 ICRES 2017 14
  • 15.
    INTERFACES OFTHE LOW-COSTREAL-TIME ELECTROMYOGRAPHY (EMG) DATA ACQUISITION EXPERIMENTAL SETUP  It was usedVISA in NI LabVIEW programming. It is chosen resource name and the system is started. In Page 1, Filtered Signal, peak plot, sEMG( FFT-Peak) and Raw EMG Signal are obtained as in seen this figure 19.5.2017 ICRES 2017 15
  • 16.
    INTERFACES OFTHE LOW-COSTREAL-TIME ELECTROMYOGRAPHY (EMG) DATA ACQUISITION EXPERIMENTAL SETUP  In Page 2, RMS, Spectrogram and Men Power frequency and median Power Frequency Analyses of EMG Signal can be seen as in this figure 19.5.2017 ICRES 2017 16
  • 17.
    INTERFACES OFTHE LOW-COSTREAL- TIME ELECTROMYOGRAPHY (EMG) DATA ACQUISITION EXPERIMENTAL SETUP Arduino codes of the data aquation system 19.5.2017 ICRES 2017 17
  • 18.
    CONCLUSION  In thisstudy it is designed Low-Cost Real-Time Electromyography (EMG) Data Acquisition Experimental Setup for biomedical technologies department.  It can be used by the biomedical engineering students to understand of EMG signal analysis and obtained data can be used favor for different studies and analysis. It is hoped that this system can be benefit for student who makes investigation in this area. 19.5.2017 ICRES 2017 18
  • 19.