Downloaded 28 times
![INTERNATIONAL JOURNAL FOR TRENDS IN ENGINEERING & TECHNOLOGY
VOLUME 3 ISSUE 2 – FEBRUARY 2015 – ISSN: 2349 – 9303
68
IJTET©2015
Classification of EEG Signal for Epileptic Seizure
DetectionusingEMD and ELM
S. Divya S. Suja Priyadharsini
ECE Department ECE Department
Regional Centre: Anna University, Tirunelveli Regional Centre:Anna University, Tirunelveli
divya8jads@gmail.com Sujapriya_moni@yahoo.co.in
Abstract—This paper proposes the classification of EEG signal for epilepsy diagnosis. Epilepsy is a neurological
disorder which occurs due to synchronous neuronal activity in brain. Empirical Mode Decomposition (EMD), Extreme
Learning Machine (ELM) are the techniquedelivered in the proposed method.Input EEG signal, which is available in
online as Bonn Database is decomposed into five Intrinsic Mode Functions (IMFs) using EMD.Higher Order Statistical
moments such as Variance, Skewness and Kurtosis are drawn out as features from the decomposed signals. Extreme
Learning Machine is used as a classifier to classify the EEG signals with the taken features, under various categories that
include healthy and ictal, interictal and ictal, Non seizure and seizure, healthy, interictal and ictal. The proposed method
gives 100%accuracy, 100%sensitivity in discriminating interictal and ictal, non seizure and seizure, healthy and ictal,
healthy, interictal and ictal, 100% specificity in classifying healthy and ictal, interictal and ictal and 100% and
99%accuracy in case of discriminating interictal and ictal, non seizure and seizure.
Index Terms—Electroencephalogram(EEG), Empirical Mode Decomposition (EMD), Extreme Learning Machine
(ELM), Feature Extraction, seizure detection.
—————————— ——————————
1 INTRODUCTION
Epilepsy is a disorder which happens due to unusual
dischargesin brain.The intense electrical activity causes
a temporary disruption to normal brain making the
brain’s messages get mixed up. This results in recurrent
seizures. About60 million people are suffered with
epilepsy in the world. Epileptic seizures fall into two
types namely Partial seizures and Generalized seizures.
Partial seizures impact only a portion of the brain which
leads to temporal paralysis and generalized seizures
involve electrical discharges that occur all over the brain
which cause loss of consciousness.
Electroencephalogram (EEG), being a non-
invasive tool evaluates the patient with epilepsy. It
examines the brain patterns and assists in epilepsy
diagnosis, if any unusual activity takes place in the
brain. Extracranial EEG measurements are obtained by
keeping electrodes on the scalp whereas Intracranial
EEG (iEEG) recordings are examined by keeping
electrodes on the cortex of the brain or deep within the
structure of the brain. For a normal brain activity, the
firing of neuron occurs about 80 times per second and
neurons fires about 500 times per second for an epileptic
brain activity.
Various approaches have been integrated for
the seizure detection. Shafiul Alam et al. proposed
seizure detection using Artificial Neural Network
(ANN).Empirical Mode Decomposition is used for
decomposition purpose [1].Shufang Li et al. used EMD
to extract coefficient of variation and fluctuation index
as features. Support Vector Machine (SVM) classifier is
utilized for the classification of interictal and ictal
subjects [2].Complexity based features are taken using
Wavelet Transform and the features are selected using
Genetic Algorithm. Extreme Learning Machine is used
as the classifier for recognizing the epileptic activities.
The method proposed by Yuedong Song et al. gives less
accuracy without the use of Genetic Algorithm
[3].Bandwidth features namely Amplitude Modulation
Bandwidth and Frequency Modulation Bandwidth is
computed using EMD techniques and these features
were fed to the Least Square Support Vector Machine
(LS-SVM) for classification purpose [4].Nandish et al.
used Average method and Max-Min method for taking
the features. Among the two methods Max-min with
Neural Network gave better accuracy[6].Fuzzy classifier
could able to discriminate healthy, interictal and ictal
subjects with good accuracy by the usage of entropy
features [7].Multiwavelet Transform along with ANN
technique had been used by Ling Guo et al. Entropy
based features are extracted for classifying healthy and
epileptic subjects. Computation cost increases due to the
excessive number of features [11]. EEG signal is
analysed with time-frequency methods and Artificial](https://image.slidesharecdn.com/icicce0385-150502060652-conversion-gate02/85/Classification-of-EEG-Signal-for-Epileptic-Seizure-DetectionusingEMD-and-ELM-1-320.jpg)
![INTERNATIONAL JOURNAL FOR TRENDS IN ENGINEERING & TECHNOLOGY
VOLUME 3 ISSUE 2 – FEBRUARY 2015 – ISSN: 2349 – 9303
68
IJTET©2015
Classification of EEG Signal for Epileptic Seizure
DetectionusingEMD and ELM
S. Divya S. Suja Priyadharsini
ECE Department ECE Department
Regional Centre: Anna University, Tirunelveli Regional Centre:Anna University, Tirunelveli
divya8jads@gmail.com Sujapriya_moni@yahoo.co.in
Abstract—This paper proposes the classification of EEG signal for epilepsy diagnosis. Epilepsy is a neurological
disorder which occurs due to synchronous neuronal activity in brain. Empirical Mode Decomposition (EMD), Extreme
Learning Machine (ELM) are the techniquedelivered in the proposed method.Input EEG signal, which is available in
online as Bonn Database is decomposed into five Intrinsic Mode Functions (IMFs) using EMD.Higher Order Statistical
moments such as Variance, Skewness and Kurtosis are drawn out as features from the decomposed signals. Extreme
Learning Machine is used as a classifier to classify the EEG signals with the taken features, under various categories that
include healthy and ictal, interictal and ictal, Non seizure and seizure, healthy, interictal and ictal. The proposed method
gives 100%accuracy, 100%sensitivity in discriminating interictal and ictal, non seizure and seizure, healthy and ictal,
healthy, interictal and ictal, 100% specificity in classifying healthy and ictal, interictal and ictal and 100% and
99%accuracy in case of discriminating interictal and ictal, non seizure and seizure.
Index Terms—Electroencephalogram(EEG), Empirical Mode Decomposition (EMD), Extreme Learning Machine
(ELM), Feature Extraction, seizure detection.
—————————— ——————————
1 INTRODUCTION
Epilepsy is a disorder which happens due to unusual
dischargesin brain.The intense electrical activity causes
a temporary disruption to normal brain making the
brain’s messages get mixed up. This results in recurrent
seizures. About60 million people are suffered with
epilepsy in the world. Epileptic seizures fall into two
types namely Partial seizures and Generalized seizures.
Partial seizures impact only a portion of the brain which
leads to temporal paralysis and generalized seizures
involve electrical discharges that occur all over the brain
which cause loss of consciousness.
Electroencephalogram (EEG), being a non-
invasive tool evaluates the patient with epilepsy. It
examines the brain patterns and assists in epilepsy
diagnosis, if any unusual activity takes place in the
brain. Extracranial EEG measurements are obtained by
keeping electrodes on the scalp whereas Intracranial
EEG (iEEG) recordings are examined by keeping
electrodes on the cortex of the brain or deep within the
structure of the brain. For a normal brain activity, the
firing of neuron occurs about 80 times per second and
neurons fires about 500 times per second for an epileptic
brain activity.
Various approaches have been integrated for
the seizure detection. Shafiul Alam et al. proposed
seizure detection using Artificial Neural Network
(ANN).Empirical Mode Decomposition is used for
decomposition purpose [1].Shufang Li et al. used EMD
to extract coefficient of variation and fluctuation index
as features. Support Vector Machine (SVM) classifier is
utilized for the classification of interictal and ictal
subjects [2].Complexity based features are taken using
Wavelet Transform and the features are selected using
Genetic Algorithm. Extreme Learning Machine is used
as the classifier for recognizing the epileptic activities.
The method proposed by Yuedong Song et al. gives less
accuracy without the use of Genetic Algorithm
[3].Bandwidth features namely Amplitude Modulation
Bandwidth and Frequency Modulation Bandwidth is
computed using EMD techniques and these features
were fed to the Least Square Support Vector Machine
(LS-SVM) for classification purpose [4].Nandish et al.
used Average method and Max-Min method for taking
the features. Among the two methods Max-min with
Neural Network gave better accuracy[6].Fuzzy classifier
could able to discriminate healthy, interictal and ictal
subjects with good accuracy by the usage of entropy
features [7].Multiwavelet Transform along with ANN
technique had been used by Ling Guo et al. Entropy
based features are extracted for classifying healthy and
epileptic subjects. Computation cost increases due to the
excessive number of features [11]. EEG signal is
analysed with time-frequency methods and Artificial](https://image.slidesharecdn.com/icicce0385-150502060652-conversion-gate02/75/Classification-of-EEG-Signal-for-Epileptic-Seizure-DetectionusingEMD-and-ELM-1-2048.jpg)
![INTERNATIONAL JOURNAL FOR TRENDS IN ENGINEERING & TECHNOLOGY
VOLUME 3 ISSUE 2 – FEBRUARY 2015 – ISSN: 2349 – 9303
69
IJTET©2015
Neural Network (ANN)[16].Usage of ANN makes high
computational complexity and takes huge training time.
EMD delivered by Huang is widely adaptable
to non-stationary and nonlinear signals.It is used in the
case of reducing noise and providing information. In this
paper, classification of EEG signal for epileptic seizure
detection is done with EMD and ELM. Variance,
Skewness and Kurtosis are taken as features,which
describes the shape of EEG signals. The features are
then trained and tested using ELM classifier to
discriminate healthy, interictal and ictal subjects
underdifferent cases. ELM classifier requires no iterate
tuning and classifies signal with good accuracy.
2 METHODOLOGY
This section has three steps.
i) Decomposition of input signal
ii) Feature Extraction
iii) Classification of EEG signal
2.1 DatabaseDescription
Bonn Database [18] from the Department of
Epileptology is used. The dataset is possessed with five
sets namely Z, O, N, F, S. The dataset Z and O have
EEG recordings that were obtained from healthy
subjects with their eyes opened and closed respectively.
The measurements for the set Z and O were carried out
using extracranial electrodes. The dataset N, F, S have
recordings from epileptic patients. Sets F and N have
EEG measurements that were observed, intracranially
during seizure free interval, from epileptogenic zone and
from hippocampal formation of opposite hemisphere of
the brain. The dataset S has ictal EEG recordings from
the epileptogenic zone. The 100 single channel EEG
signals from each person are recorded in 23.6s with the
sampling rate of 173.6Hz.
2.2 EmpiricalModeDecomposition
An adaptive, nonlinear technique referred as
Empirical Mode Decomposition (EMD) fragments the
nonstationary signal into Amplitude-Frequency
modulated components namely Intrinsic Mode Function
(IMF).
The block diagram of seizure detection using
EMD with ELM is given in Fig.1.The steps involved in
EMD Algorithm is given below
i) Take an input signal s andconsider it to be s=h, n=0
ii) Local maxima and Local minima of input signals are
found
iii) Upper envelope (𝑒 𝑚𝑎𝑥 ) and lower envelope (𝑒 𝑚𝑖𝑛 )
are found by connecting the local maximum and local
minimum respectively, through cubic spline function
iv) Mean of upper envelope and lower envelope are
determined
m=(𝑒 𝑚𝑎𝑥 +𝑒 𝑚𝑖𝑛 )/2 (1)
v) The value of mean should be subtracted from the
input signal
H=h-m (2)
vi)Check whether the stopping criterion(α) lies in the
range 0.2-0.3, in the calculation of standard deviation
given in (3). If the condition is satisfied then take
𝑖𝑚𝑓𝑛 =H, n=n+1 and go to the step vii, elseconsider the
input signal s as H i.e. s=H and repeat the process from i
to vi
sd=
|𝐻−ℎ|2
ℎ2 < α (3)
vii)Calculate residue signal r=h-𝑖𝑚𝑓𝑛 , if r is a function
of monotonicity end the process else consider s=r and
repeat from (i)
Empirical mode decomposition is more
adaptable to nonlinear and nonstationary signals. The
frequency component decreases, as the number of
intrinsic mode function level increases. The information
does not get lost when the frequency decreases. Flow
chart of EMD algorithm is given in Fig.2.
Fig. 2. EMD Algorithm
INPUT
SIGNAL
(BONN
DATA)
DECOMPOSITION
OF FIVE IMFs
USING EMD
FEATURE
EXTRACTION
ELM
CLASSIFIER
OUTPUT
Fig. 1. Block diagram of Seizure detection using EMD- ELM
Take input s=h, n=0
If r is
monotonic
Start
Find local maxima and
local minima
Get upper and lower
envelope through
spline
Find mean (m) of
upper and lower
envelope
H=h-m
Calculate standard
deviation (sd)
𝑖𝑚𝑓𝑛=H, n=n+1, r=h-
𝑖𝑚𝑓𝑛,
If standard
deviation<α
End
s=
h1
s
=
r](https://image.slidesharecdn.com/icicce0385-150502060652-conversion-gate02/85/Classification-of-EEG-Signal-for-Epileptic-Seizure-DetectionusingEMD-and-ELM-2-320.jpg)
![INTERNATIONAL JOURNAL FOR TRENDS IN ENGINEERING & TECHNOLOGY
VOLUME 3 ISSUE 2 – FEBRUARY 2015 – ISSN: 2349 – 9303
73
IJTET©2015
TABLE 1
CLASSIFICATION PERFORMANCE USING SINGLE
IMFs
CLASSIFIERS C-1 C-2 C-3 C-4 C-5
Case I
(Z,O,N,
F),S
Sensitivity 100 100 93.33 93.3 100
Specificity 82.9 97.14 100 94.29 81.86
Accuracy 85.88 97.65 99 94.12 84.52
Case II
Z,S
Sensitivity 93.33 100 93.33 93.33 100
Specificity 100 94.12 100 82.35 70.59
Accuracy 96.88 96.88 96.88 87.50 84.38
Case III
N,S
Sensitivity 100 100 100 100 100
Specificity 100 82.35 88.24 52.94 82.35
Accuracy 100 90.6 93.75 75.00 90.63
Case IV
O,F,S
Sensitivity(O) 97 87.88 81.82 100 100
Specificity(O) 80 47.06 72.22 66.67 48
Accuracy(O) 91.67 74 79 88.24 78.43
Sensitivity(F) 94.44 84.85 61.11 83.33 44.64
Specificity(F) 90 76.47 78.79 78.79 90.91
Accuracy(F) 92.11 82 72 80.39 74.51
Sensitivity(S) 100 100 86.67 86.67 100
Specificity(S) 97.22 82.86 97.22 88.89 50
Accuracy(S) 98.04 88 94 88.24 64.71
Case V
(Z,O),
(N,F),S
Sensitivity(ZO) 88 70 70 80 92
Specificity(ZO) 51.43 60 85.71 35 25
Accuracy(ZO) 73 65 76.19 61.18 63.10
Sensitivity(NF) 84.62 60 57.14 53 40
Specificity(NF) 63 84 90 55.10 76
Accuracy(NF) 73 74.12 76.19 54.12 61.
Sensitivity(S) 80 100 100 100 100
Specificity(S) 95.71 88.57 100 88.73 53.62
Accuracy(S) 93 90.59 100 90.59 62
TABLE 2
CLASSIFICATION PERFORMANCE USING
MULTIPLE IMFs
CLASSIFIER C-6
Case I
(Z,O,N,F),S
Sensitivity 88.71
Specificity 34.71
Accuracy 74.12
Case II
Z,S
Sensitivity 80
Specificity 100
Accuracy 90.63
Case III
N,S
Sensitivity 60
Specificity 52.94
Accuracy 57
Case IV
O,F,S
Sensitivity(O) 61.76
Specificity(O) 39
Accuracy(O) 54
Sensitivity(F) 63.16
Specificity(F) 73
Accuracy(F) 69.23
Sensitivity(S) 20
Specificity(S) 75.68
Accuracy(S) 58
Case V
(Z,O),(N,F),S
Sensitivity(ZO) 82
Specificity(ZO) 88.57
Accuracy(ZO) 84
Sensitivity(NF) 65.71
Specificity(NF) 96
Accuracy(NF) 83.53
Sensitivity(S) 80
Specificity(S) 88.5
Accuracy(S) 87
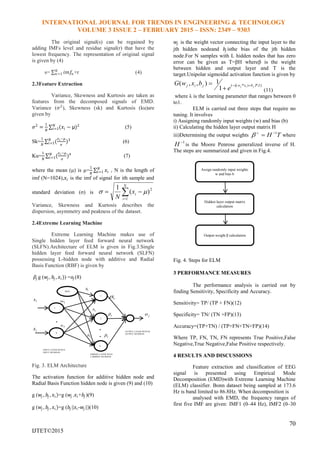
From the Table-I and Table-II, it is expressed that
classification using single IMF gives good performance
when compared to multiple IMF in most of the cases.
Three features are taken when using with single IMF
whereas fifteen features are used when dealing with
multiple IMFs. Thecomputational time gets reduced when
performing with single IMF.
5 CONCLUSION
In this paper, classification of EEG signal for
seizure detection under various cases that includes
healthy and ictal, interictal and ictal, non seizure and
seizure, healthy, interictal an ictal is proposed. EMD is
applied to decompose the input signal into five IMFs.
Higher order statistical features like variance, skewness
and kurtosis are extracted from the decomposed signals
to distinguish healthy, interictal and ictal subjects. The
taken features aretrained and tested using the ELM
classifier. It has been exhibited that the proposed
method shows 100% sensitivity, 100% specificity and
100% accuracy in most of the cases when discriminating
with single IMF rather than multiple IMFs. Future
enhancement can be done by including the case of
classifying the EEG signal into sets Z, O, N, F, and S for
epilepsy detection.
REFERENCES
[1] S.M. Shafiul Alam and M.I.H. Bhuiyan,
―Detection of Seizure and Epilepsy Using Higher
Order Statistics in the EMD Domain‖, IEEE
Journal of Biomedical and Health Informatics,
Vol.17, No.2, pp. 312-318, March 2013.
[2] Shufang Li, Weidong Zhou and Dongmei Cai,
―Feature Extraction and Recognition of Ictal EEG
Using EMD and SVM‖, Computers in Biology and
Medicine, Vol. 43, pp. 807-816,April 2013.
[3] Yuedong Song,Jiaxiang Zhang, ―Automatic
recognition of epileptic EEG patterns via Extreme
Learning Machine and multiresolution feature
extraction‖,Expert Systems with Applications,
vol.40, pp. 5477-5489, 2013.
[4] Varun Bajaj and Ram Bilas Pachori,
―Classification of Seizure and Nonseizure EEG
Signals using Empirical Mode Decomposition‖,
IEEE Transactions on Information Technology in
Biomedicine, Vol.16, No.6, pp. 1135-1142, Nov.
2012.
[5] S. M. Shafiul Alam, M. I. H. Bhuiyan,
Aurangozeb, and Syed TarekShahriar,―EEG Signal
Discrimination using Non-linear Dynamics in the
EMD Domain‖, International Journal of
Computer and Electrical Engineering, Vol.4,
No.3, pp. 326-330, 2012.
[6] M. Nandish, Stafford Michahial, P.
HemanthKumar ,―Feature Extraction and
Classification of EEG Signal Using Neural
Network Based Techniques‖, International
Journal of Engineering and Innovative Technology
(IJEIT), Vol.2,No. 4,Oct.2012.](https://image.slidesharecdn.com/icicce0385-150502060652-conversion-gate02/85/Classification-of-EEG-Signal-for-Epileptic-Seizure-DetectionusingEMD-and-ELM-6-320.jpg)
![INTERNATIONAL JOURNAL FOR TRENDS IN ENGINEERING & TECHNOLOGY
VOLUME 3 ISSUE 2 – FEBRUARY 2015 – ISSN: 2349 – 9303
74
IJTET©2015
[7] U. Rajendra Acharya, Filippo Molinari, S. Vinitha
Sree, Subhagata Chattopadhyay,Kwan-Hoong Ng,
Jasjit S. Surig, ―Automated diagnosis of epileptic
EEG using entropies‖,Biomedical Signal
Processing and Control,Elseveir, vol.7, No. 4,
pp.401– 408,July 2012.
[8] J. Siva Prakash, ―Extreme Learning Machines - A
Review and State-of-the-art‖, International Journal
of Wisdom based Computing, Vol.1, No. 1,
Apr.2011.
[9] Tomasz M. Rutkowski, Danilo P. Mandic,
AndrzejCichocki, Andrzej
W.Przybyszewski,―EMD Approach to
Multichannel EEG Data — The Amplitude and
Phase Components Clustering Analysis‖, Journal
of Circuits, Systems, and Computers, Vol.19, No.1,
pp. 215-229, 2010
[10] Ali Shoeb, John Guttag, ―Application of Machine
Learning To Epileptic Seizure Detection‖,
Appearing in Proceedings of the 27th International
Conference on Machine Learning, Haifa, Israel,
2010.
[11] Ling Guo, Daniel Rivero, Alejandro Pazos,
―Epileptic seizure detection using multiwavelet
transform based approximate entropy and artificial
neural networks‖Journal of Neuroscience
Methods,vol. 193,No. 1,pp.156-63,Oct. 2010.
[12] Guang-Bin Huang,Xiaojian Ding, Hongming
Zhou,―Optimization method based extreme
learning machine for classification‖,
Neurocomputing, Elseveir,Vol.74,No. 1-3, pp.
155-163, Dec. 2010.
[13] Jean-Claude Nunes, Eric Del Echelle, ―Empirical
Mode Decomposition: Applications on Signal
and Image Processing‖, Advances in Data
Analysis, Vol.1, No.1, Jan. 2009.
[14] Alexandros T. Tzallas, Markos G. Tsipouras, and
Dimitrios I. Fotiadis, ―Epileptic Seizure Detection
in EEGs Using Time–Frequency Analysis‖, IEEE
Transactions on Information Technology in
Biomedicine, Vol.13, No.5, pp.703-10,Sep. 2009.
[15] Ram Bilas Pachori, ―Discrimination between Ictal
and Seizure-Free EEG Signals using Empirical
Mode Decomposition‖, Communication Research
Centre, Dec. 2008.
[16] A.T. Tzallas, M. G. Tsipouras,D.I.
Fotiadis,―Automatic Seizure Detection Based on
Time- FrequencyAnalysis and Artificial Neural
Networks‖,Computational Intelligence and
Neuroscience, Dec. 2007,doi:10.1155/2007/80510
[17] PariJahankhani, VassilisKodogiannis and Kenneth
Revett ,―EEG Signal Classification Using Wavelet
Feature Extraction and Neural Networks‖, IEEE
John Vincent Atanasoff 2006 International
Symposium on Modern Computing, pp. 120-124,
Oct. 2006.
[18] Ralph G.Andrzejak, Klaus Lehnertz, Christoph
Rieke, Peter David, Christian E. Elger,
―Indications of nonlinear deterministic and finite-
dimensional structures in time series of brain
electrical activity: Dependence on recording region
and brain state‖, Physical Review E, Vol.64,No.6,
Nov. 2001.](https://image.slidesharecdn.com/icicce0385-150502060652-conversion-gate02/85/Classification-of-EEG-Signal-for-Epileptic-Seizure-DetectionusingEMD-and-ELM-7-320.jpg)

This paper presents a method for classifying EEG signals for epilepsy diagnosis using Empirical Mode Decomposition (EMD) and Extreme Learning Machine (ELM). The study achieved 100% accuracy and sensitivity in distinguishing between various states, including healthy, interictal, and ictal EEG signals, using features extracted from the decomposed signals. The proposed approach demonstrates high efficiency in classifying seizure-related brain activity, leveraging both feature extraction and classification techniques.