Download as PDF, PPTX

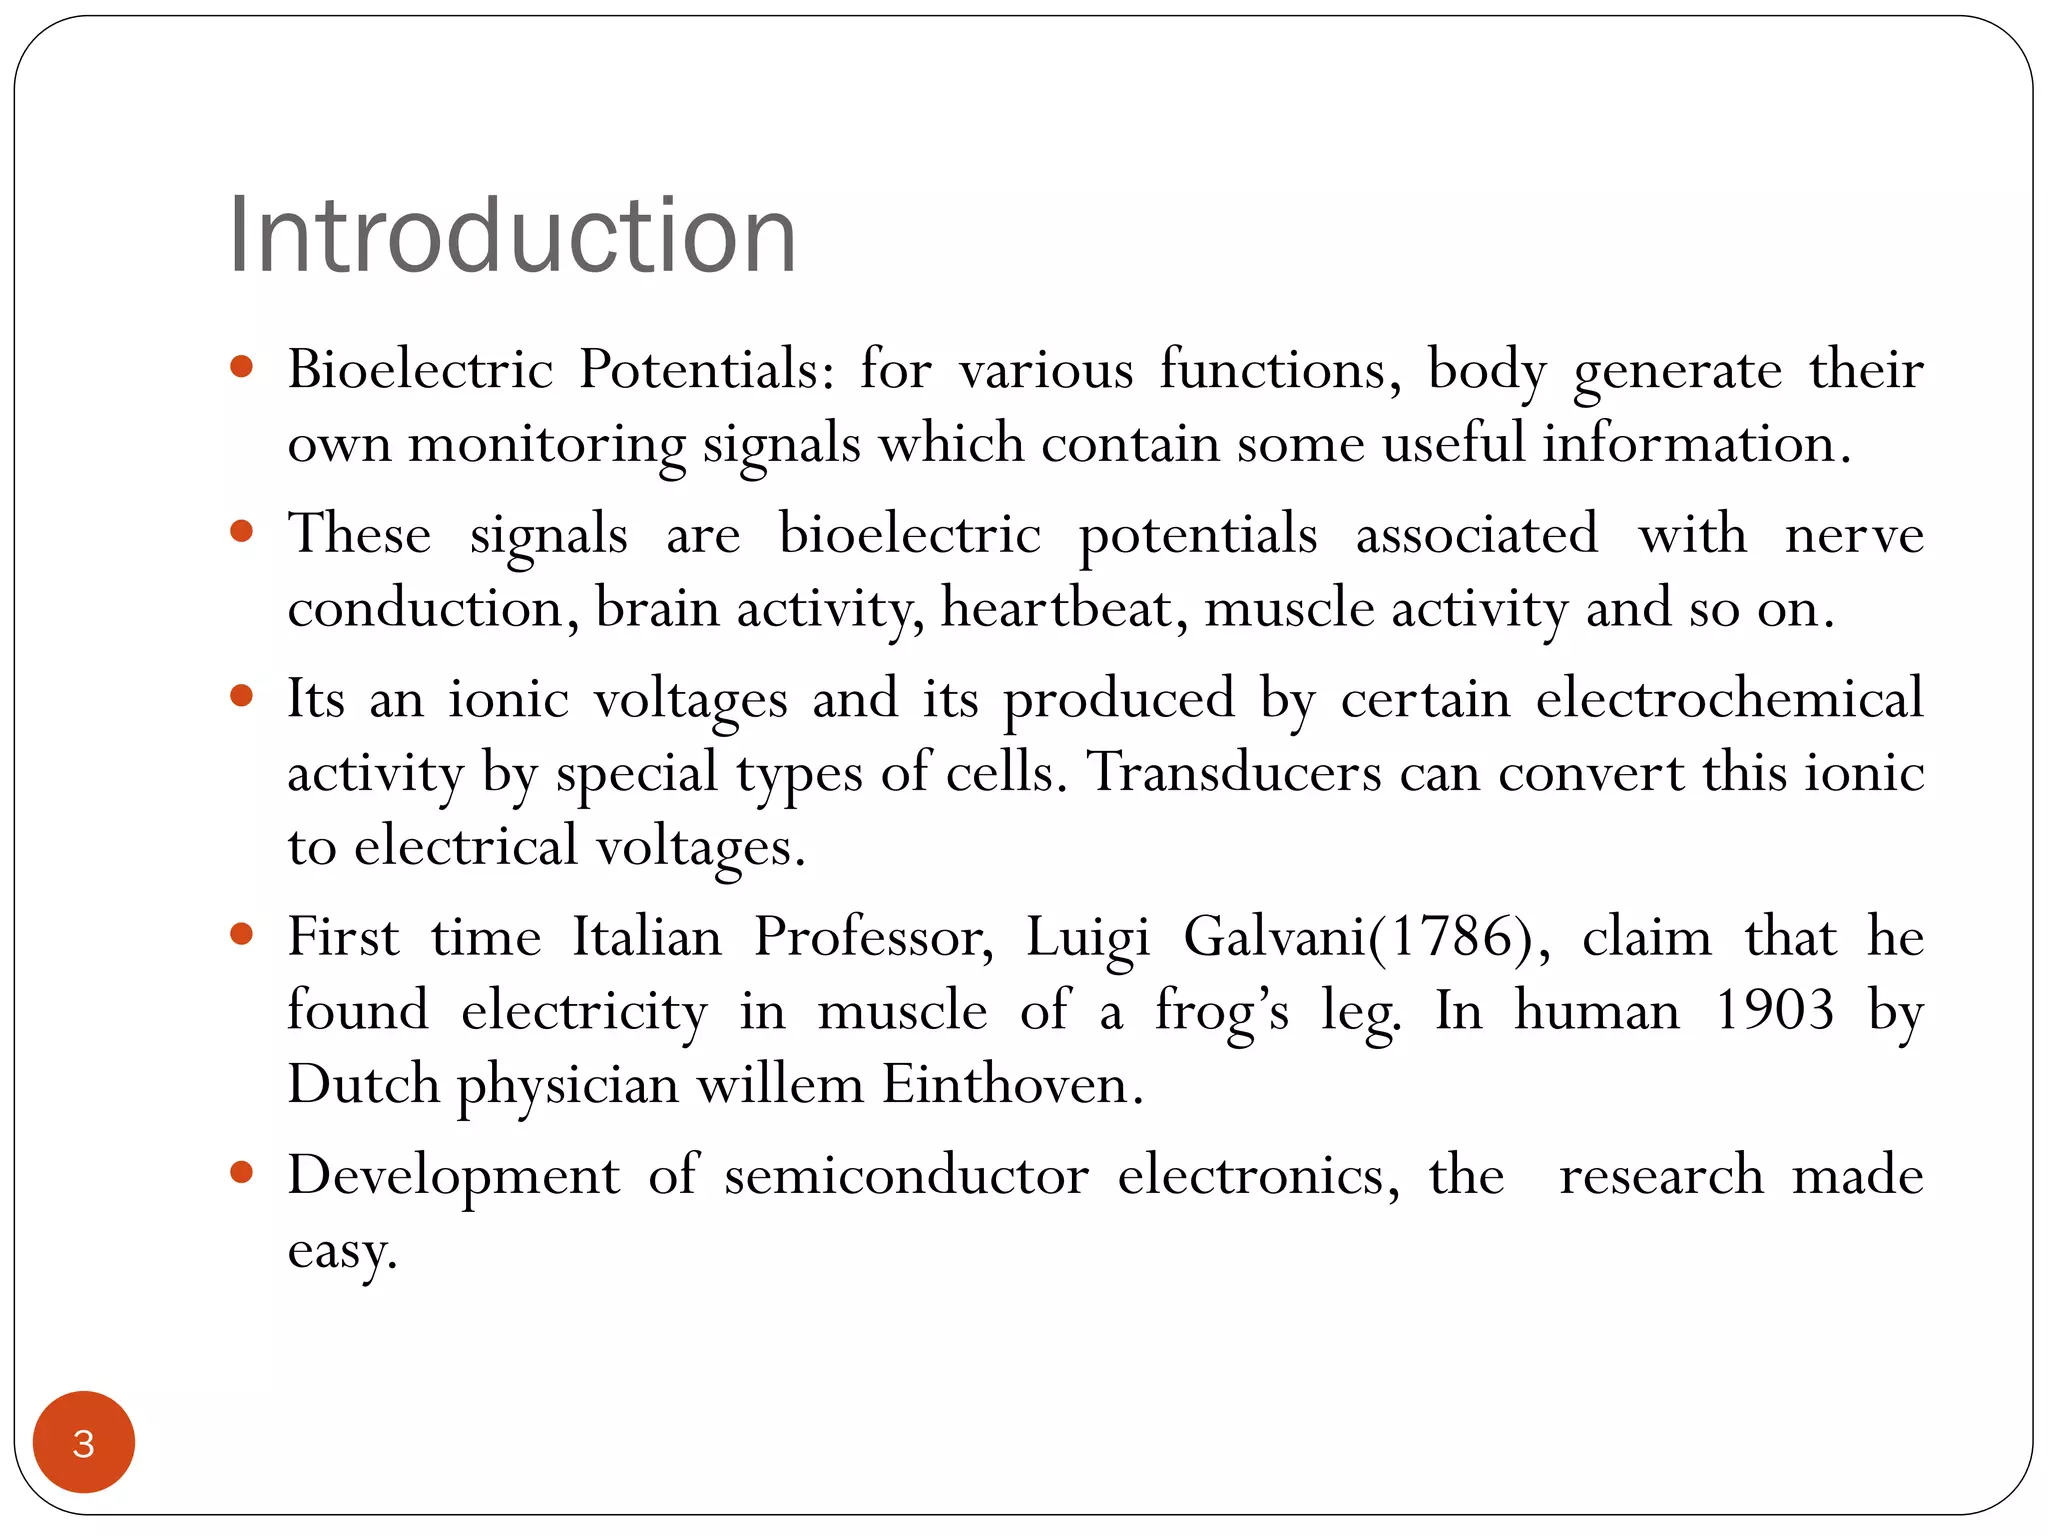
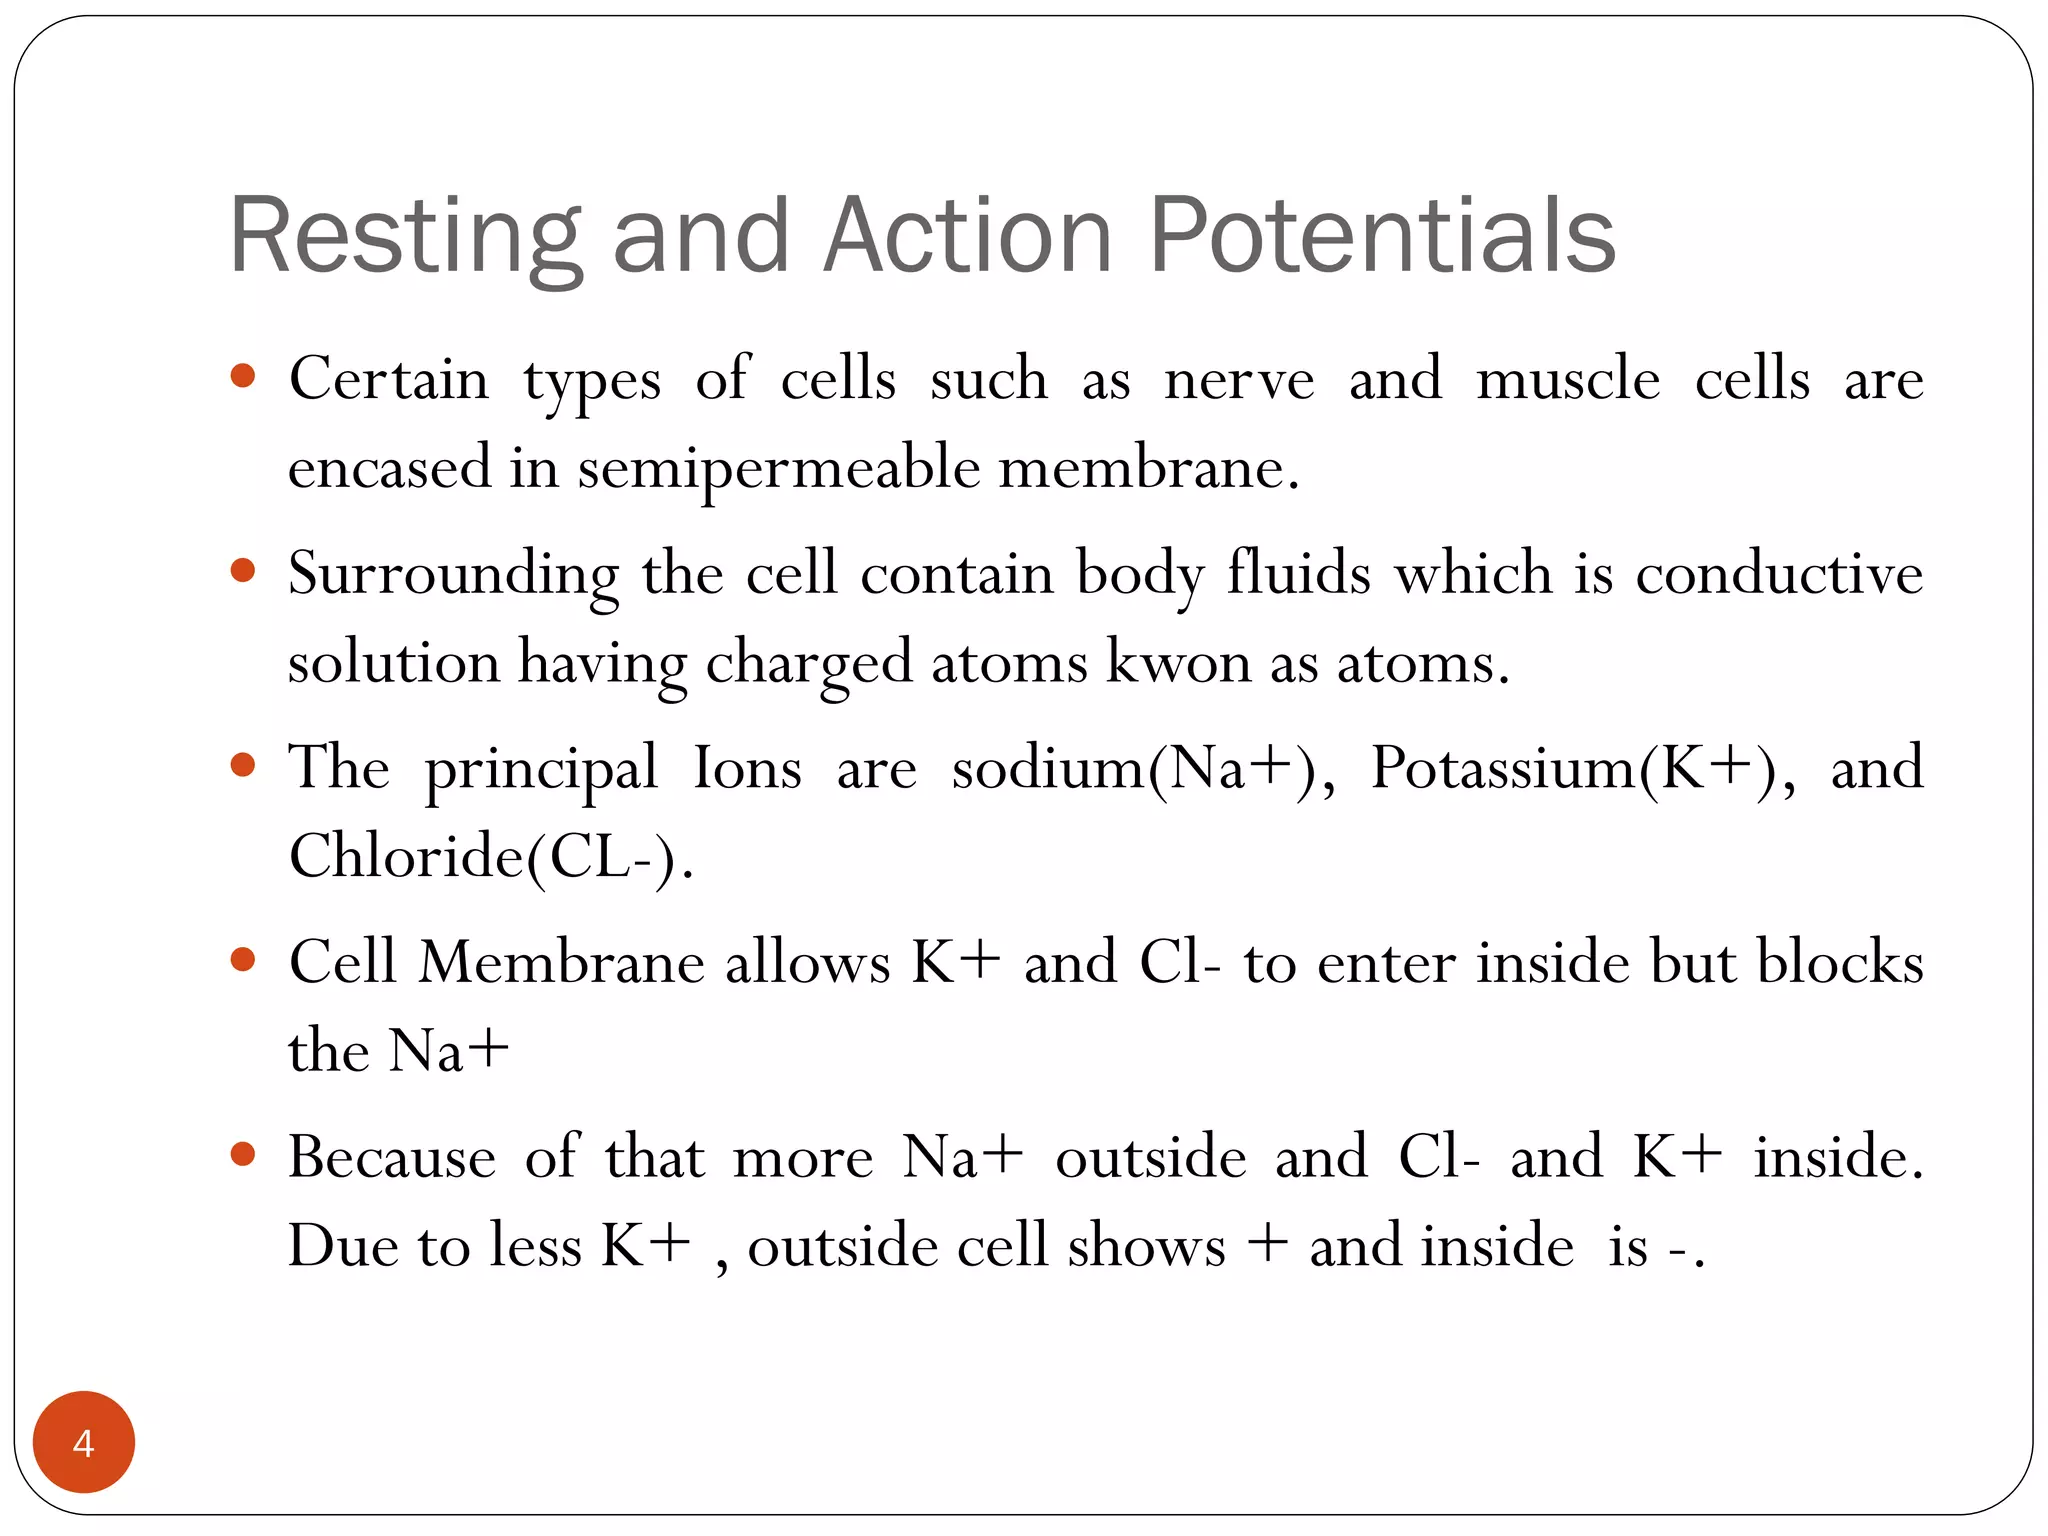
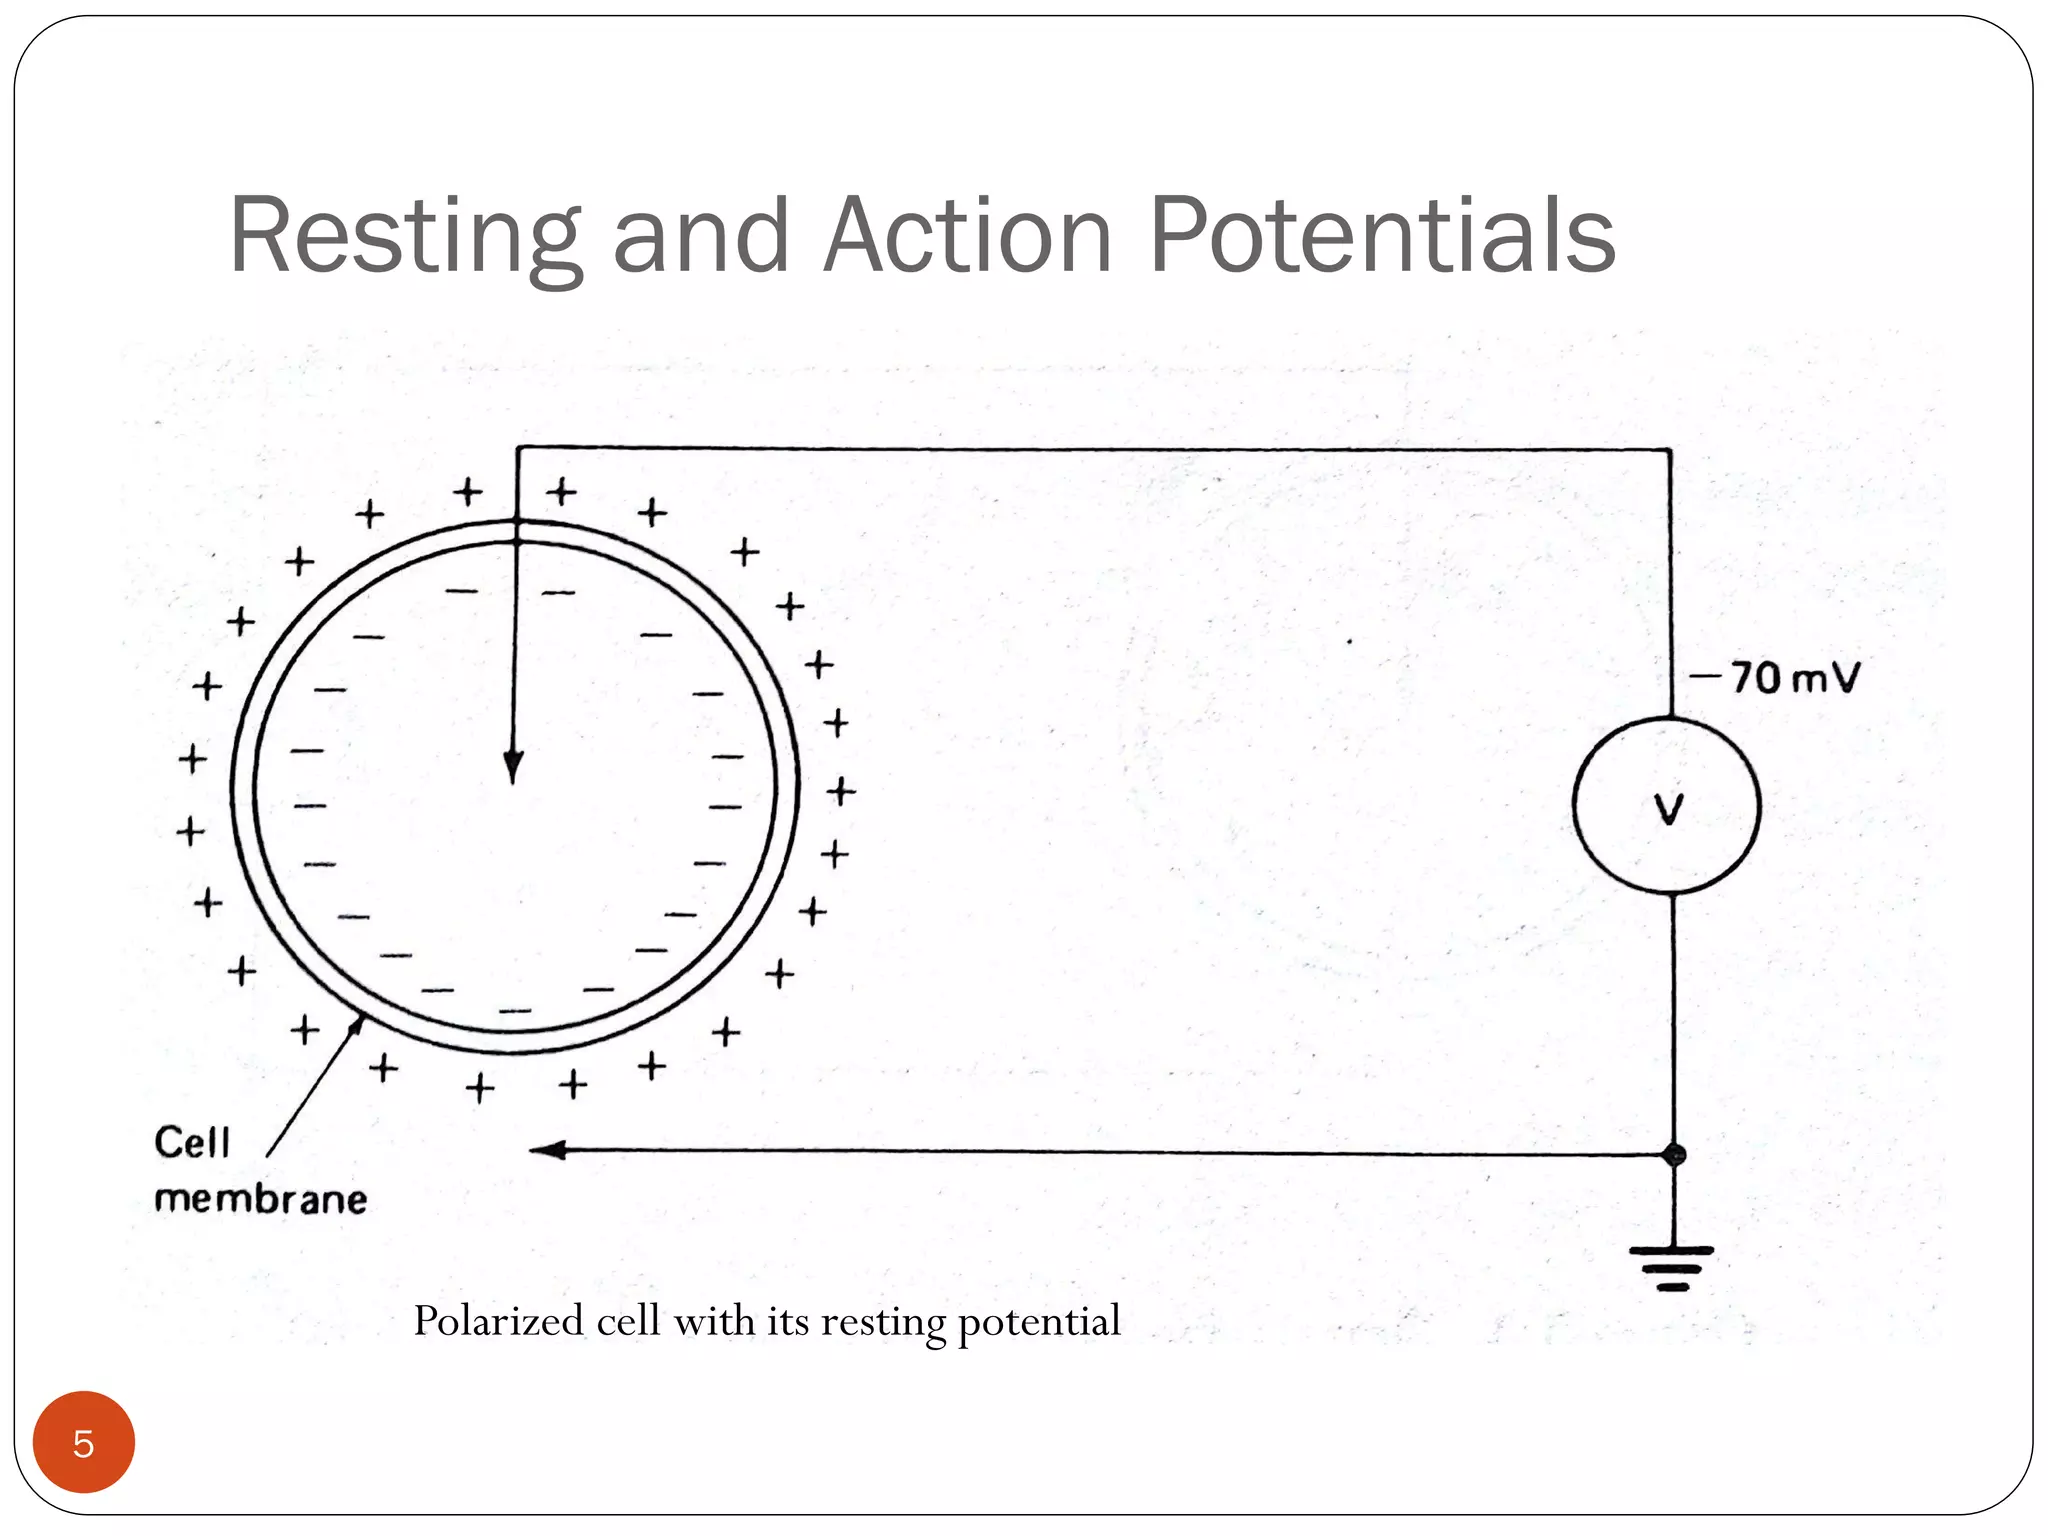
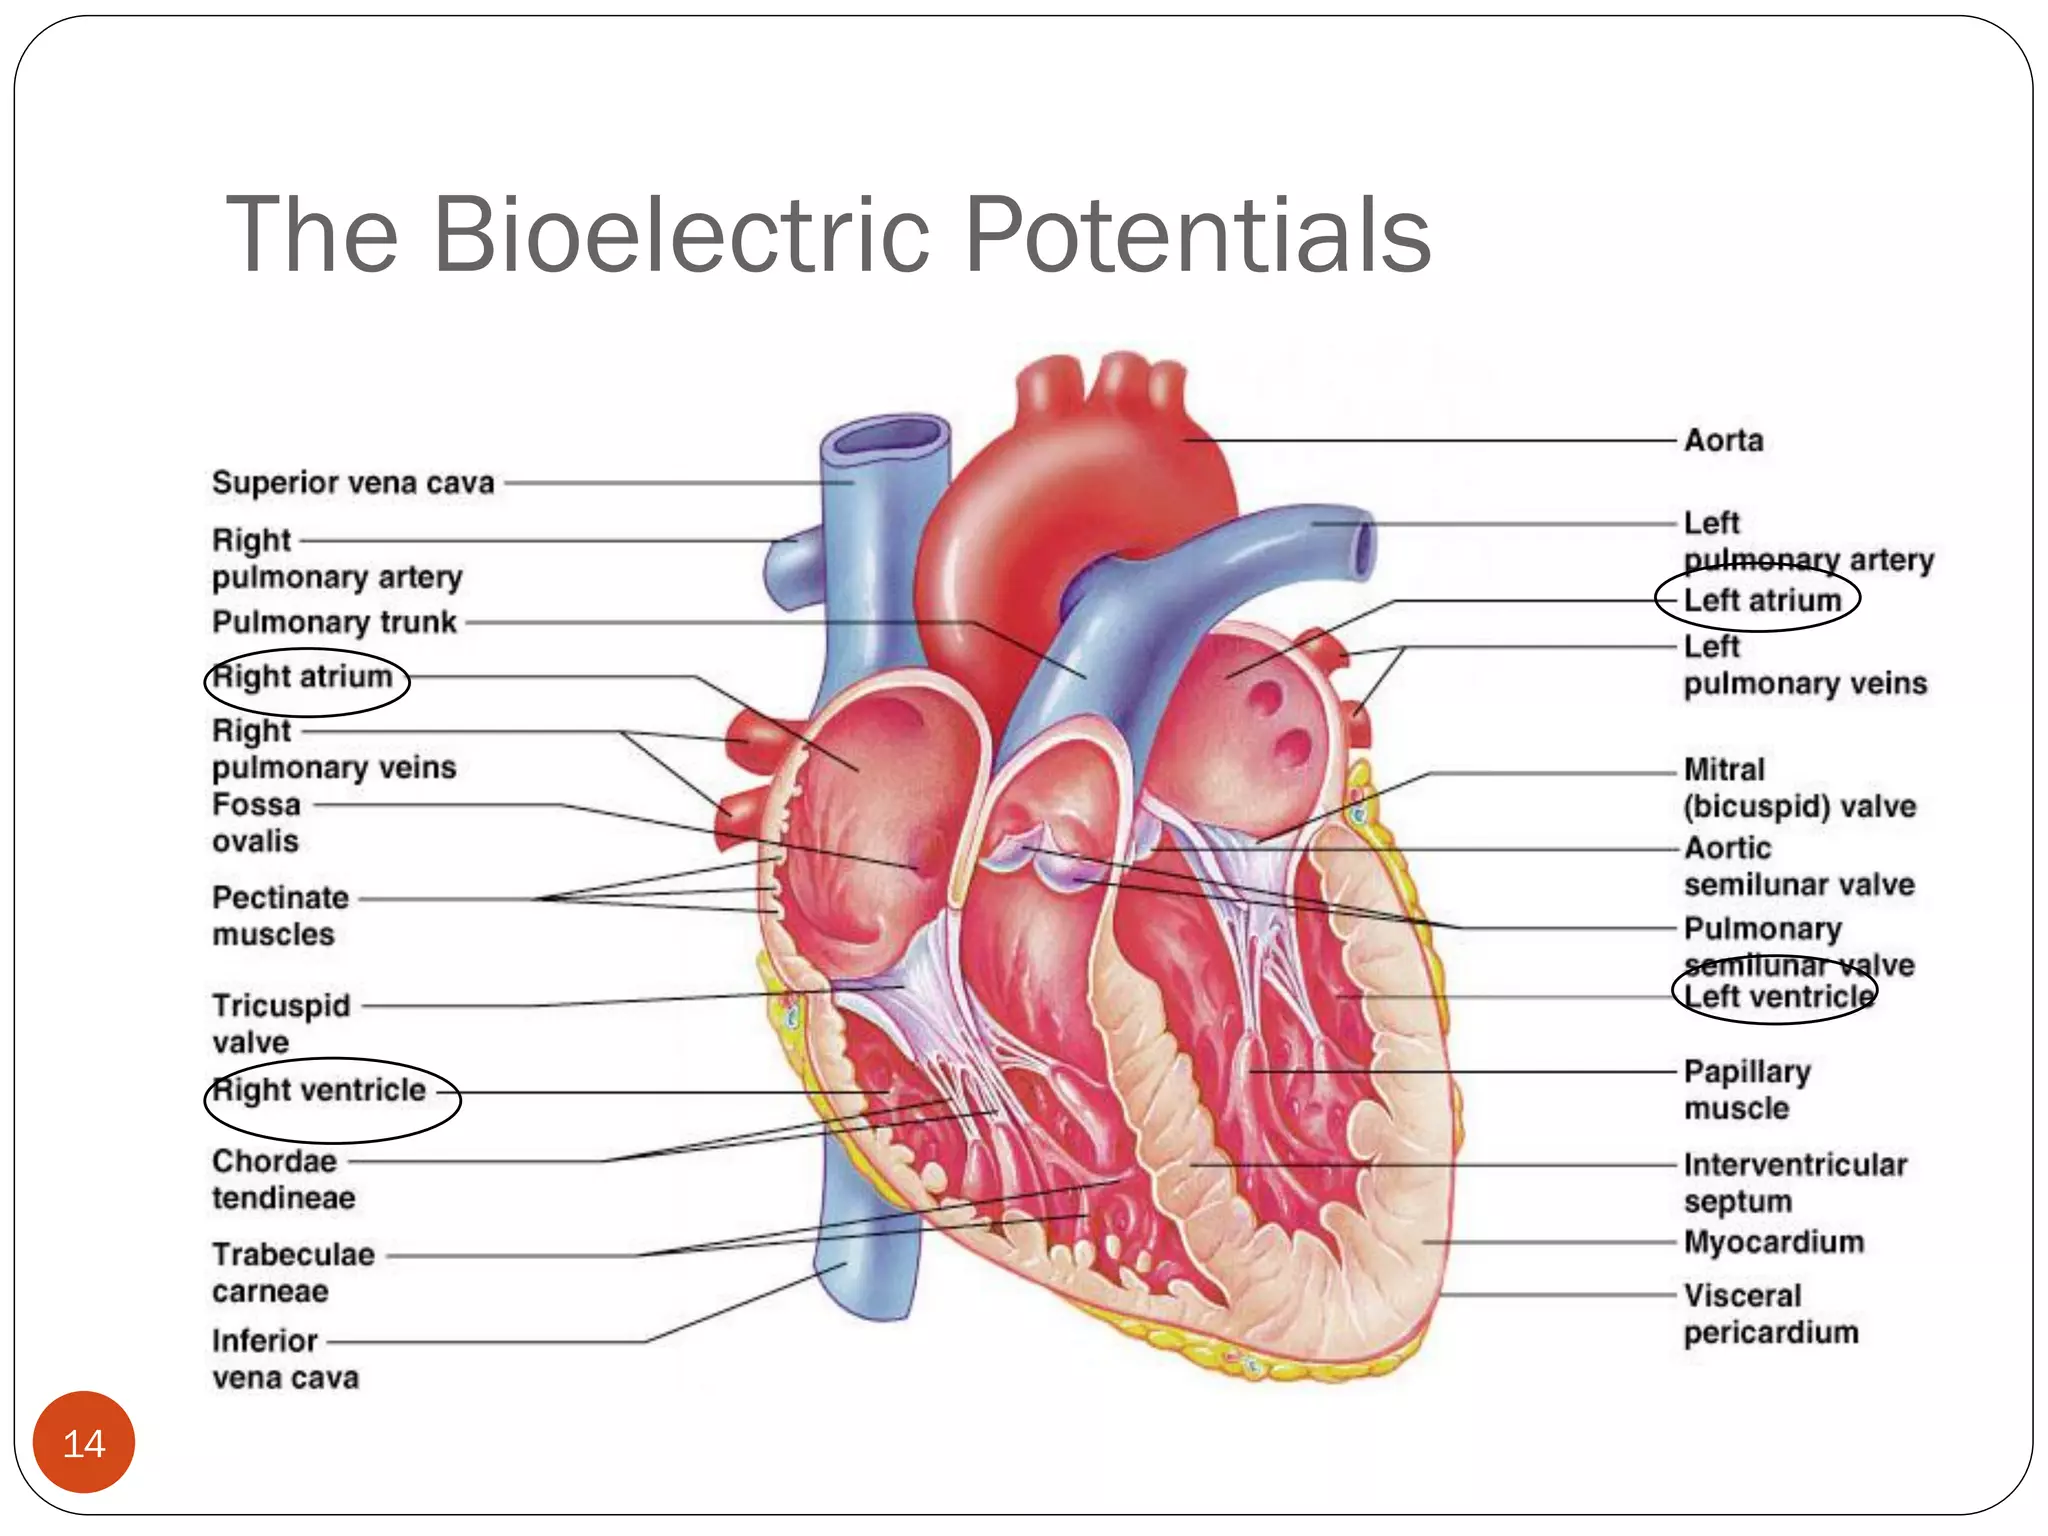
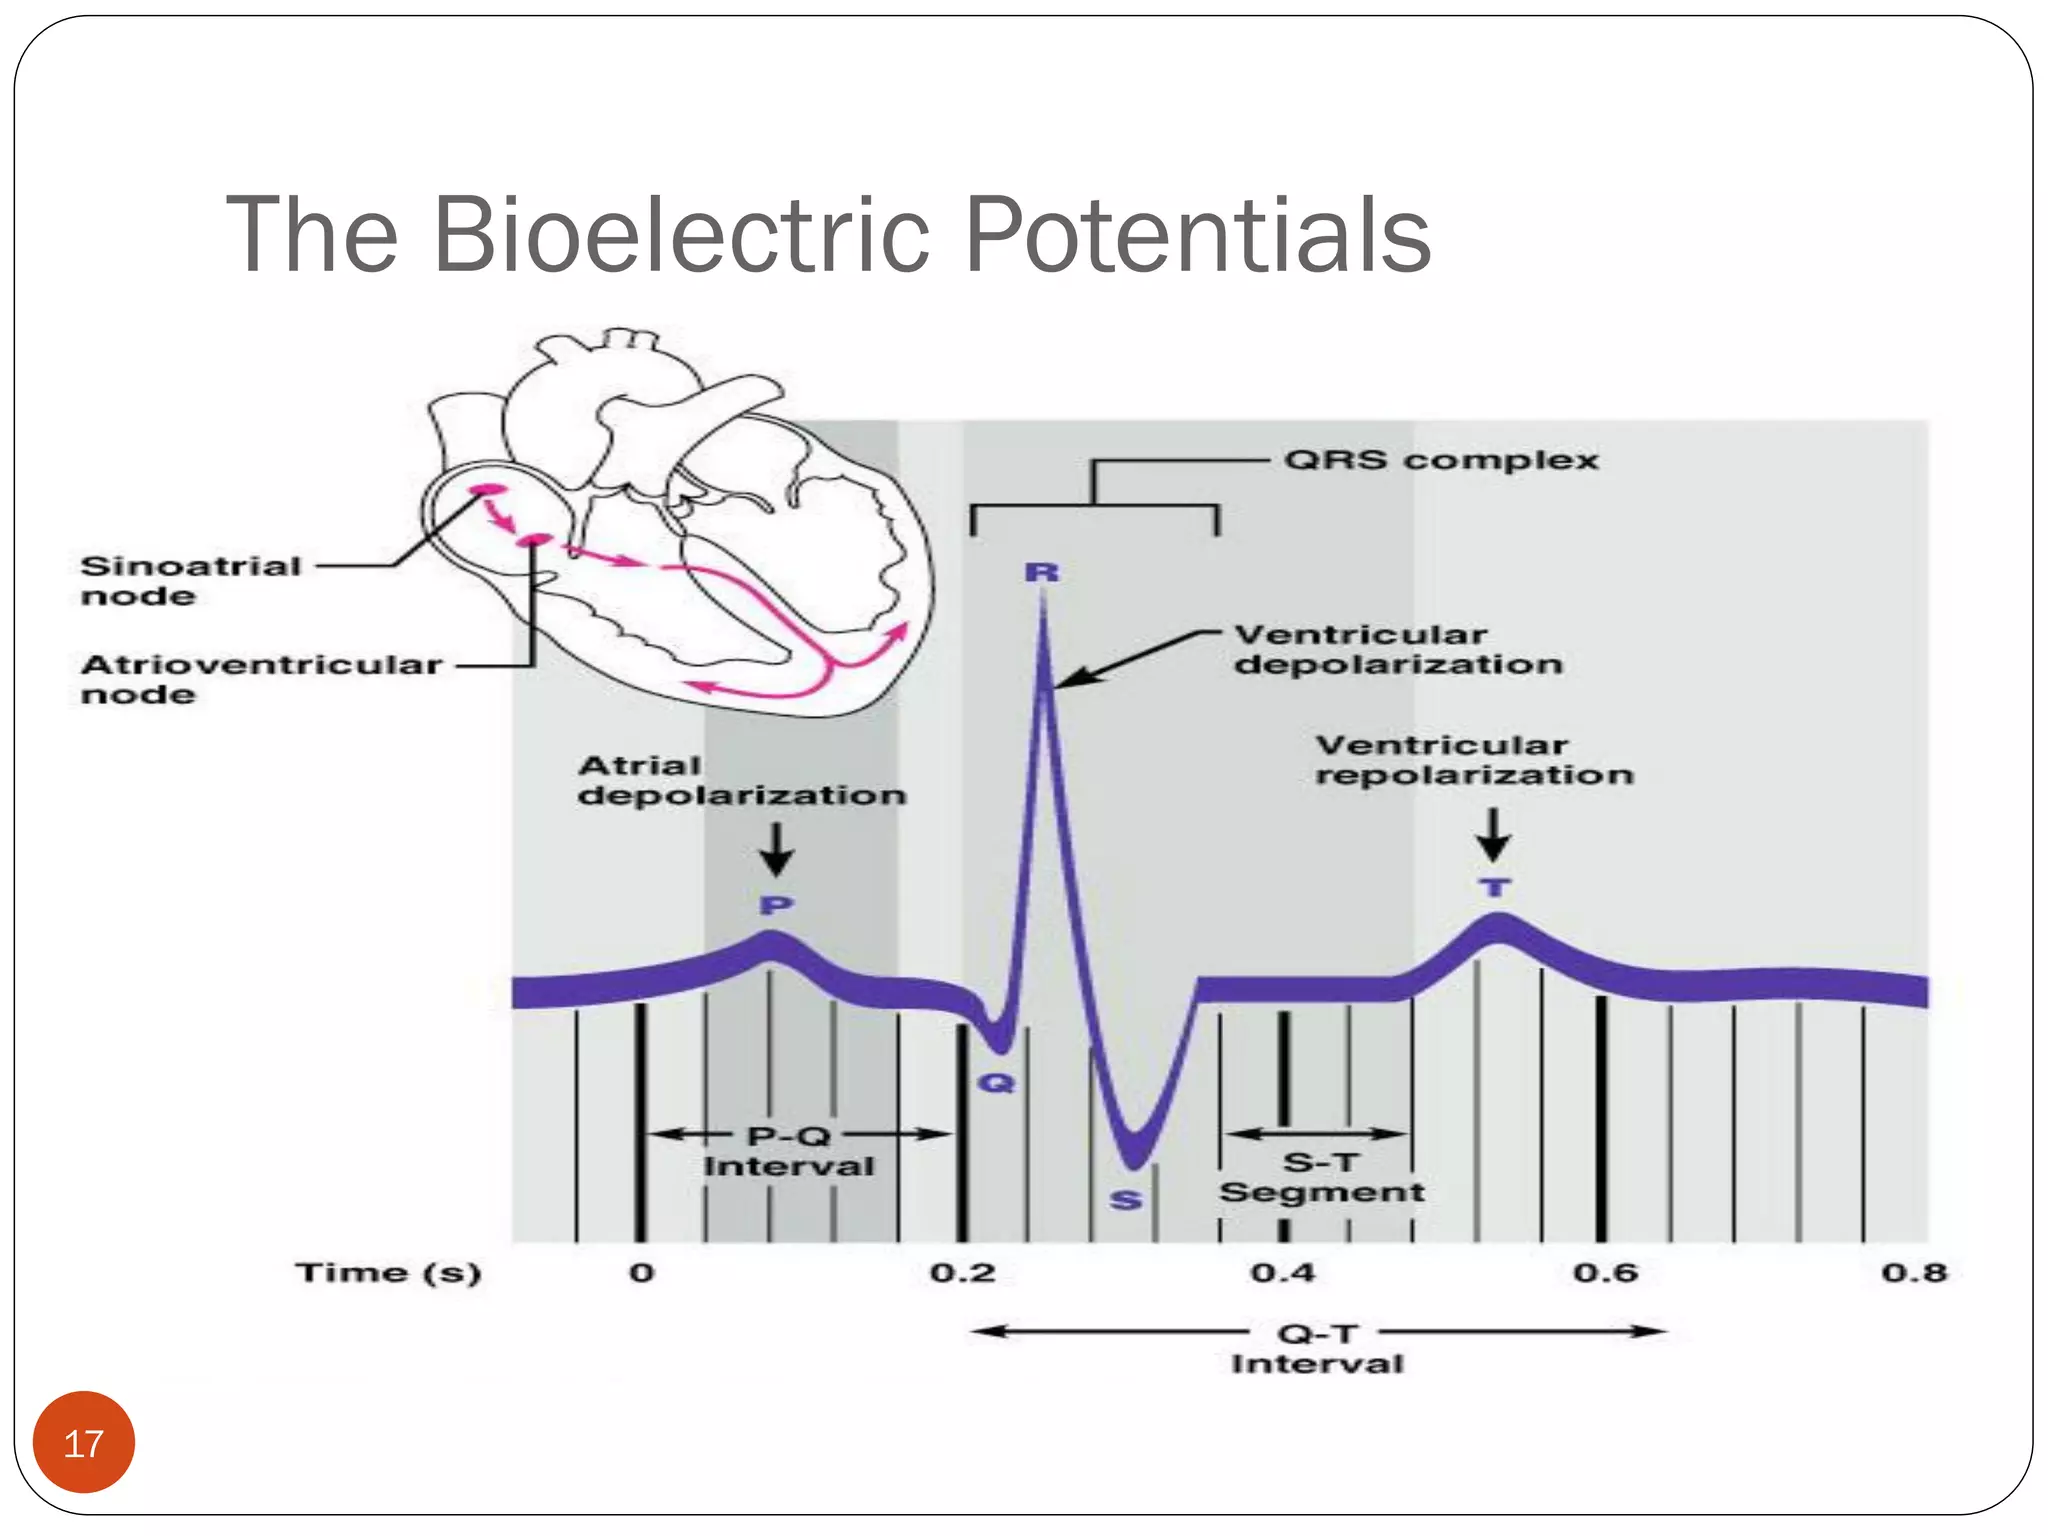
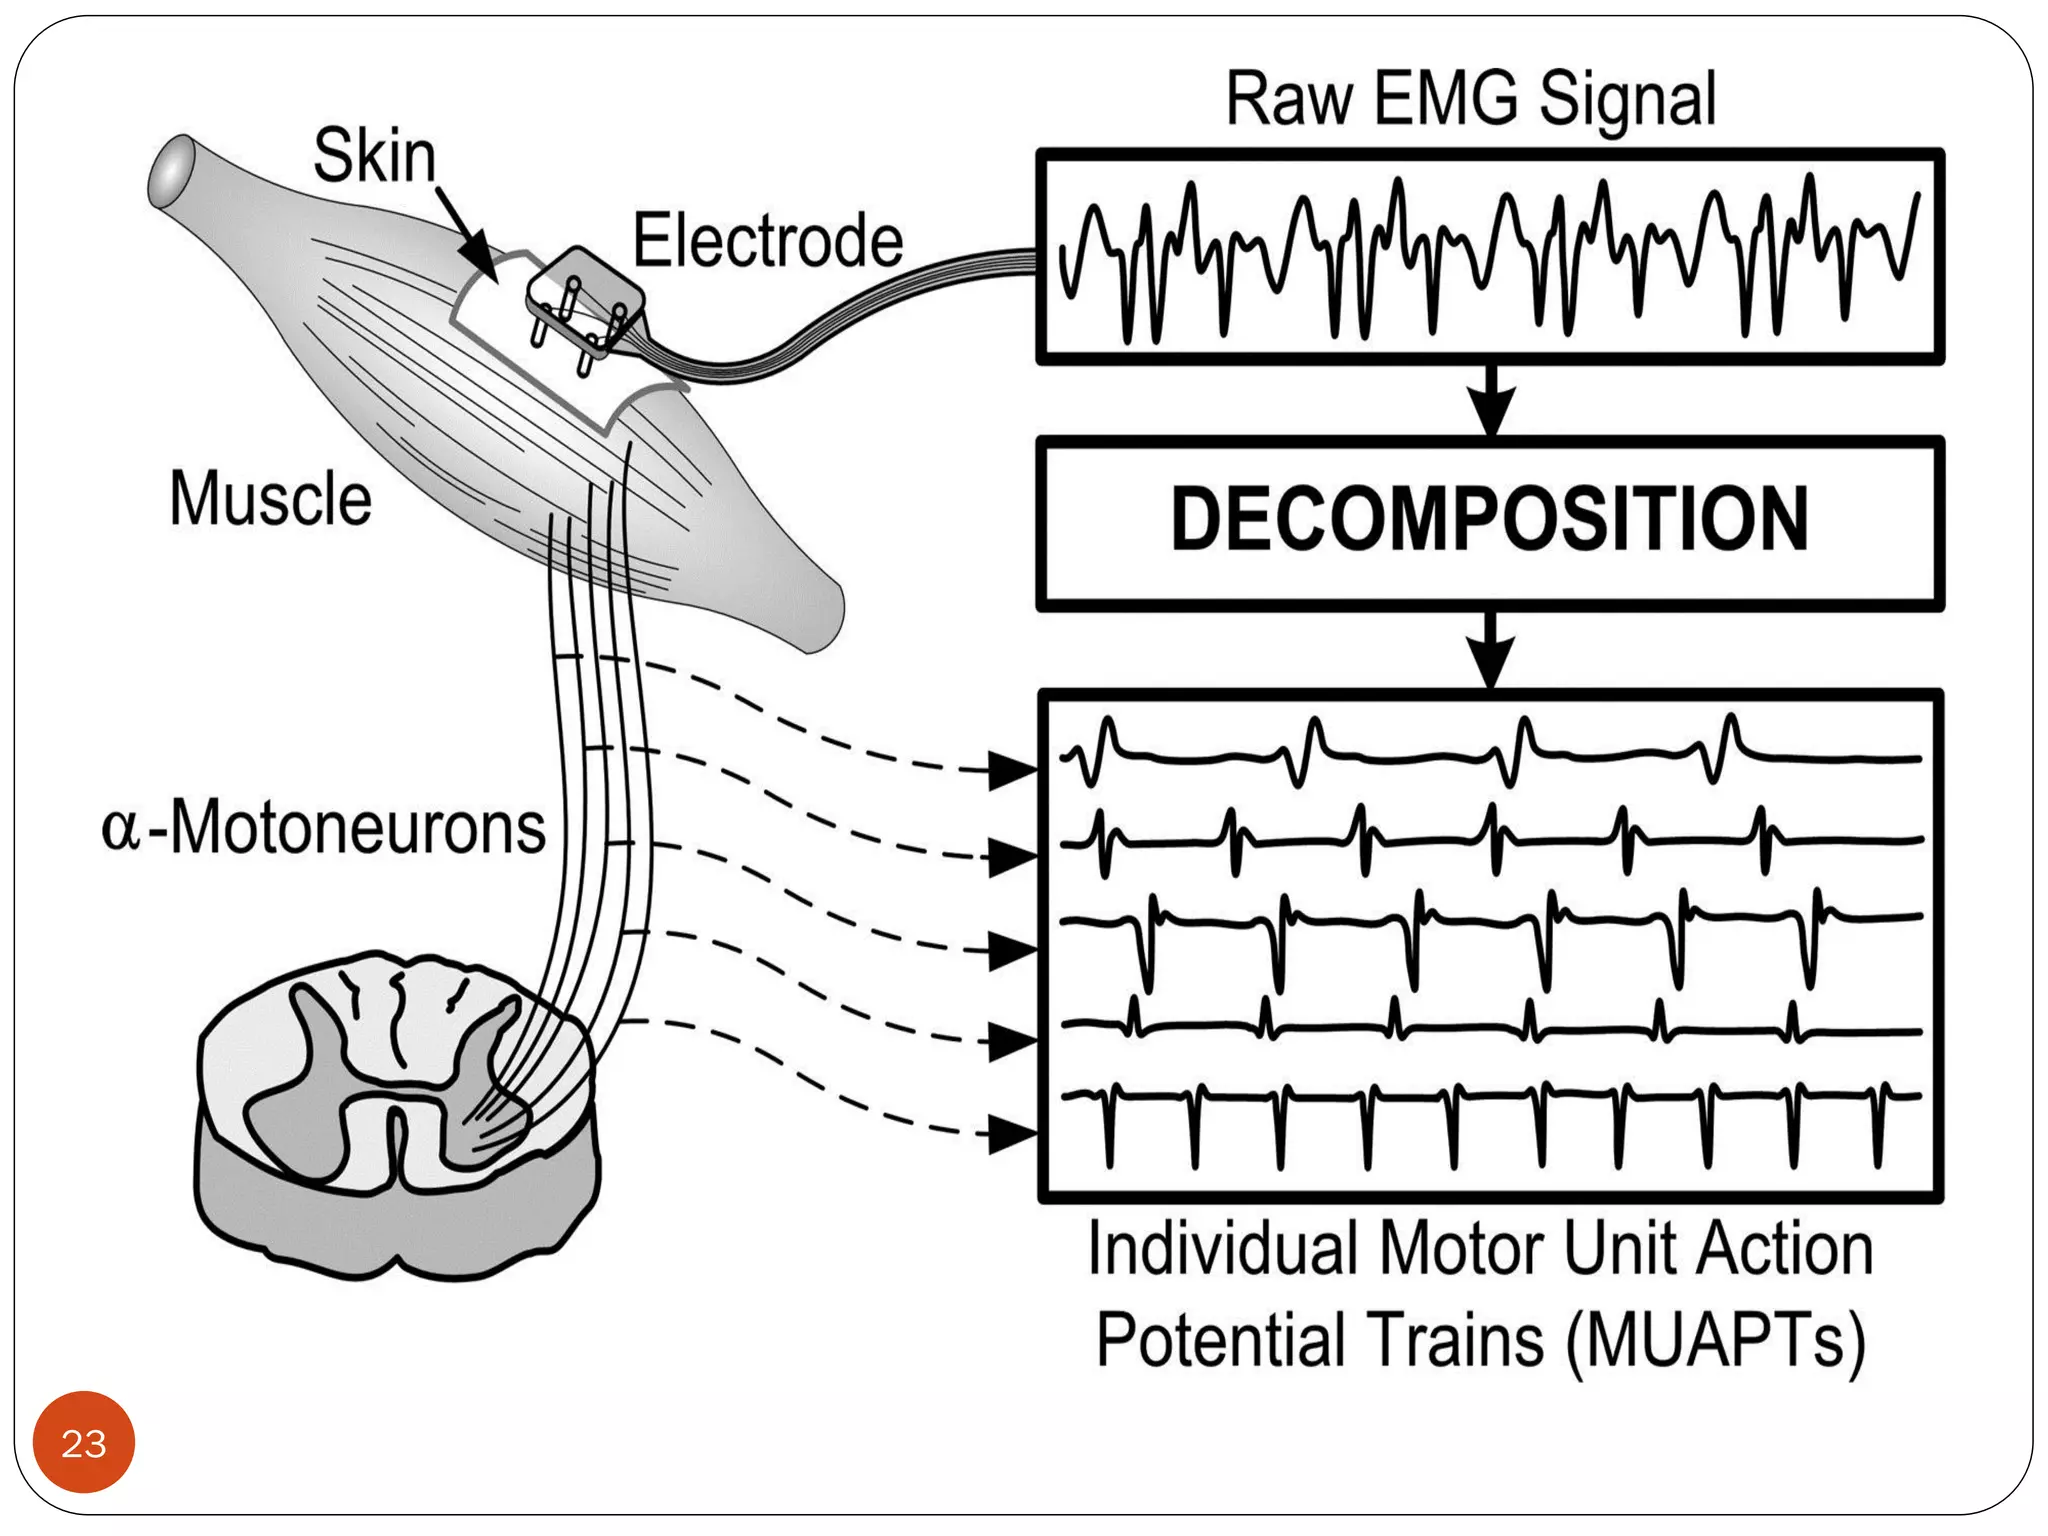


The document discusses bioelectric potentials generated by the body, which convey important information related to nerve conduction, brain activity, and muscle movements. It explains the concepts of resting and action potentials, their propagation, and various bioelectric signals, such as ECG, EEG, EMG, and others. Key points include the mechanisms of ion movement across cell membranes and the significance of action potentials in physiological processes.


