Data flow Diagram (DFD).pptx is used to represent the flow of information in a system and the processes that occur for getting information to external entites
Similar to Data flow Diagram (DFD).pptx is used to represent the flow of information in a system and the processes that occur for getting information to external entites
Data flow Diagram (DFD).pptx is used to represent the flow of information in a system and the processes that occur for getting information to external entites
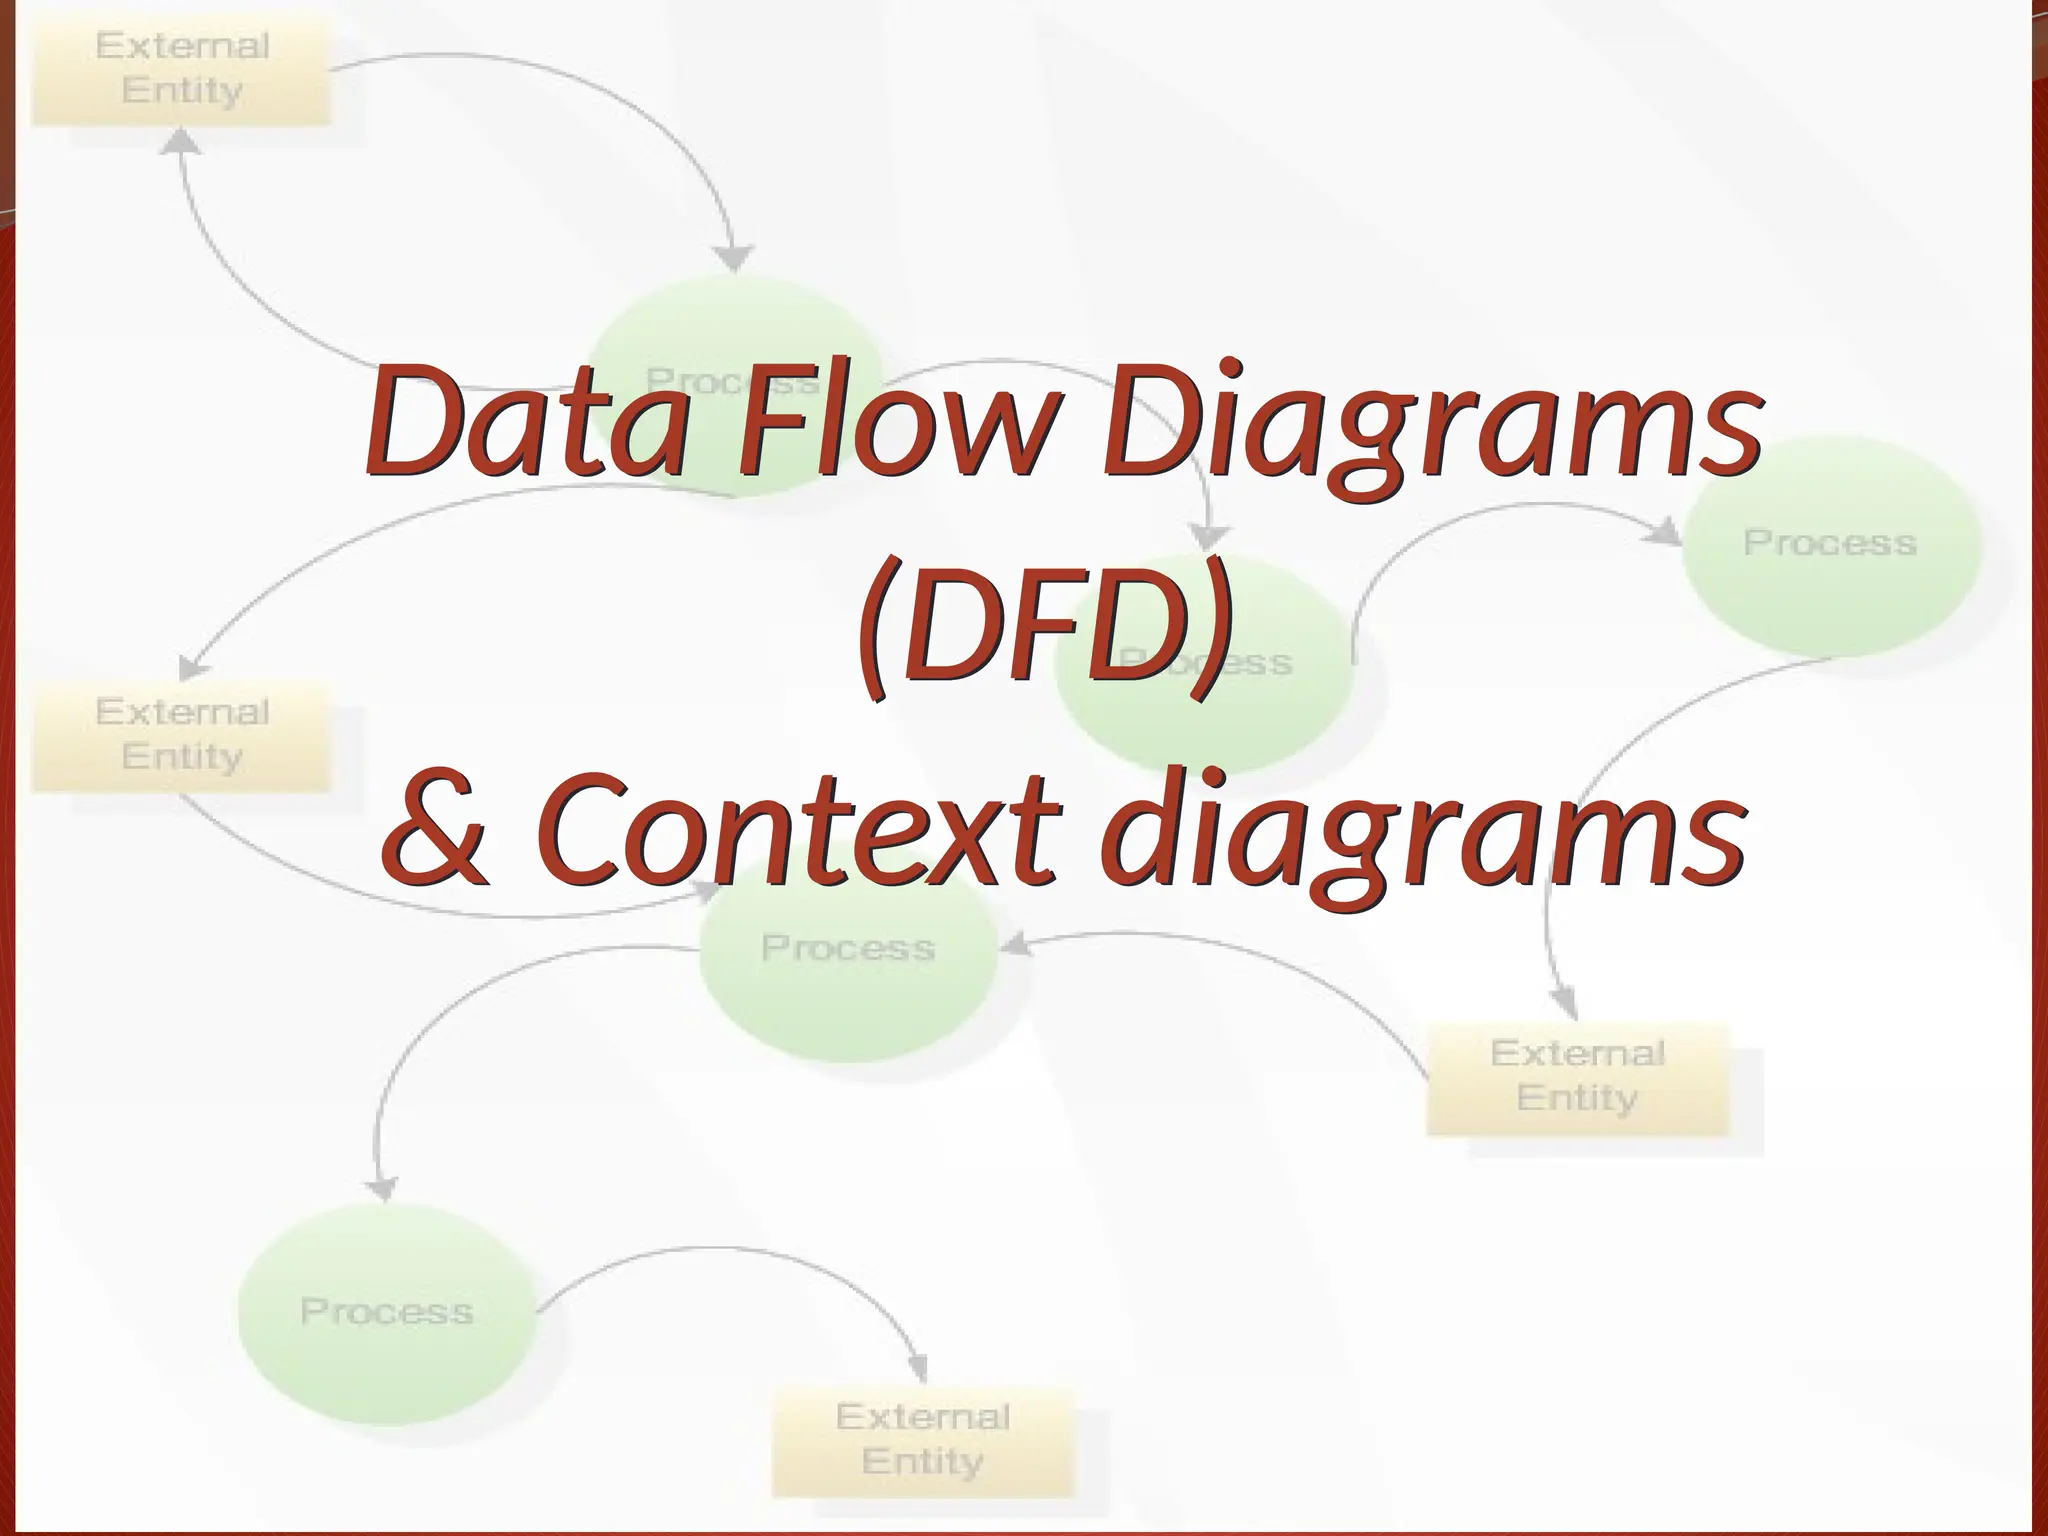
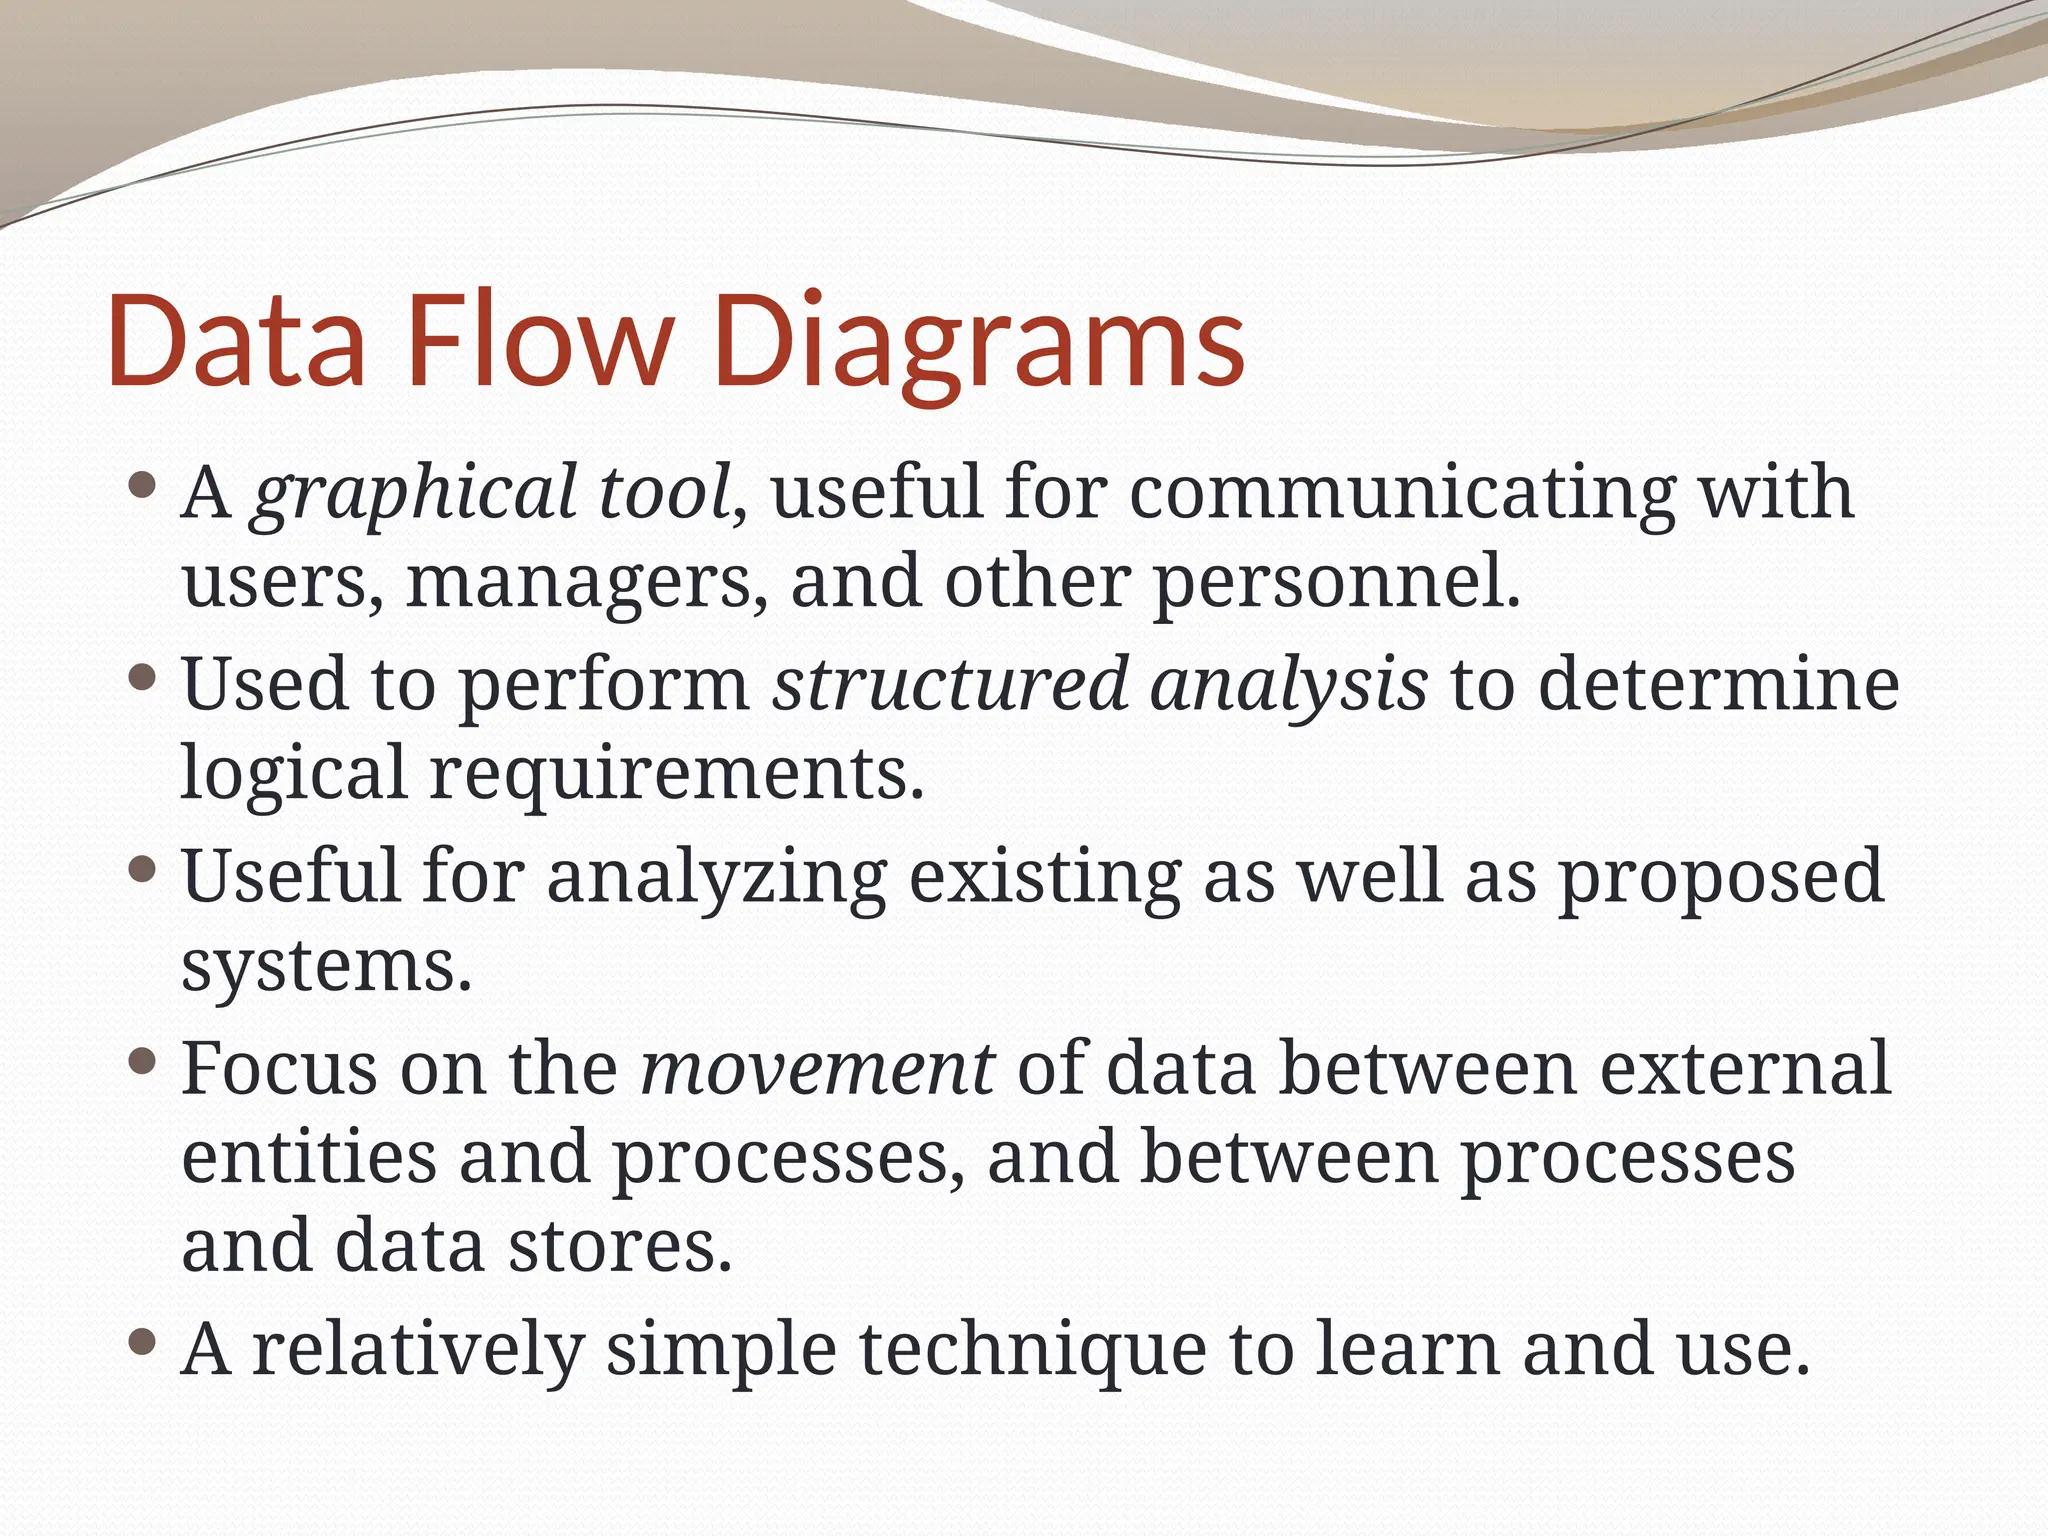
Data Flow Diagrams
A graphical tool, useful for communicating with
users, managers, and other personnel.
Used to perform structured analysis to determine
logical requirements.
Useful for analyzing existing as well as proposed
systems.
Focus on the movement of data between external
entities and processes, and between processes
and data stores.
A relatively simple technique to learn and use.
3.
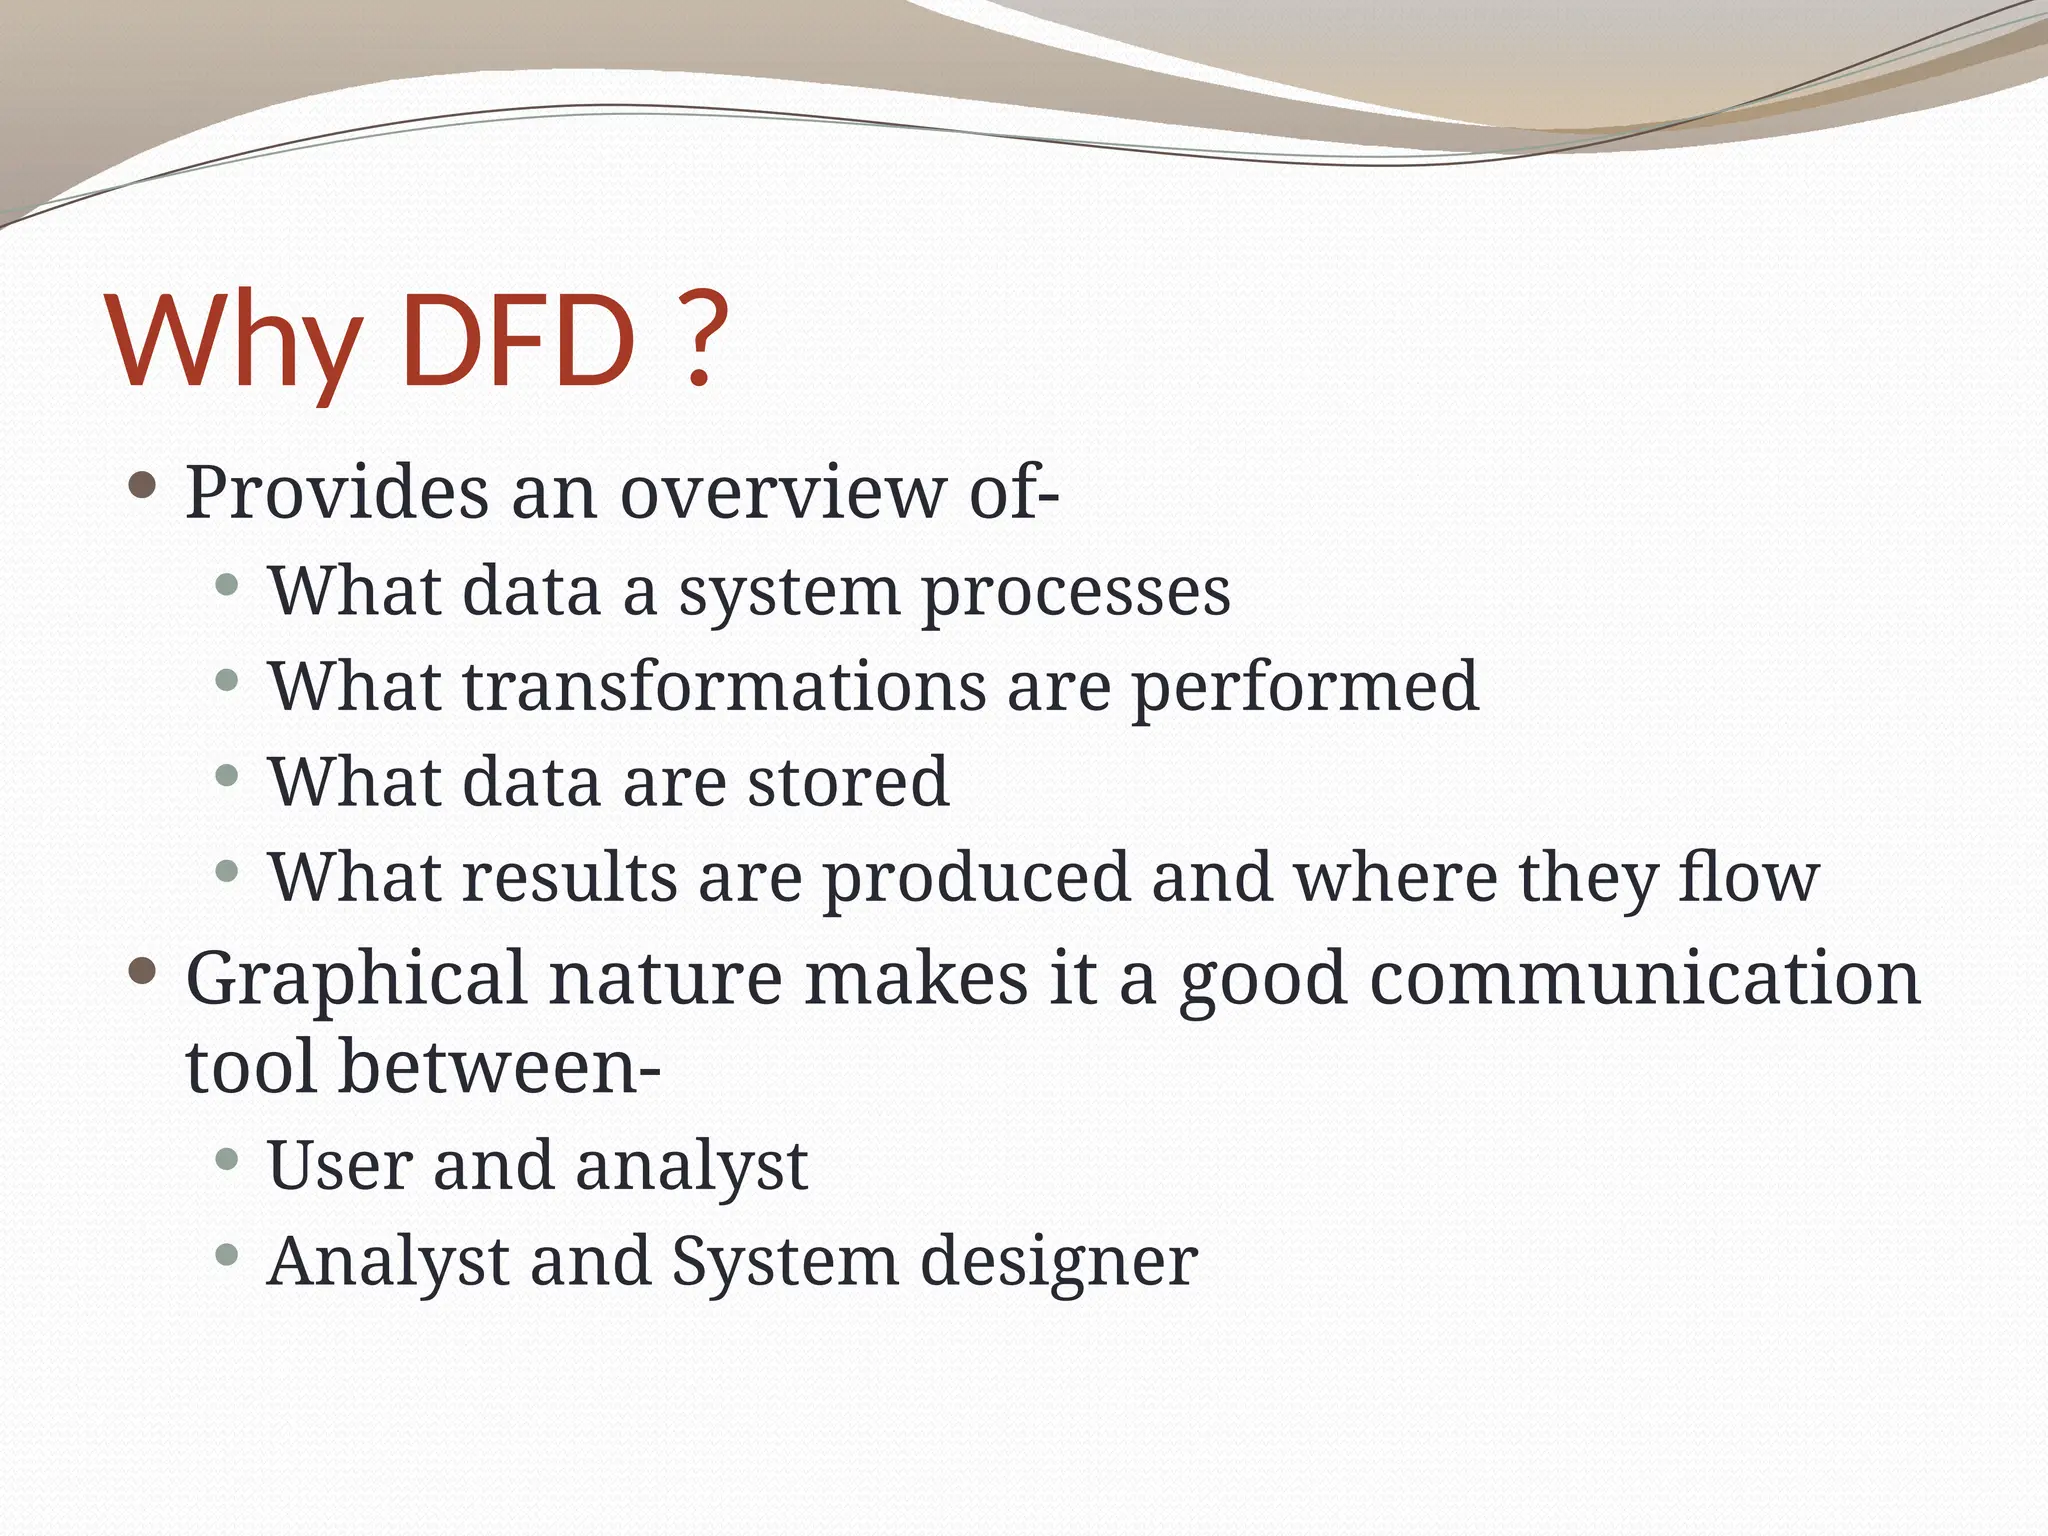
Why DFD ?
Provides an overview of-
What data a system processes
What transformations are performed
What data are stored
What results are produced and where they flow
Graphical nature makes it a good communication
tool between-
User and analyst
Analyst and System designer
5
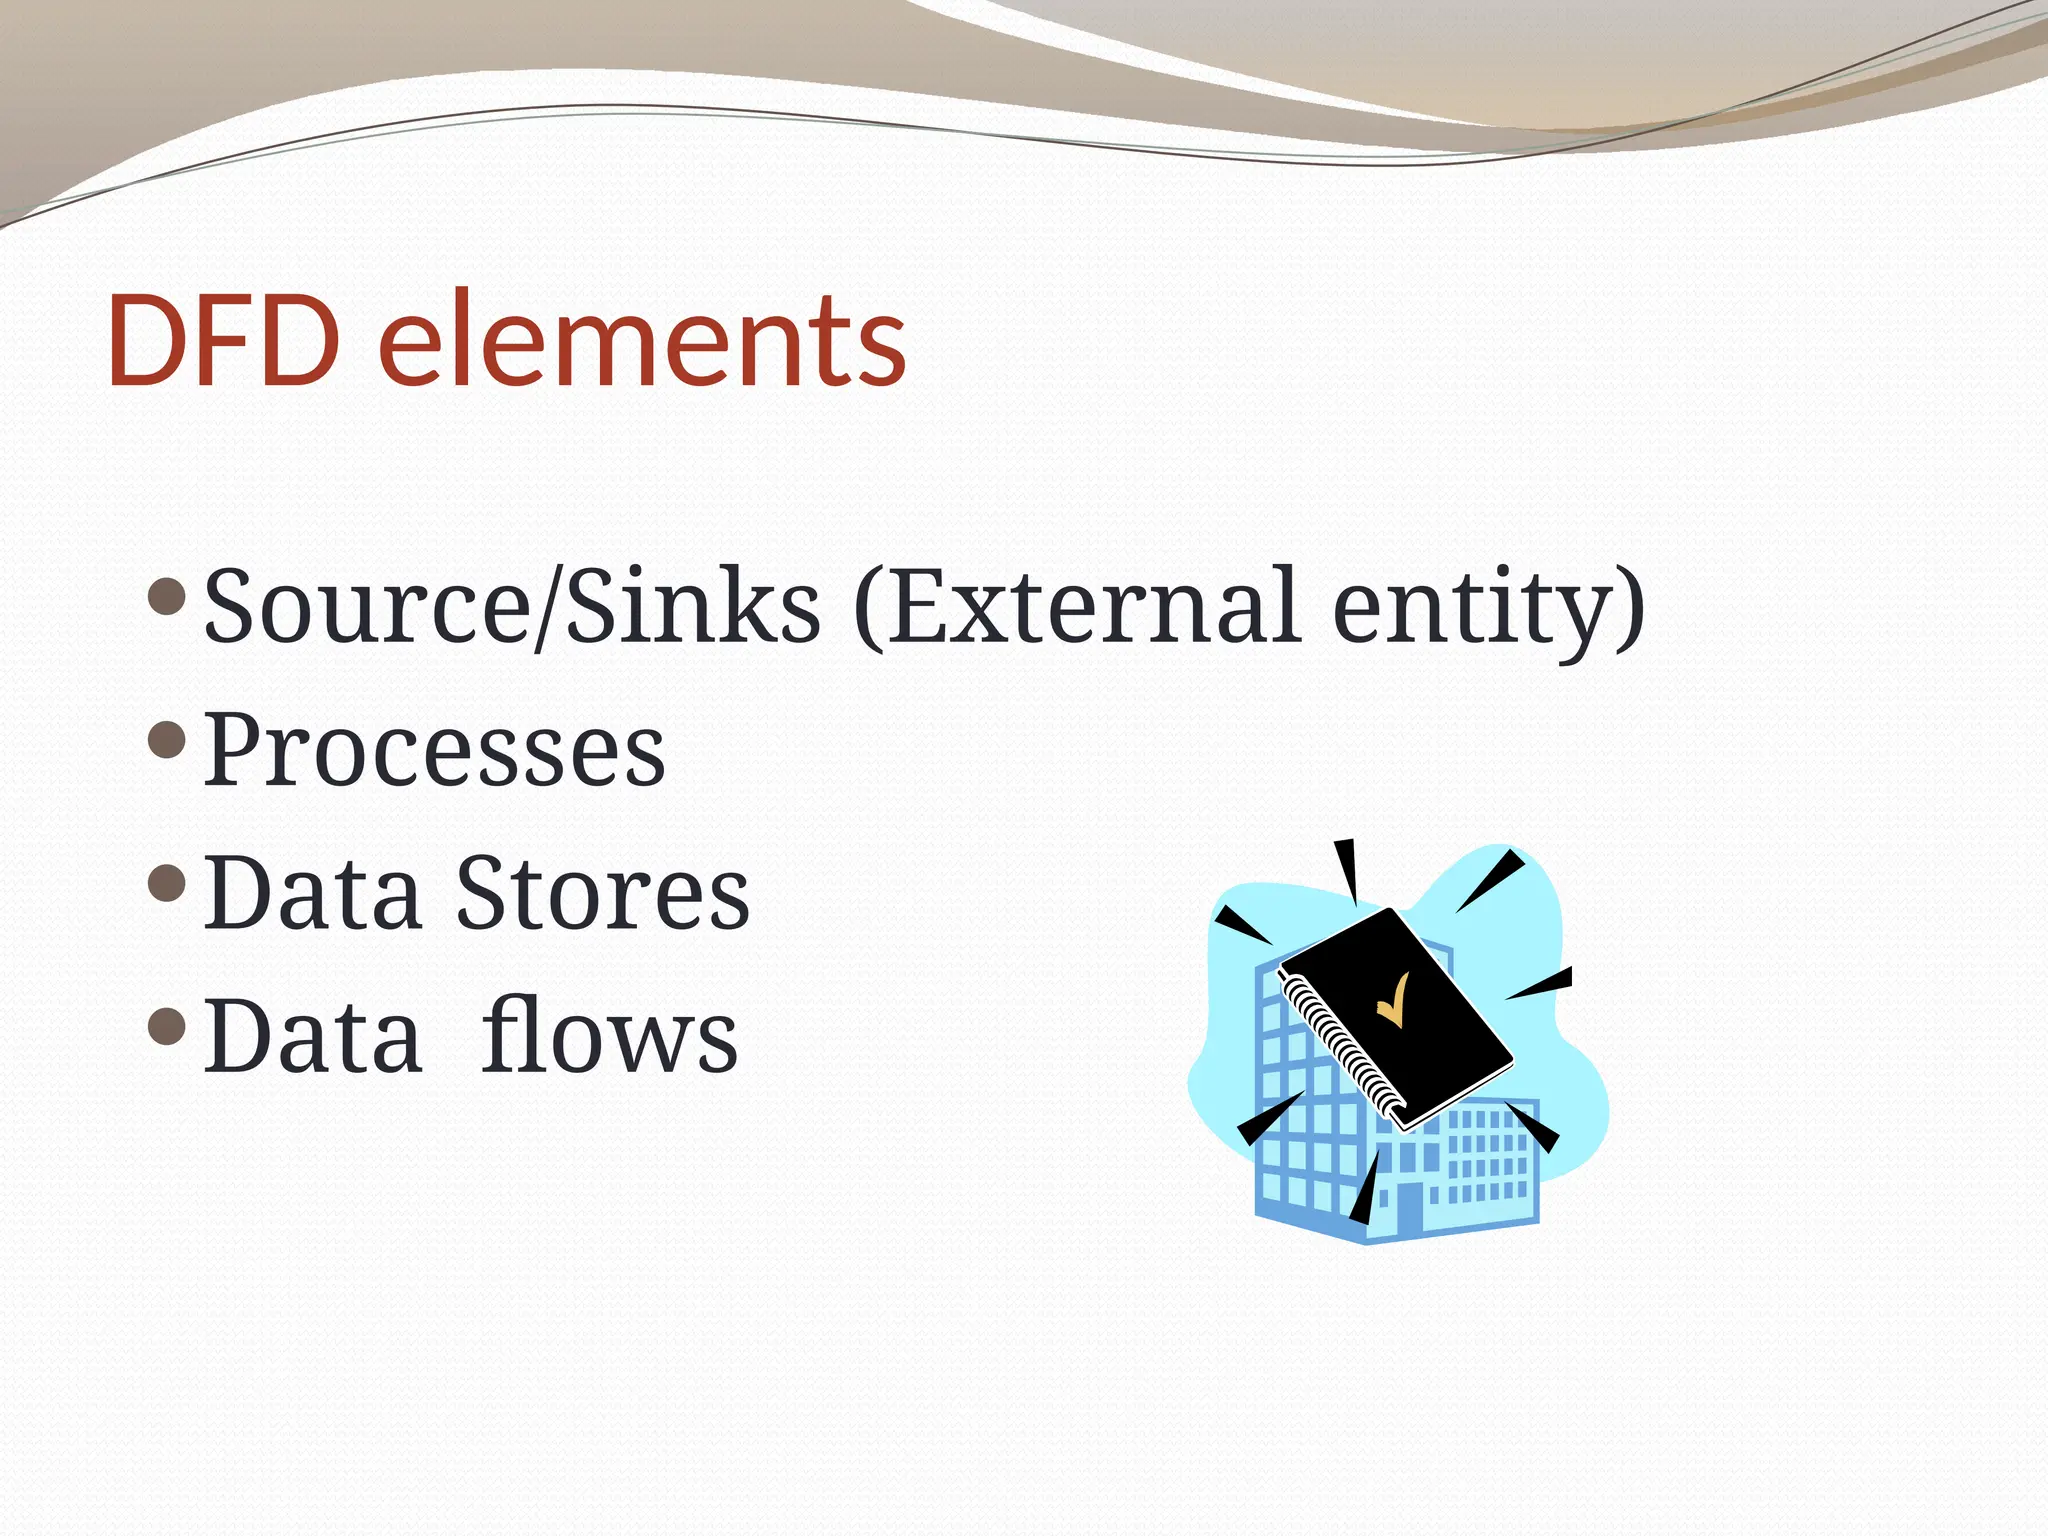
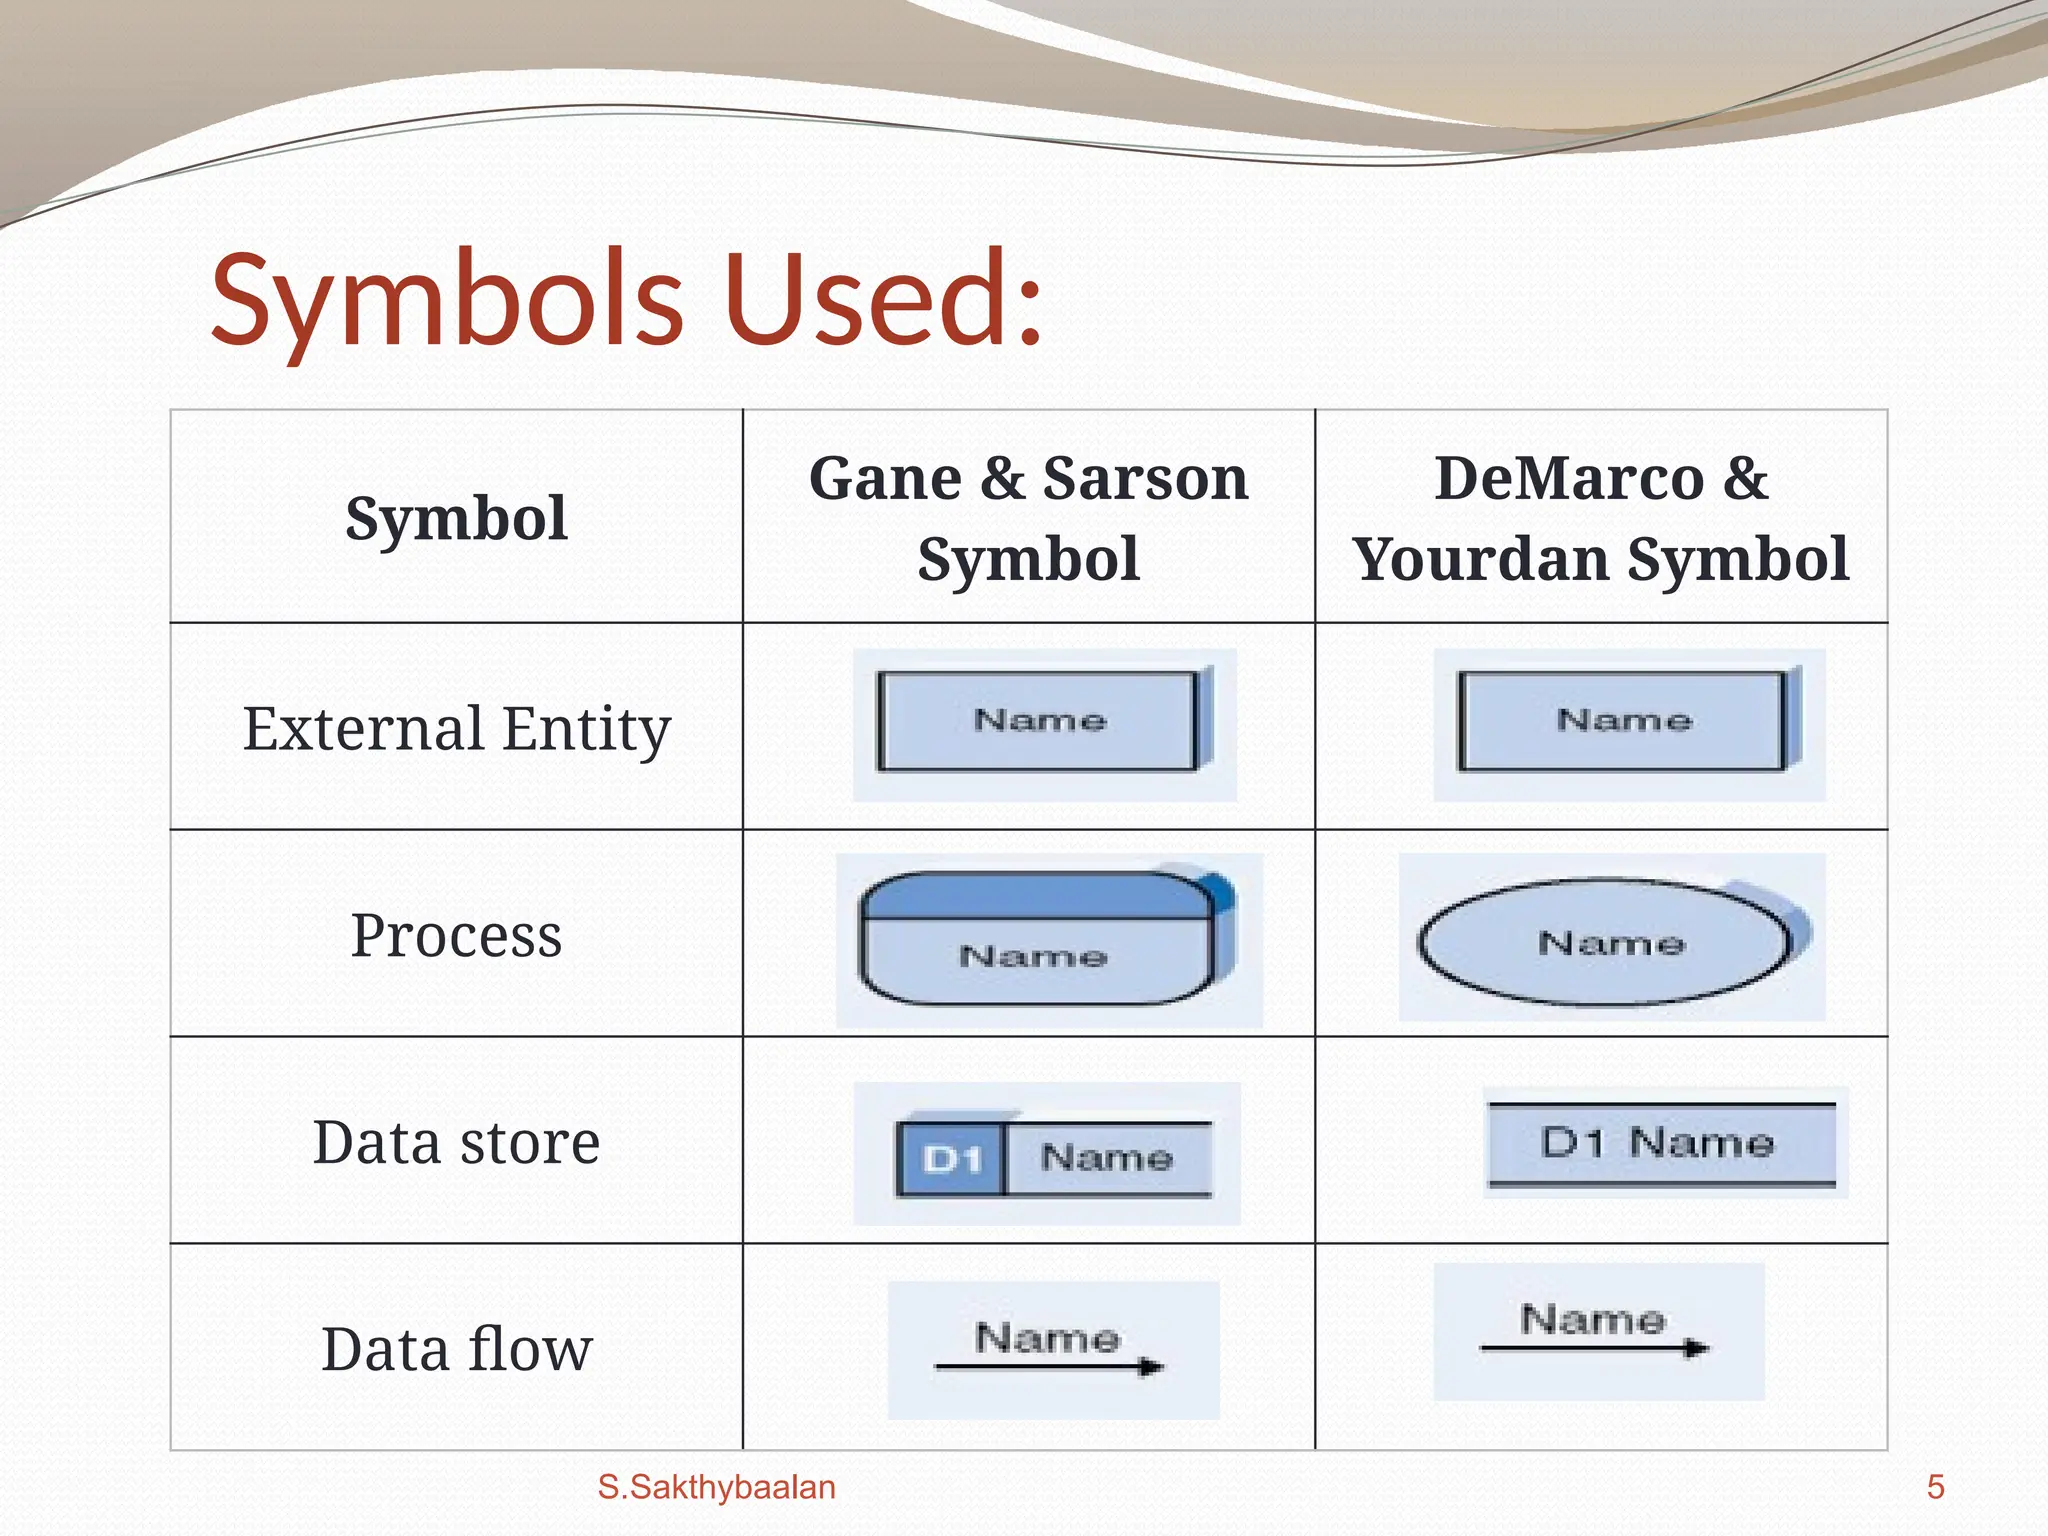
Symbols Used:
Symbol
Gane &Sarson
Symbol
DeMarco &
Yourdan Symbol
External Entity
Process
Data store
Data flow
S.Sakthybaalan
6.
6
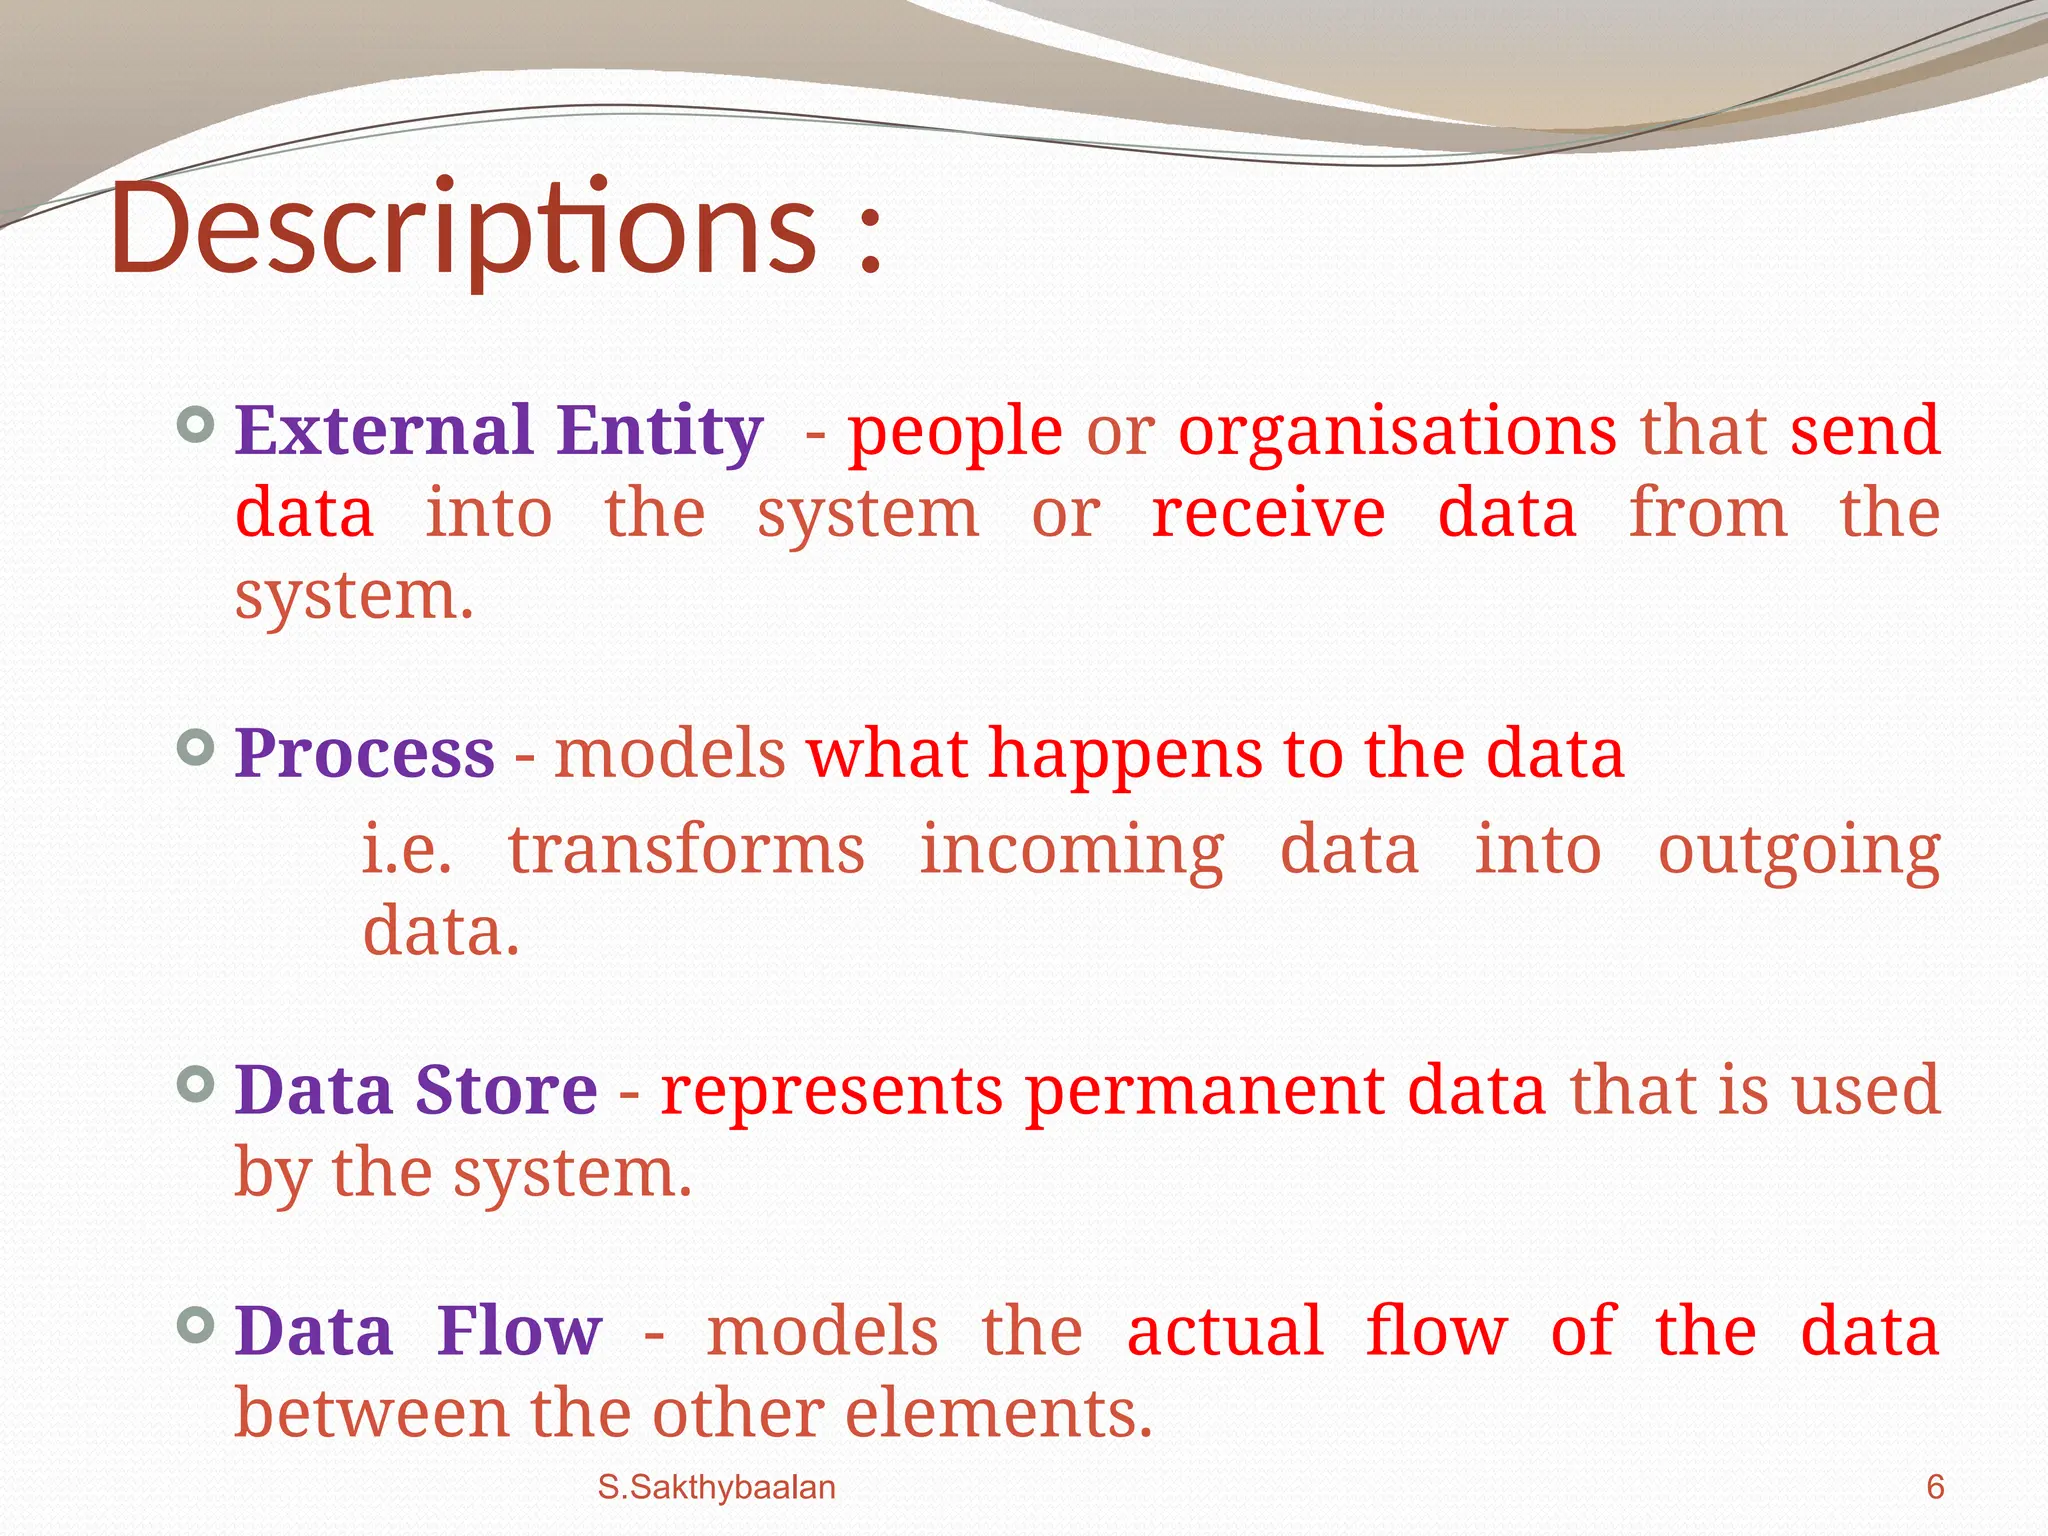
Descriptions :
ExternalEntity - people or organisations that send
data into the system or receive data from the
system.
Process - models what happens to the data
i.e. transforms incoming data into outgoing
data.
Data Store - represents permanent data that is used
by the system.
Data Flow - models the actual flow of the data
between the other elements.
S.Sakthybaalan
7.
7
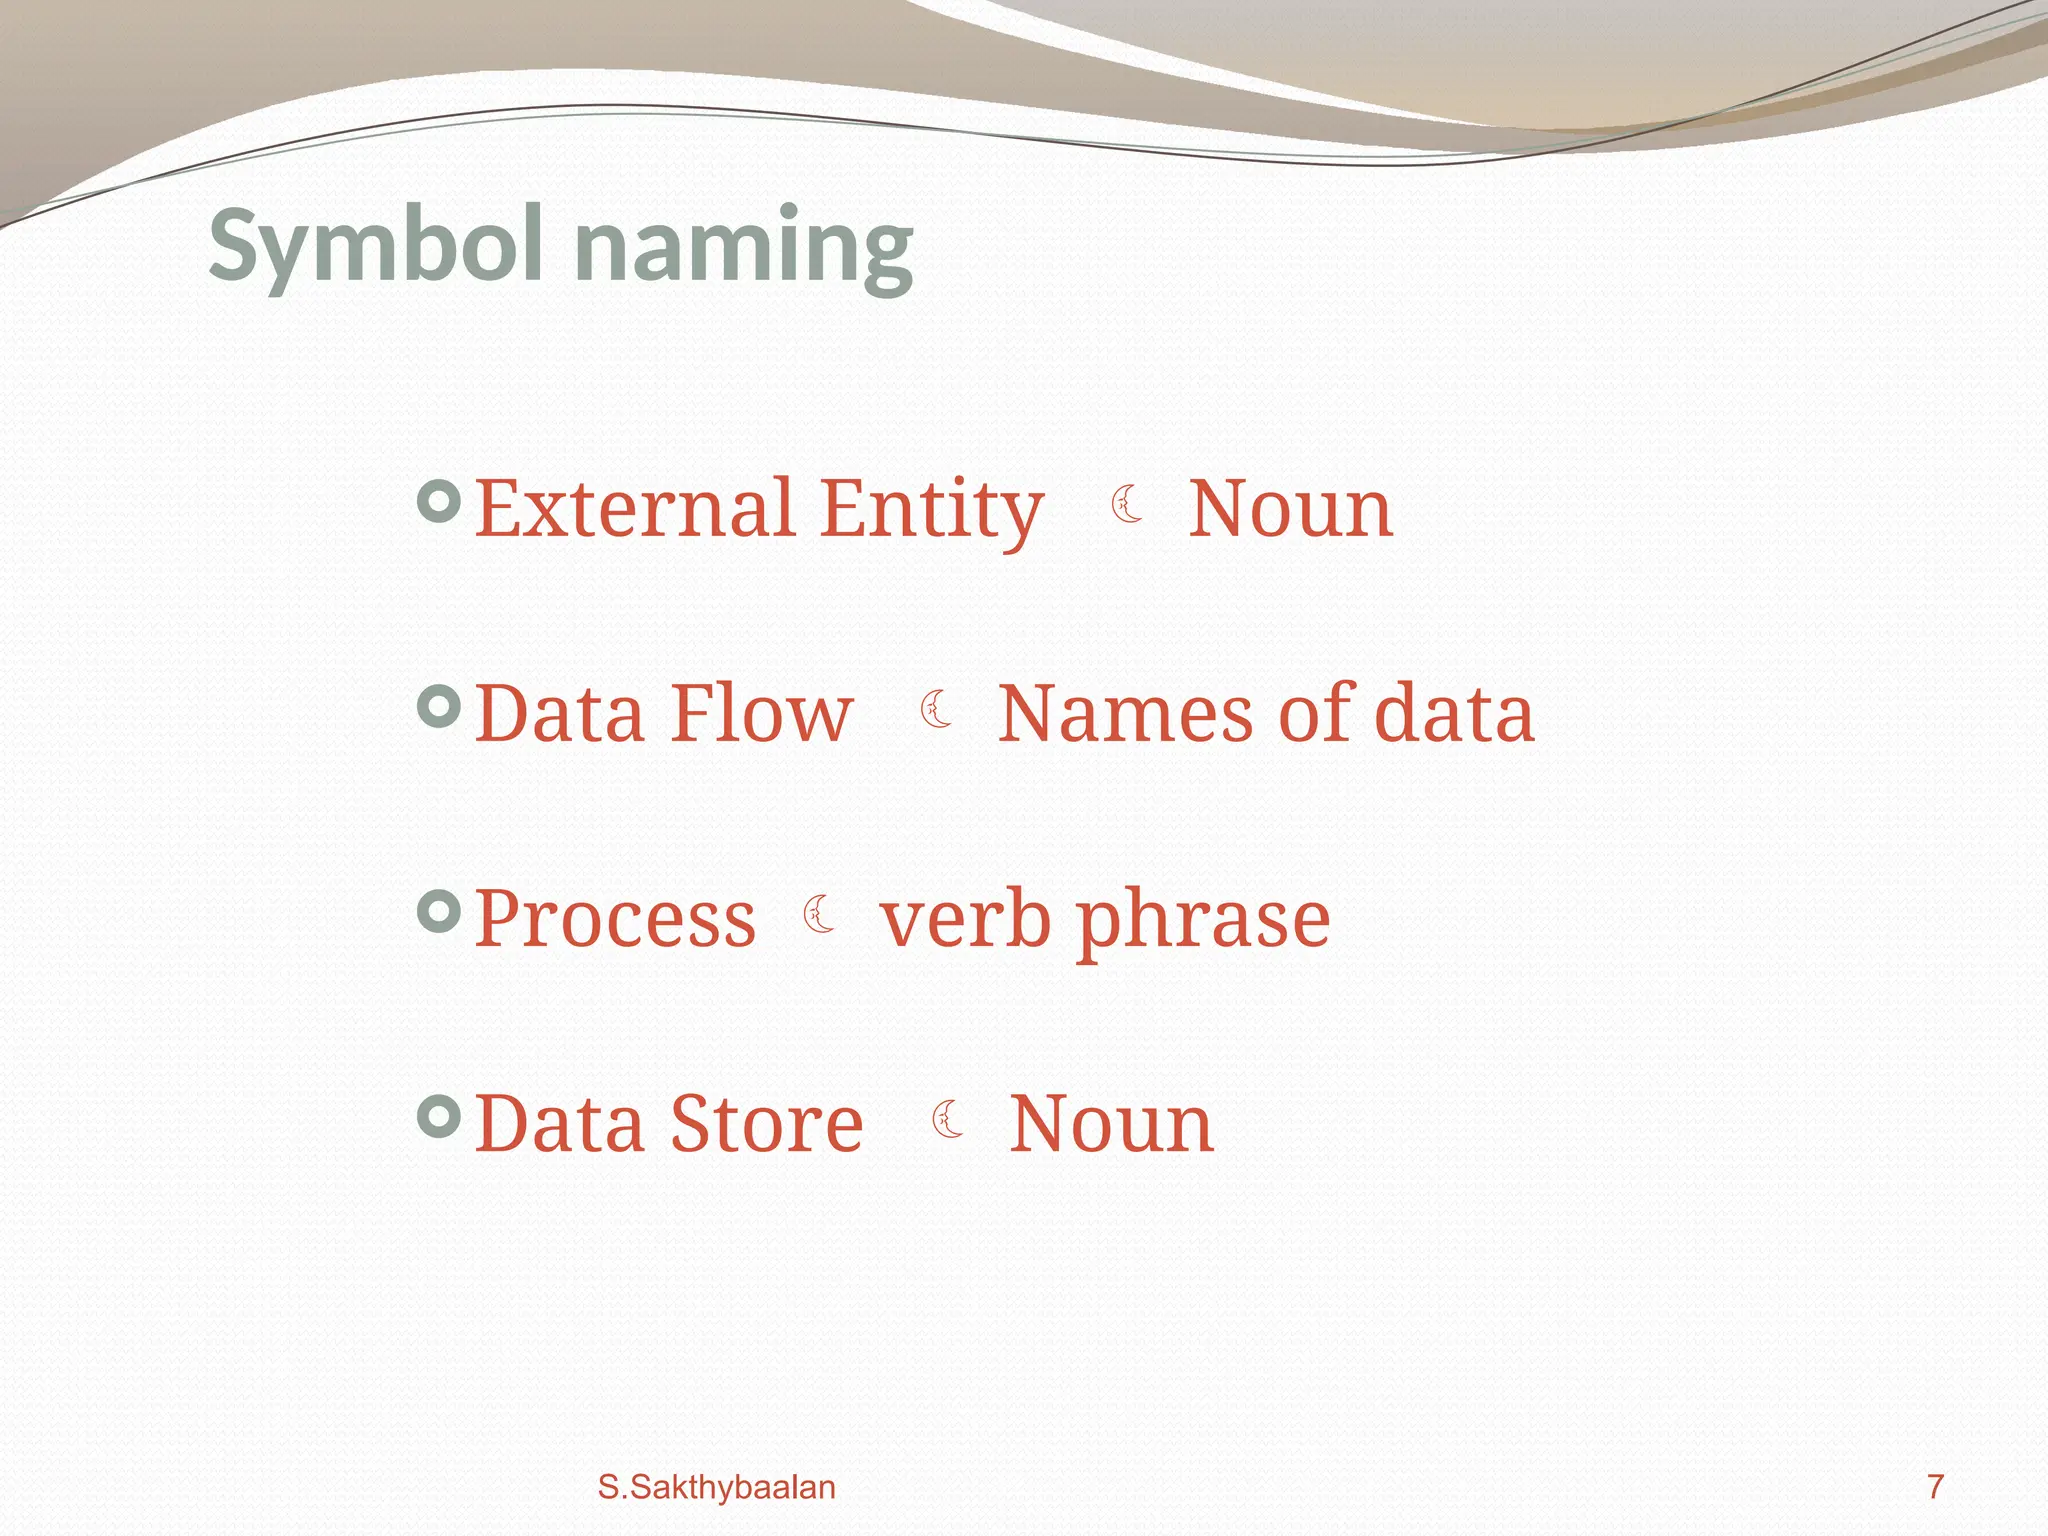
External Entity Noun
Data Flow Names of data
Process verb phrase
Data Store Noun
Symbol naming
S.Sakthybaalan
8.
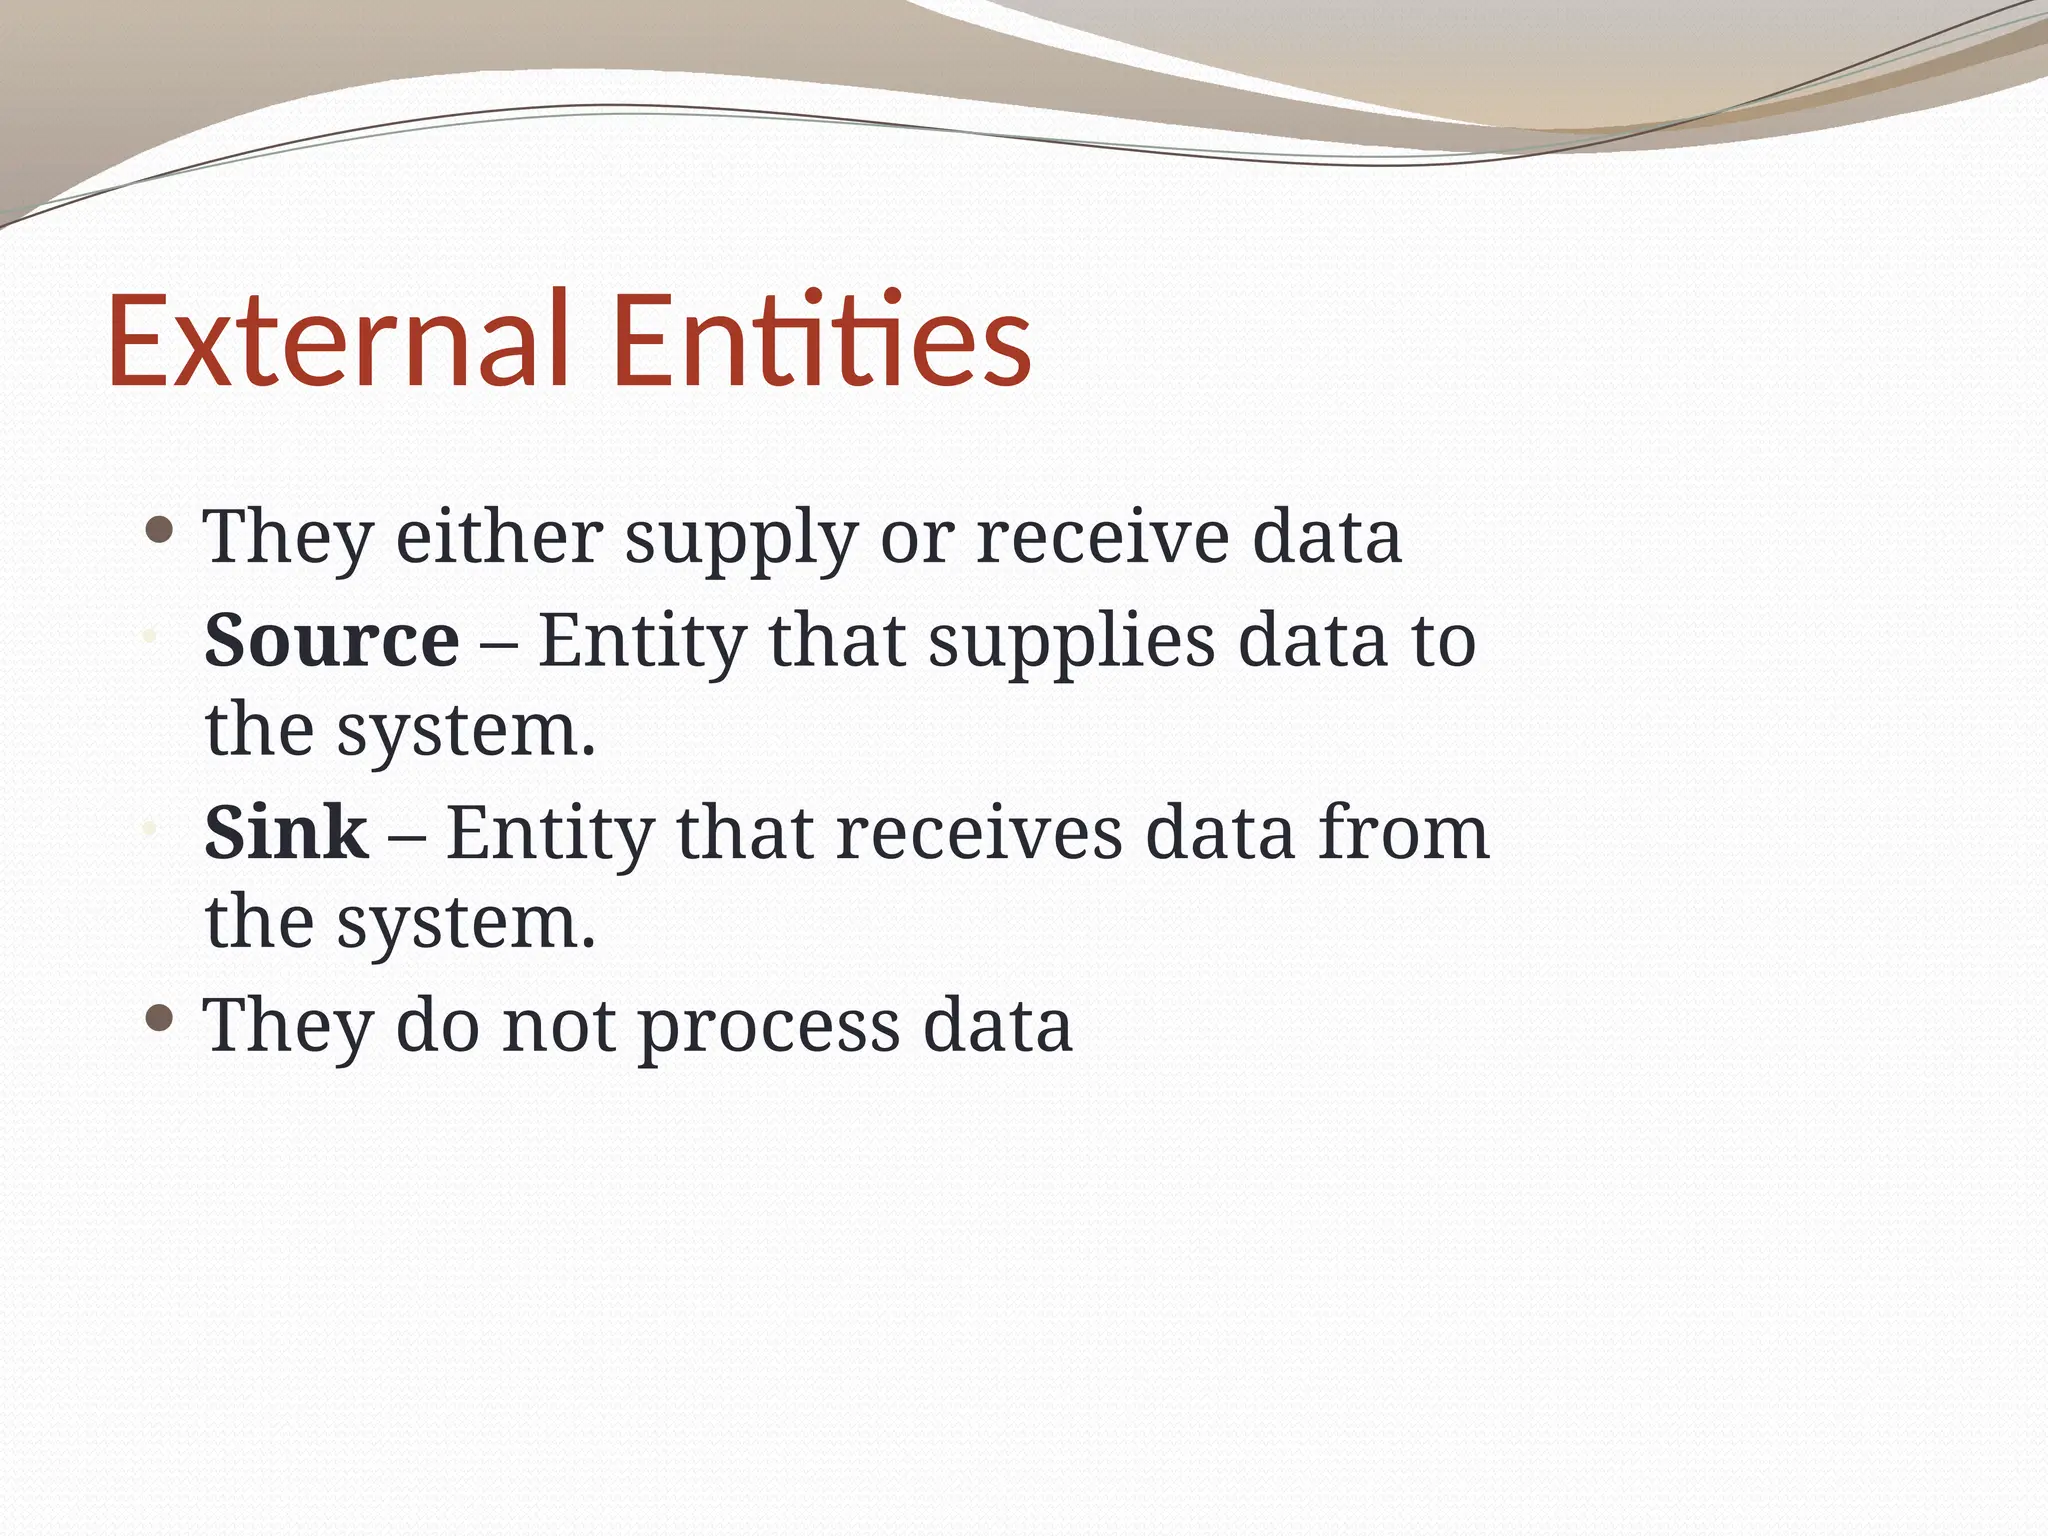
External Entities
Theyeither supply or receive data
• Source – Entity that supplies data to
the system.
• Sink – Entity that receives data from
the system.
They do not process data
9.
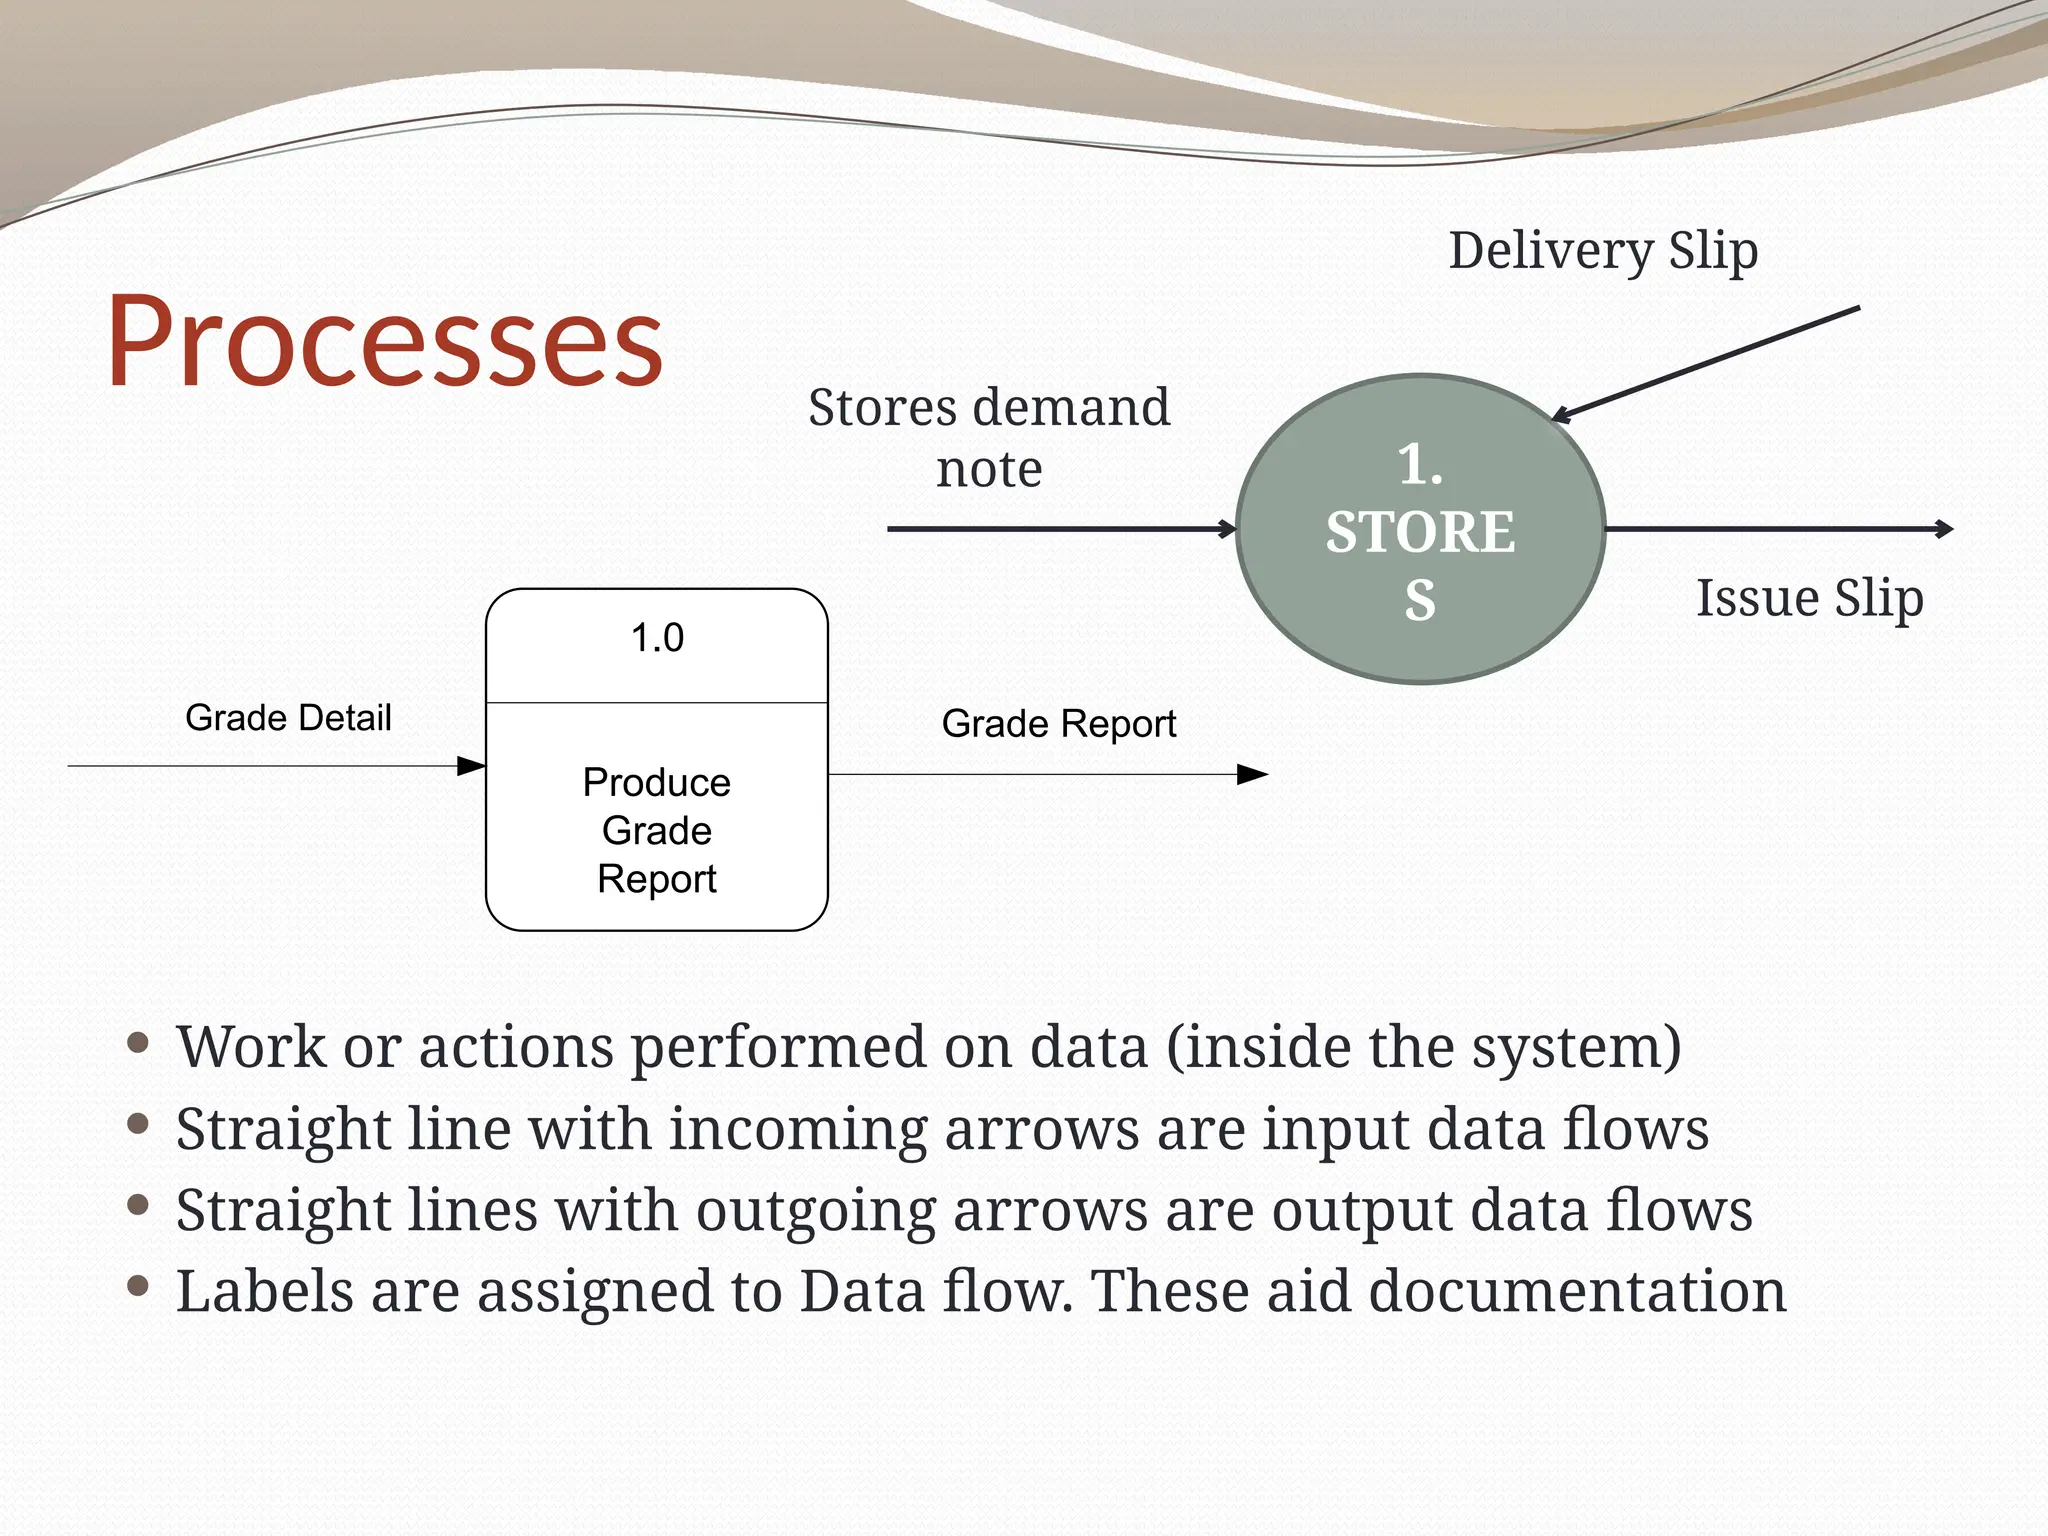
Processes
Work oractions performed on data (inside the system)
Straight line with incoming arrows are input data flows
Straight lines with outgoing arrows are output data flows
Labels are assigned to Data flow. These aid documentation
1.
STORE
S
Stores demand
note
Delivery Slip
Issue Slip
1.0
Produce
Grade
Report
Grade Detail Grade Report
10.
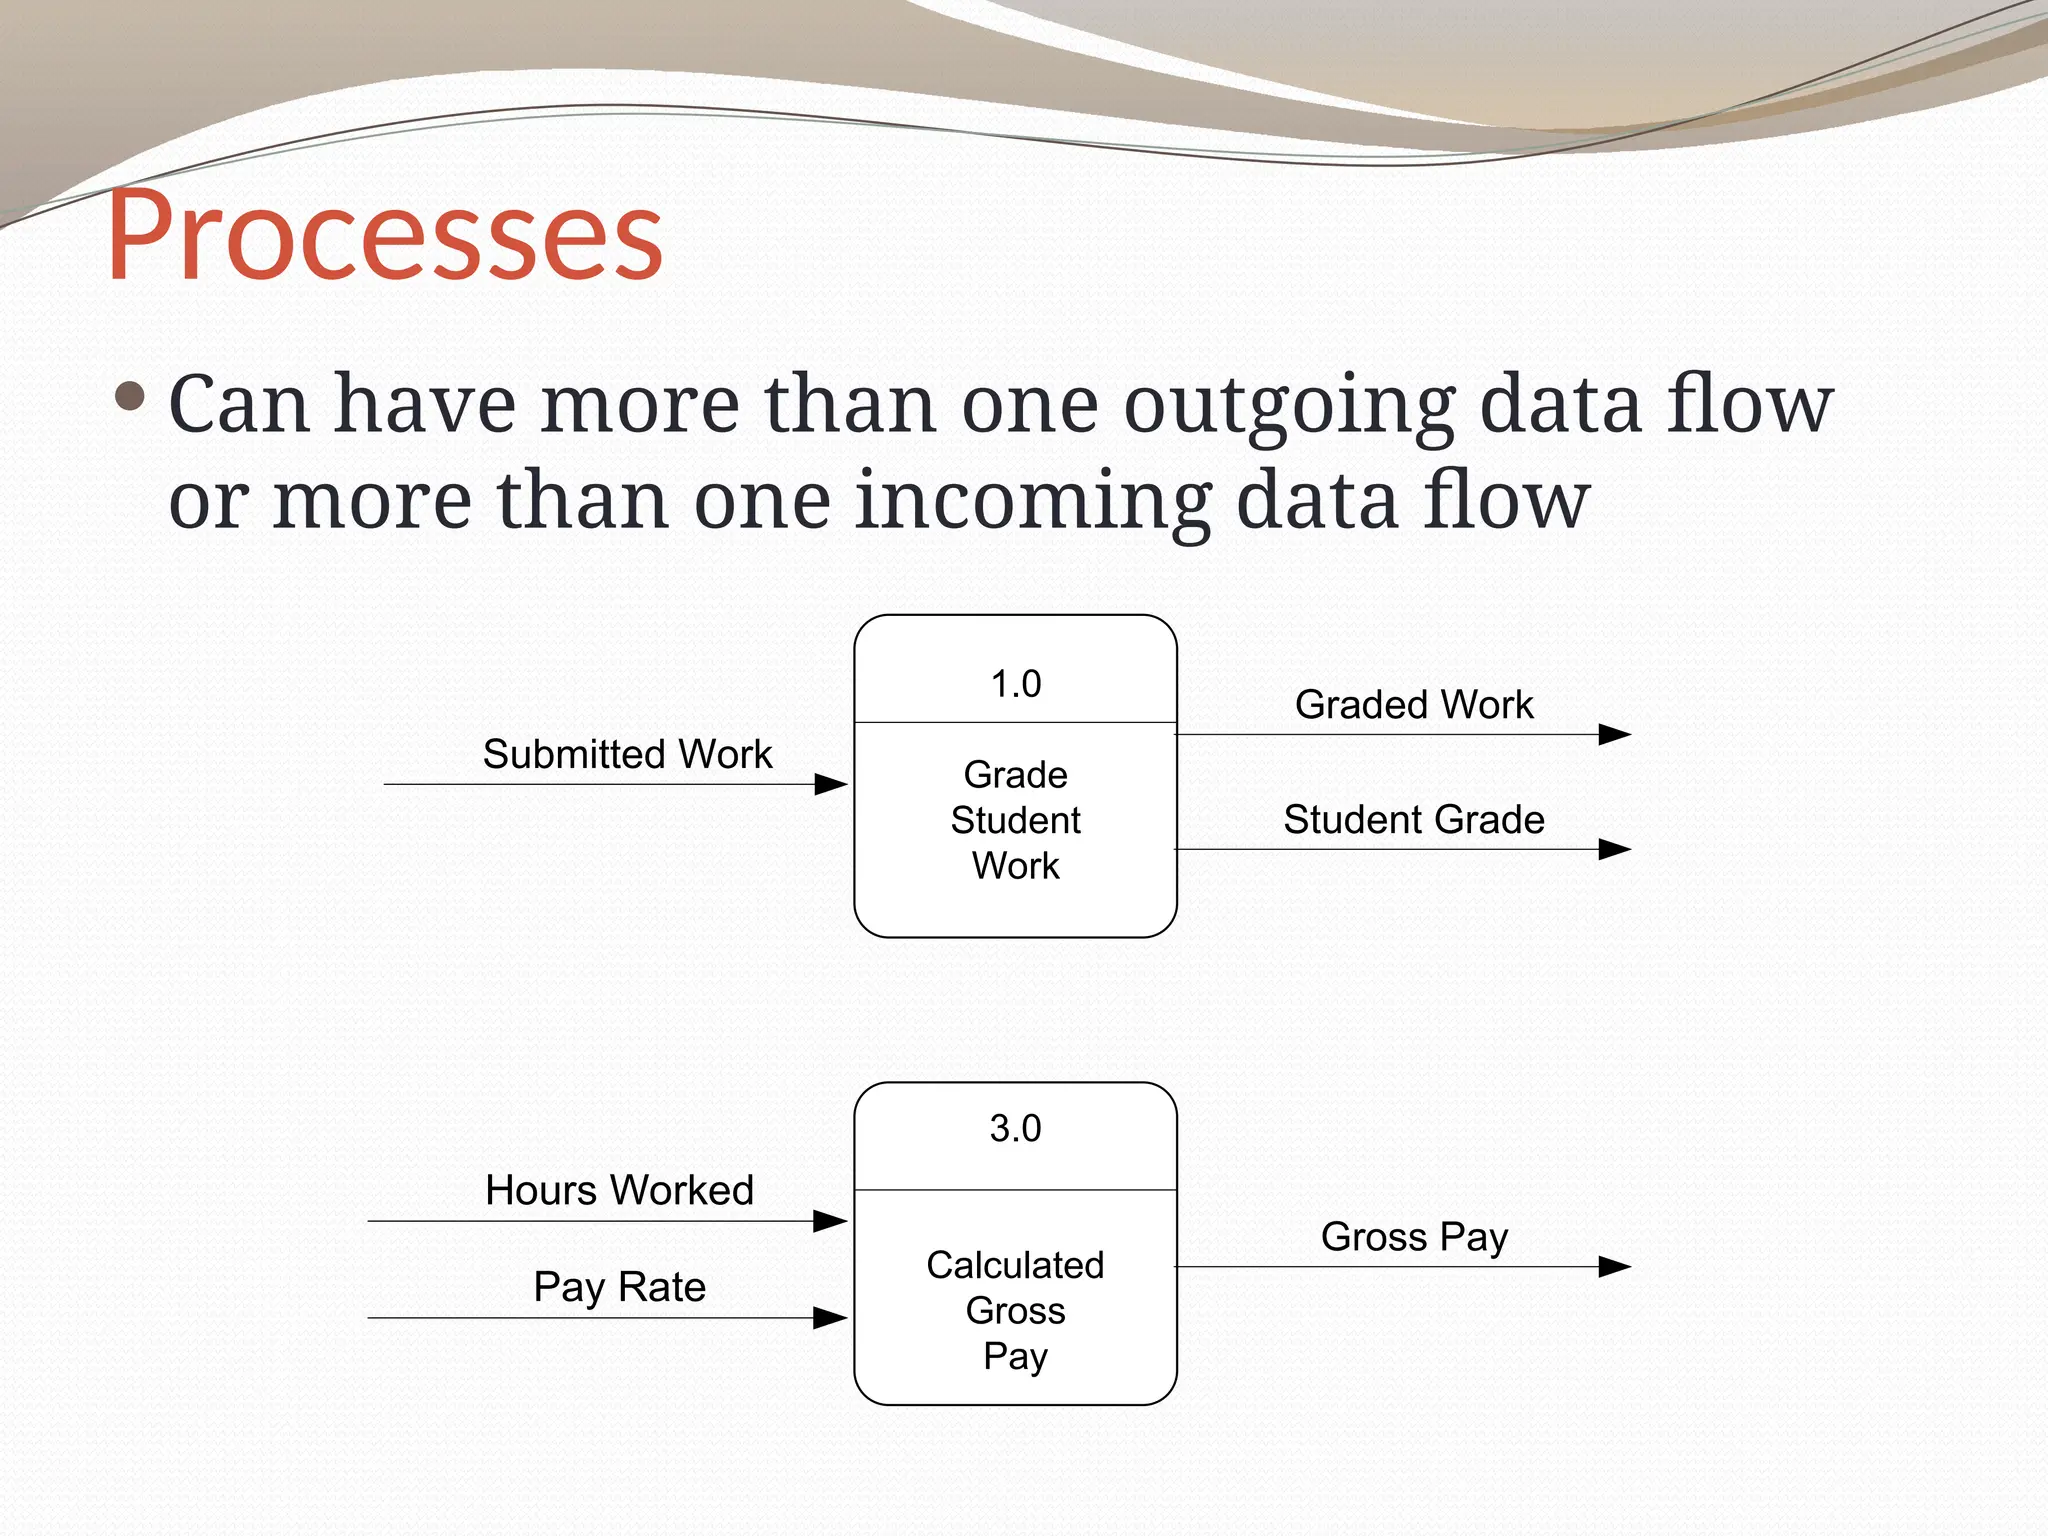
Processes
Can havemore than one outgoing data flow
or more than one incoming data flow
1.0
Grade
Student
Work
Submitted Work
Graded Work
Student Grade
3.0
Calculated
Gross
Pay
Hours Worked
Pay Rate
Gross Pay
11.
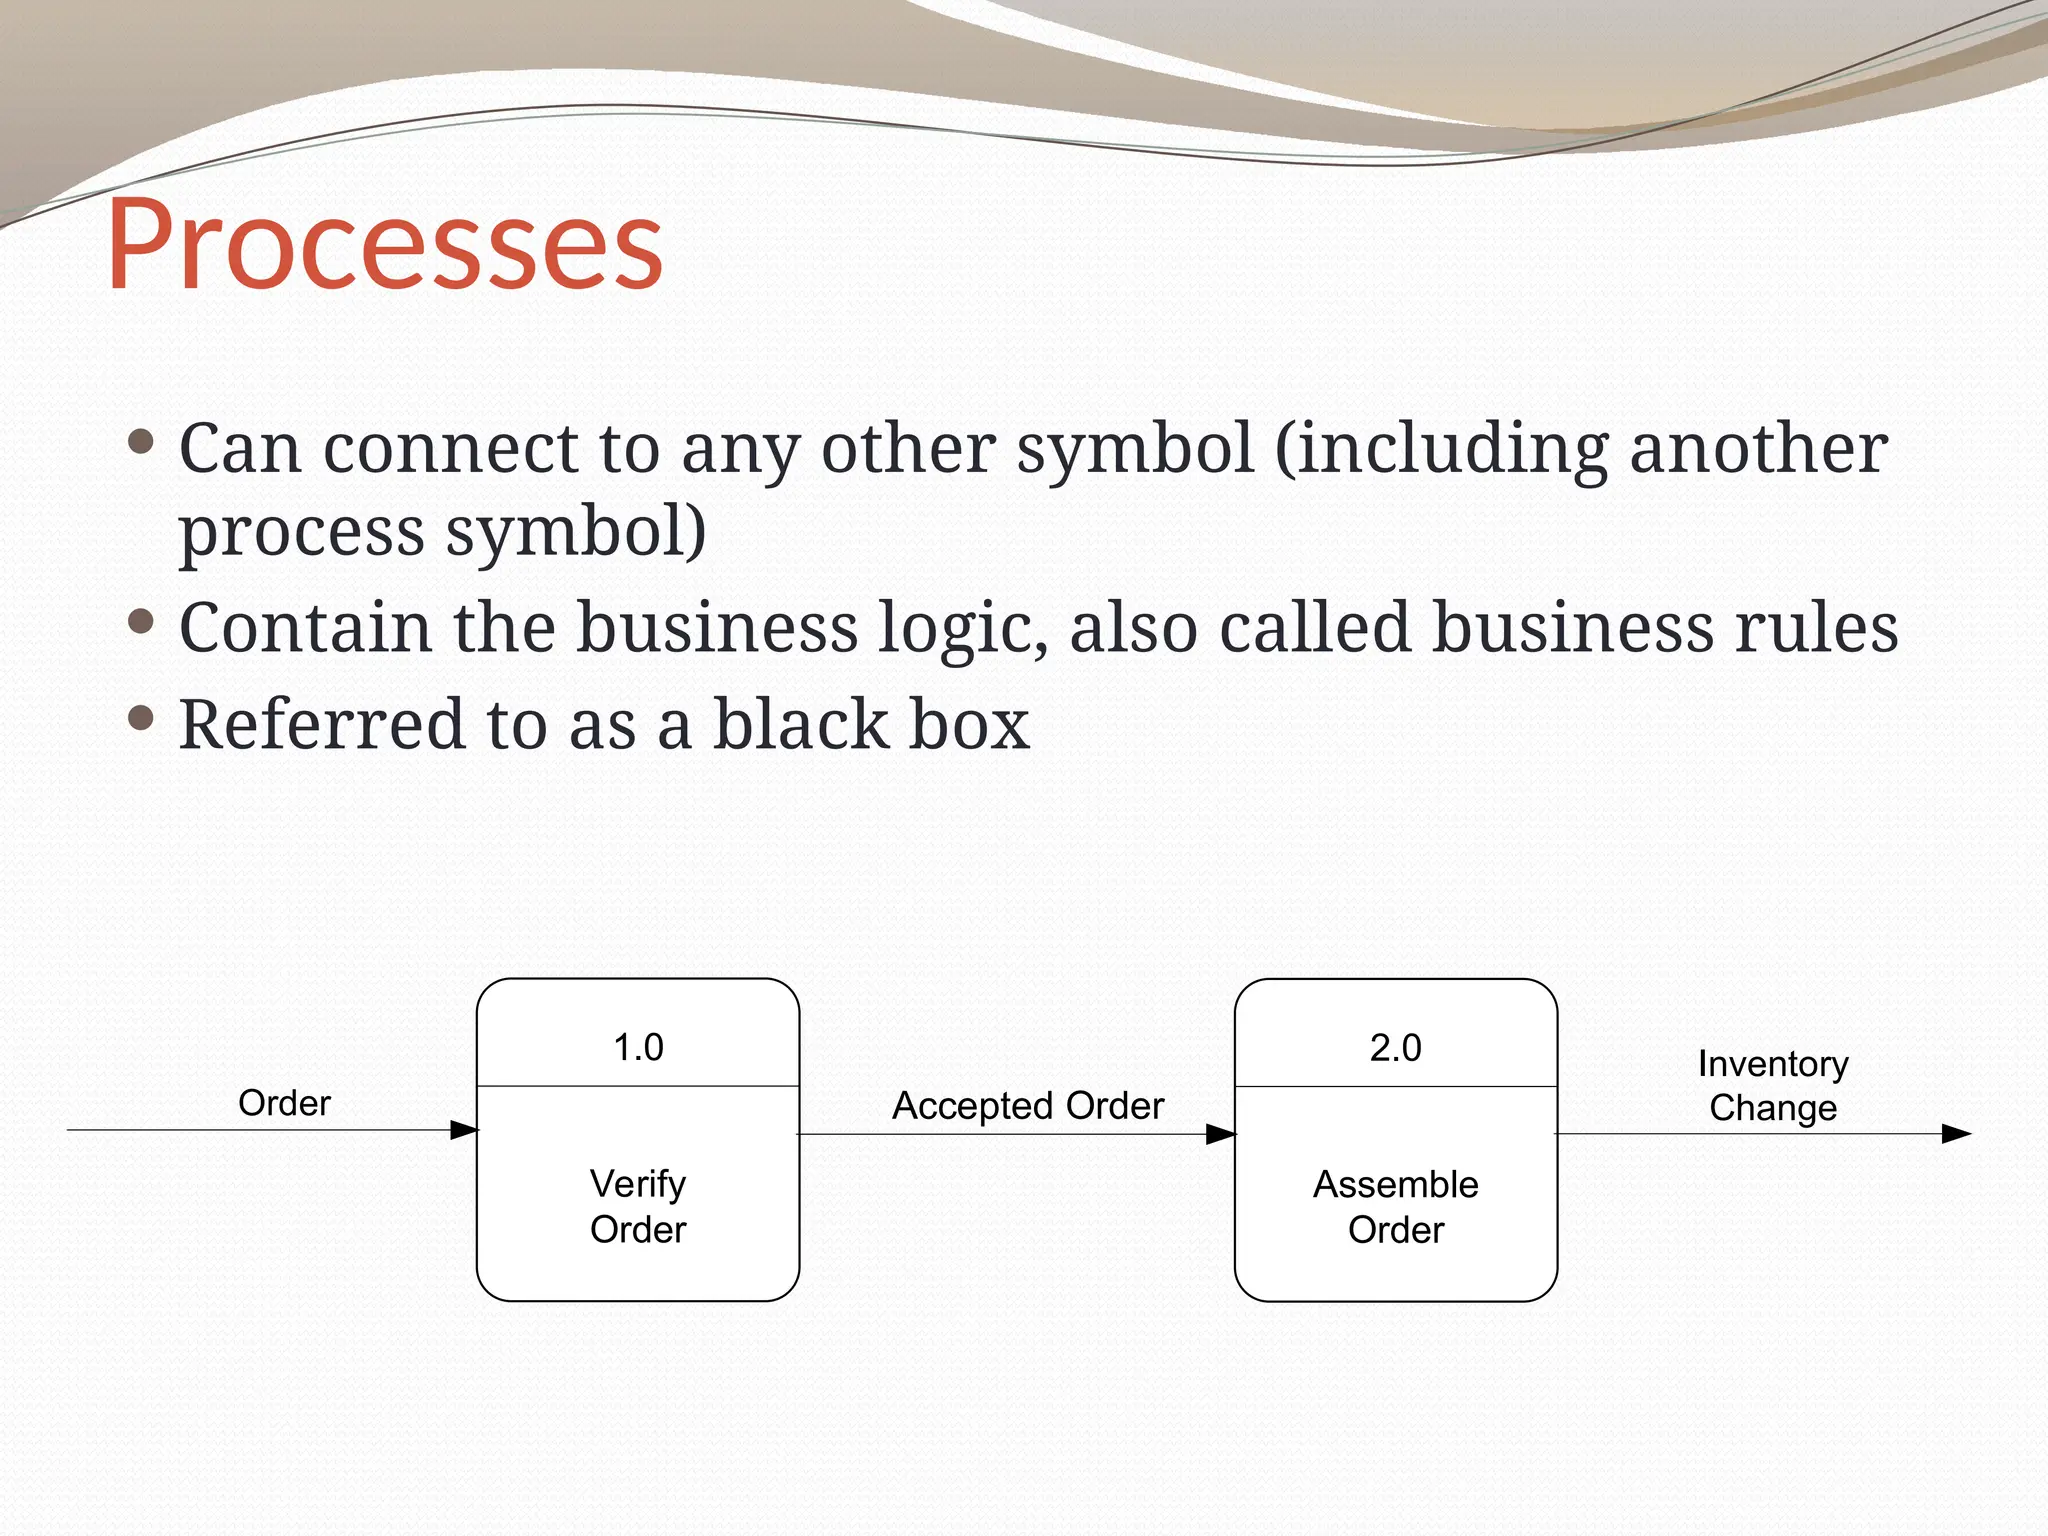
Processes
Can connectto any other symbol (including another
process symbol)
Contain the business logic, also called business rules
Referred to as a black box
1.0
Verify
Order
2.0
Assemble
Order
Order Accepted Order
Inventory
Change
12.
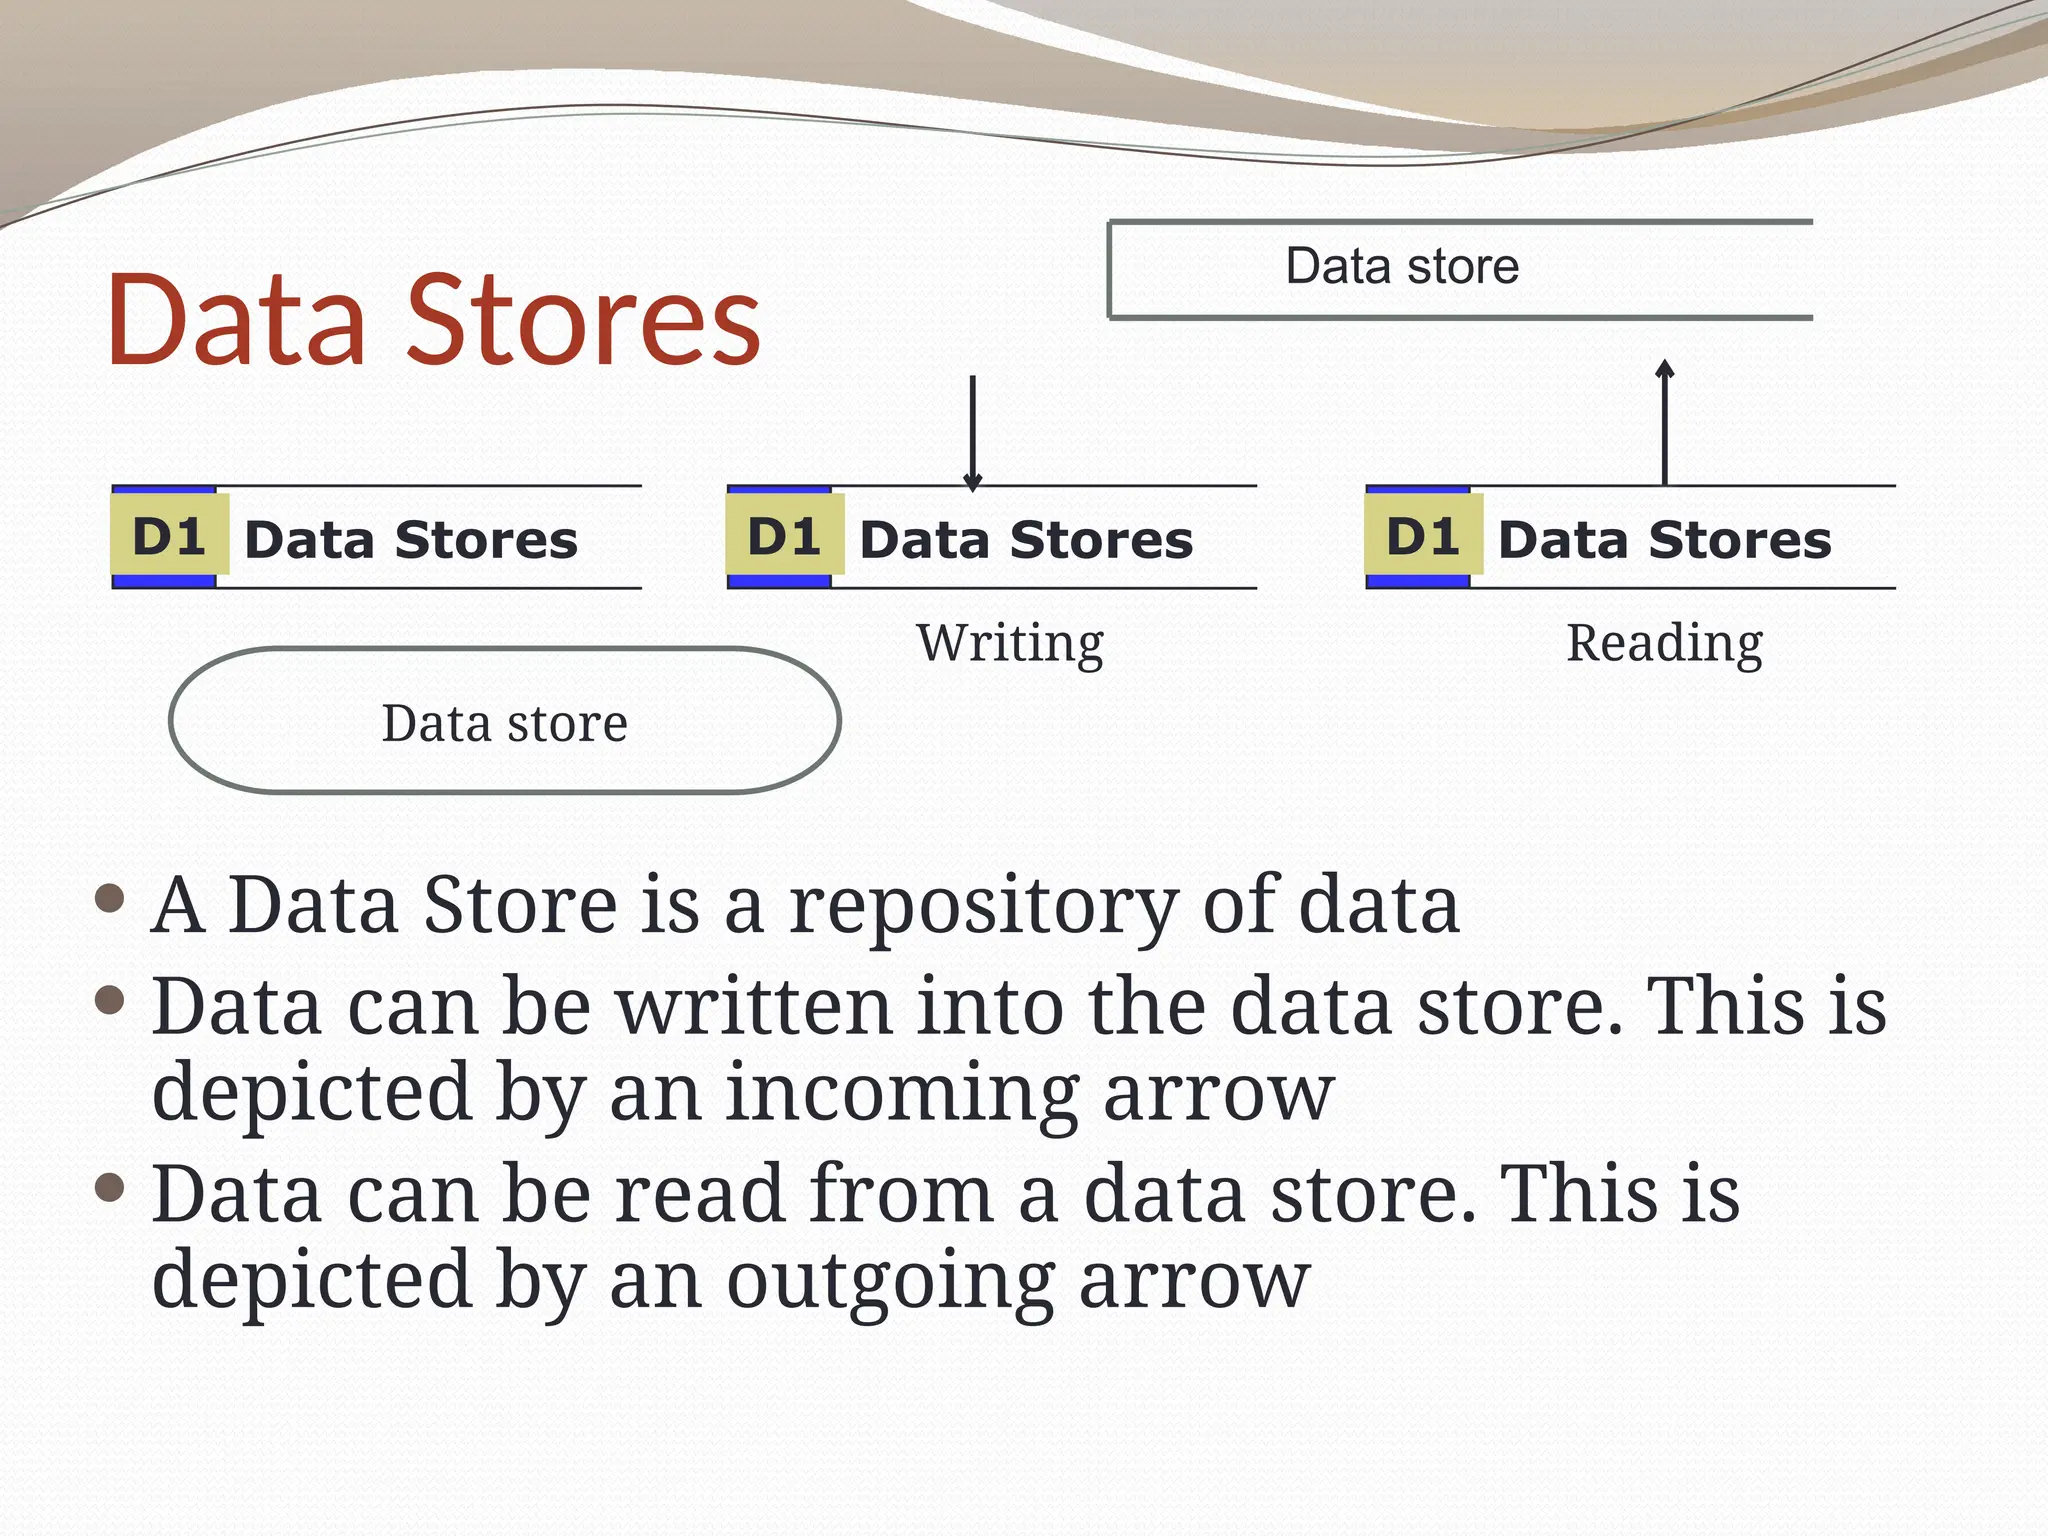
Data Stores
AData Store is a repository of data
Data can be written into the data store. This is
depicted by an incoming arrow
Data can be read from a data store. This is
depicted by an outgoing arrow
Data Stores
D1 Data Stores
D1 Data Stores
D1
Writing Reading
Data store
Data store
13.
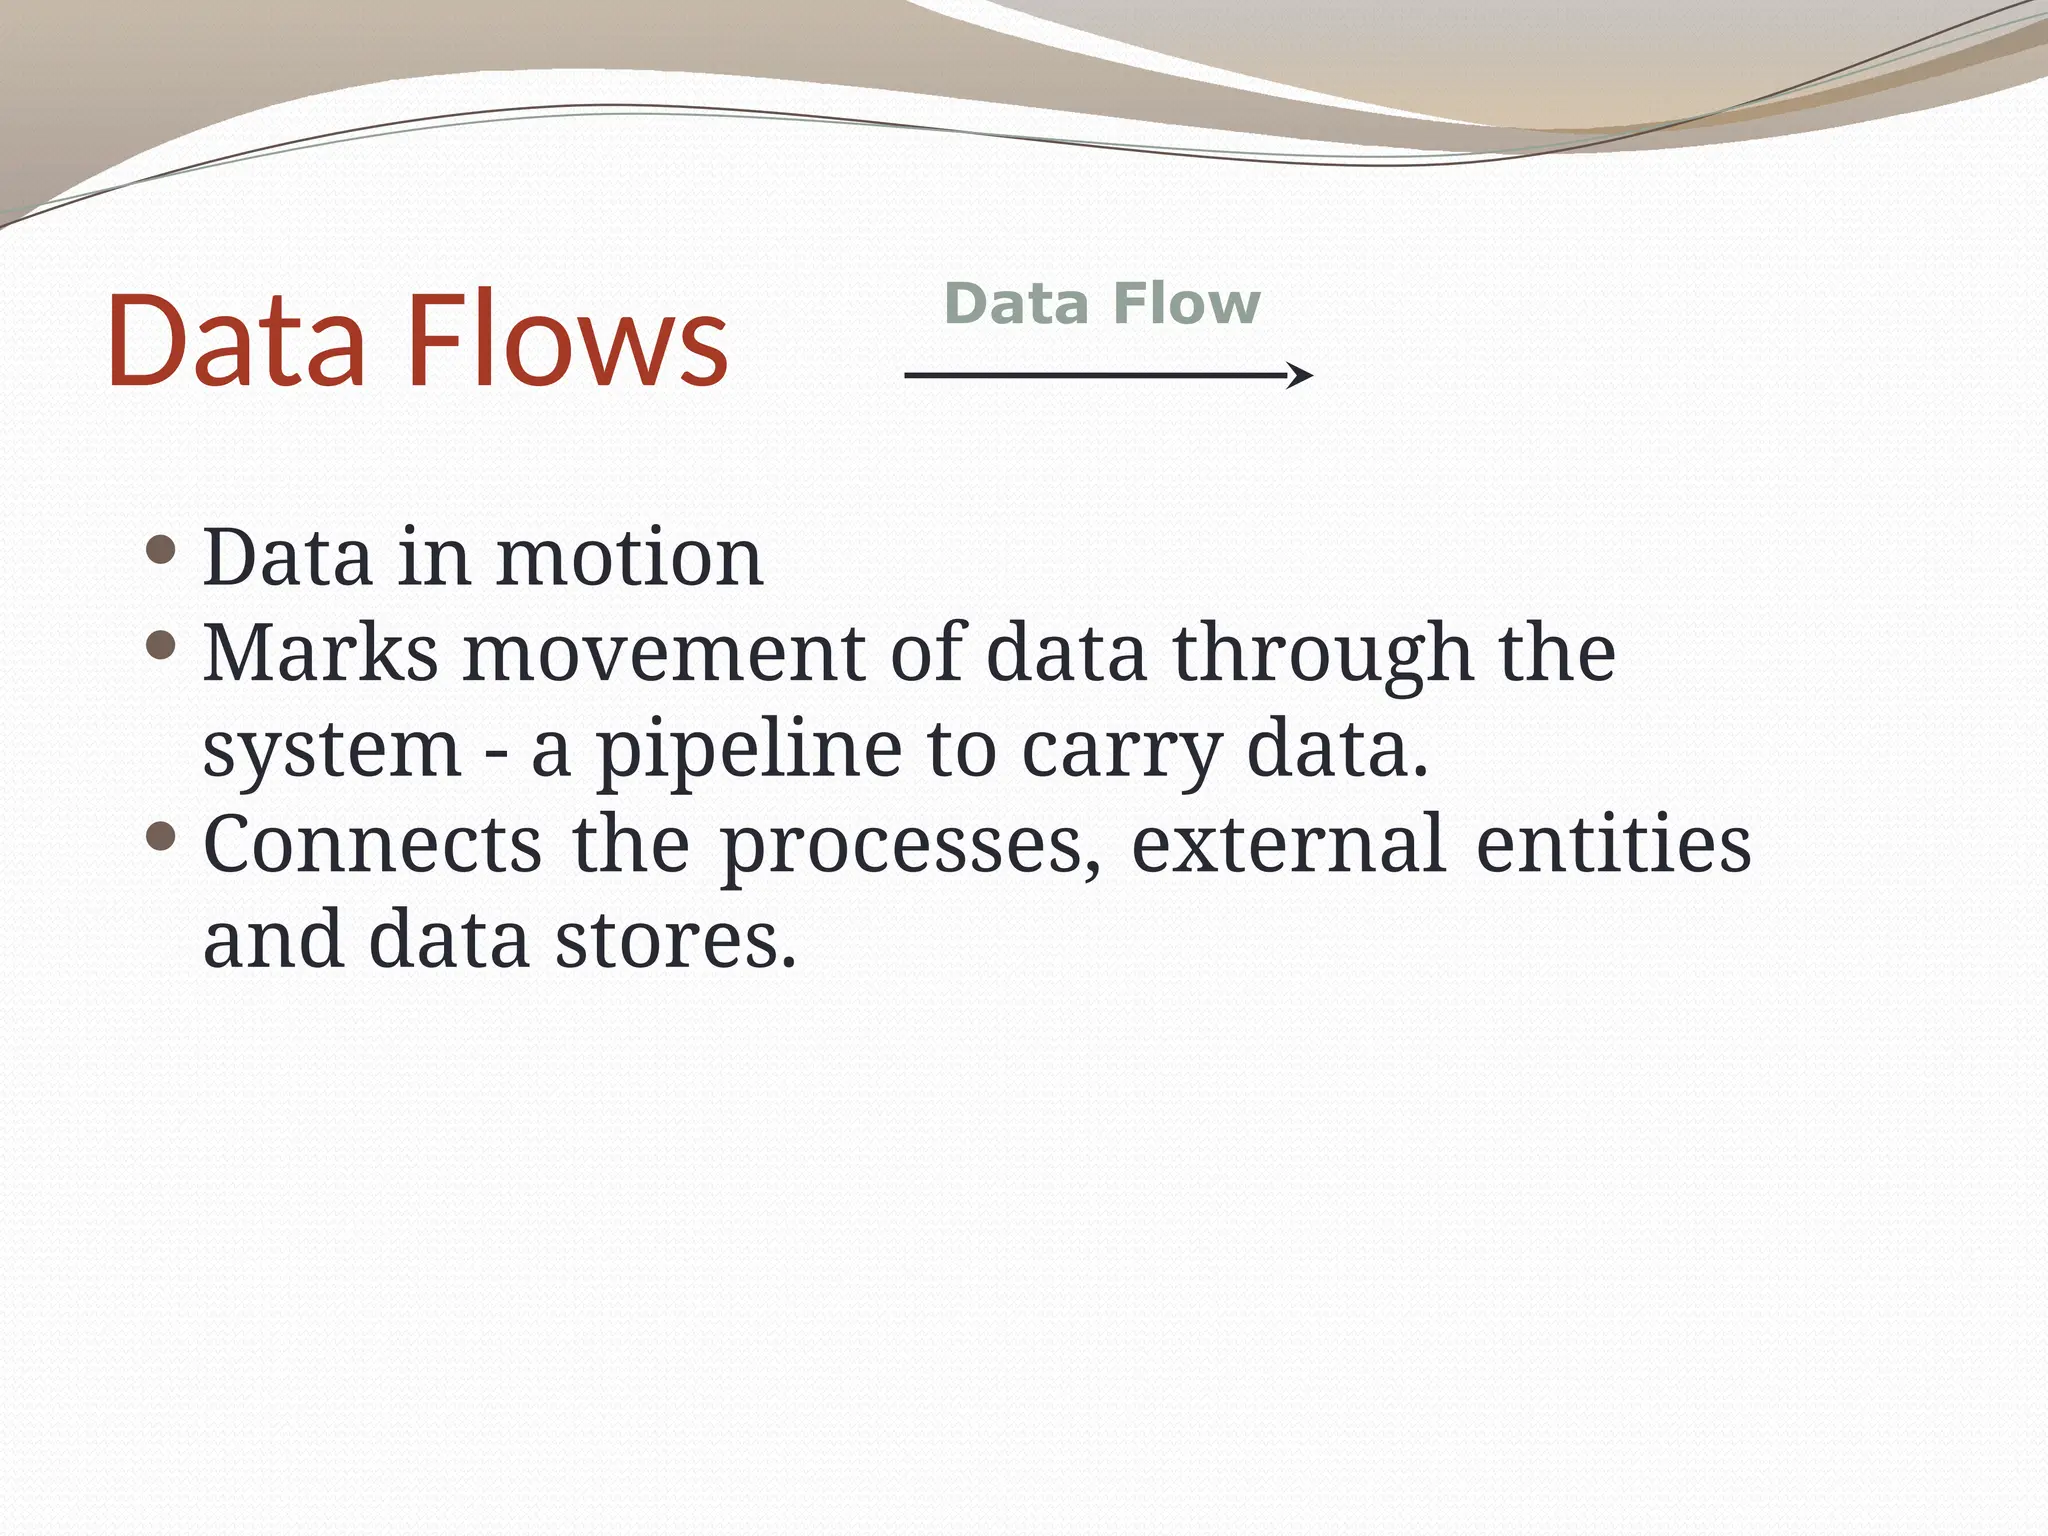
Data Flows
Datain motion
Marks movement of data through the
system - a pipeline to carry data.
Connects the processes, external entities
and data stores.
Data Flow
14.
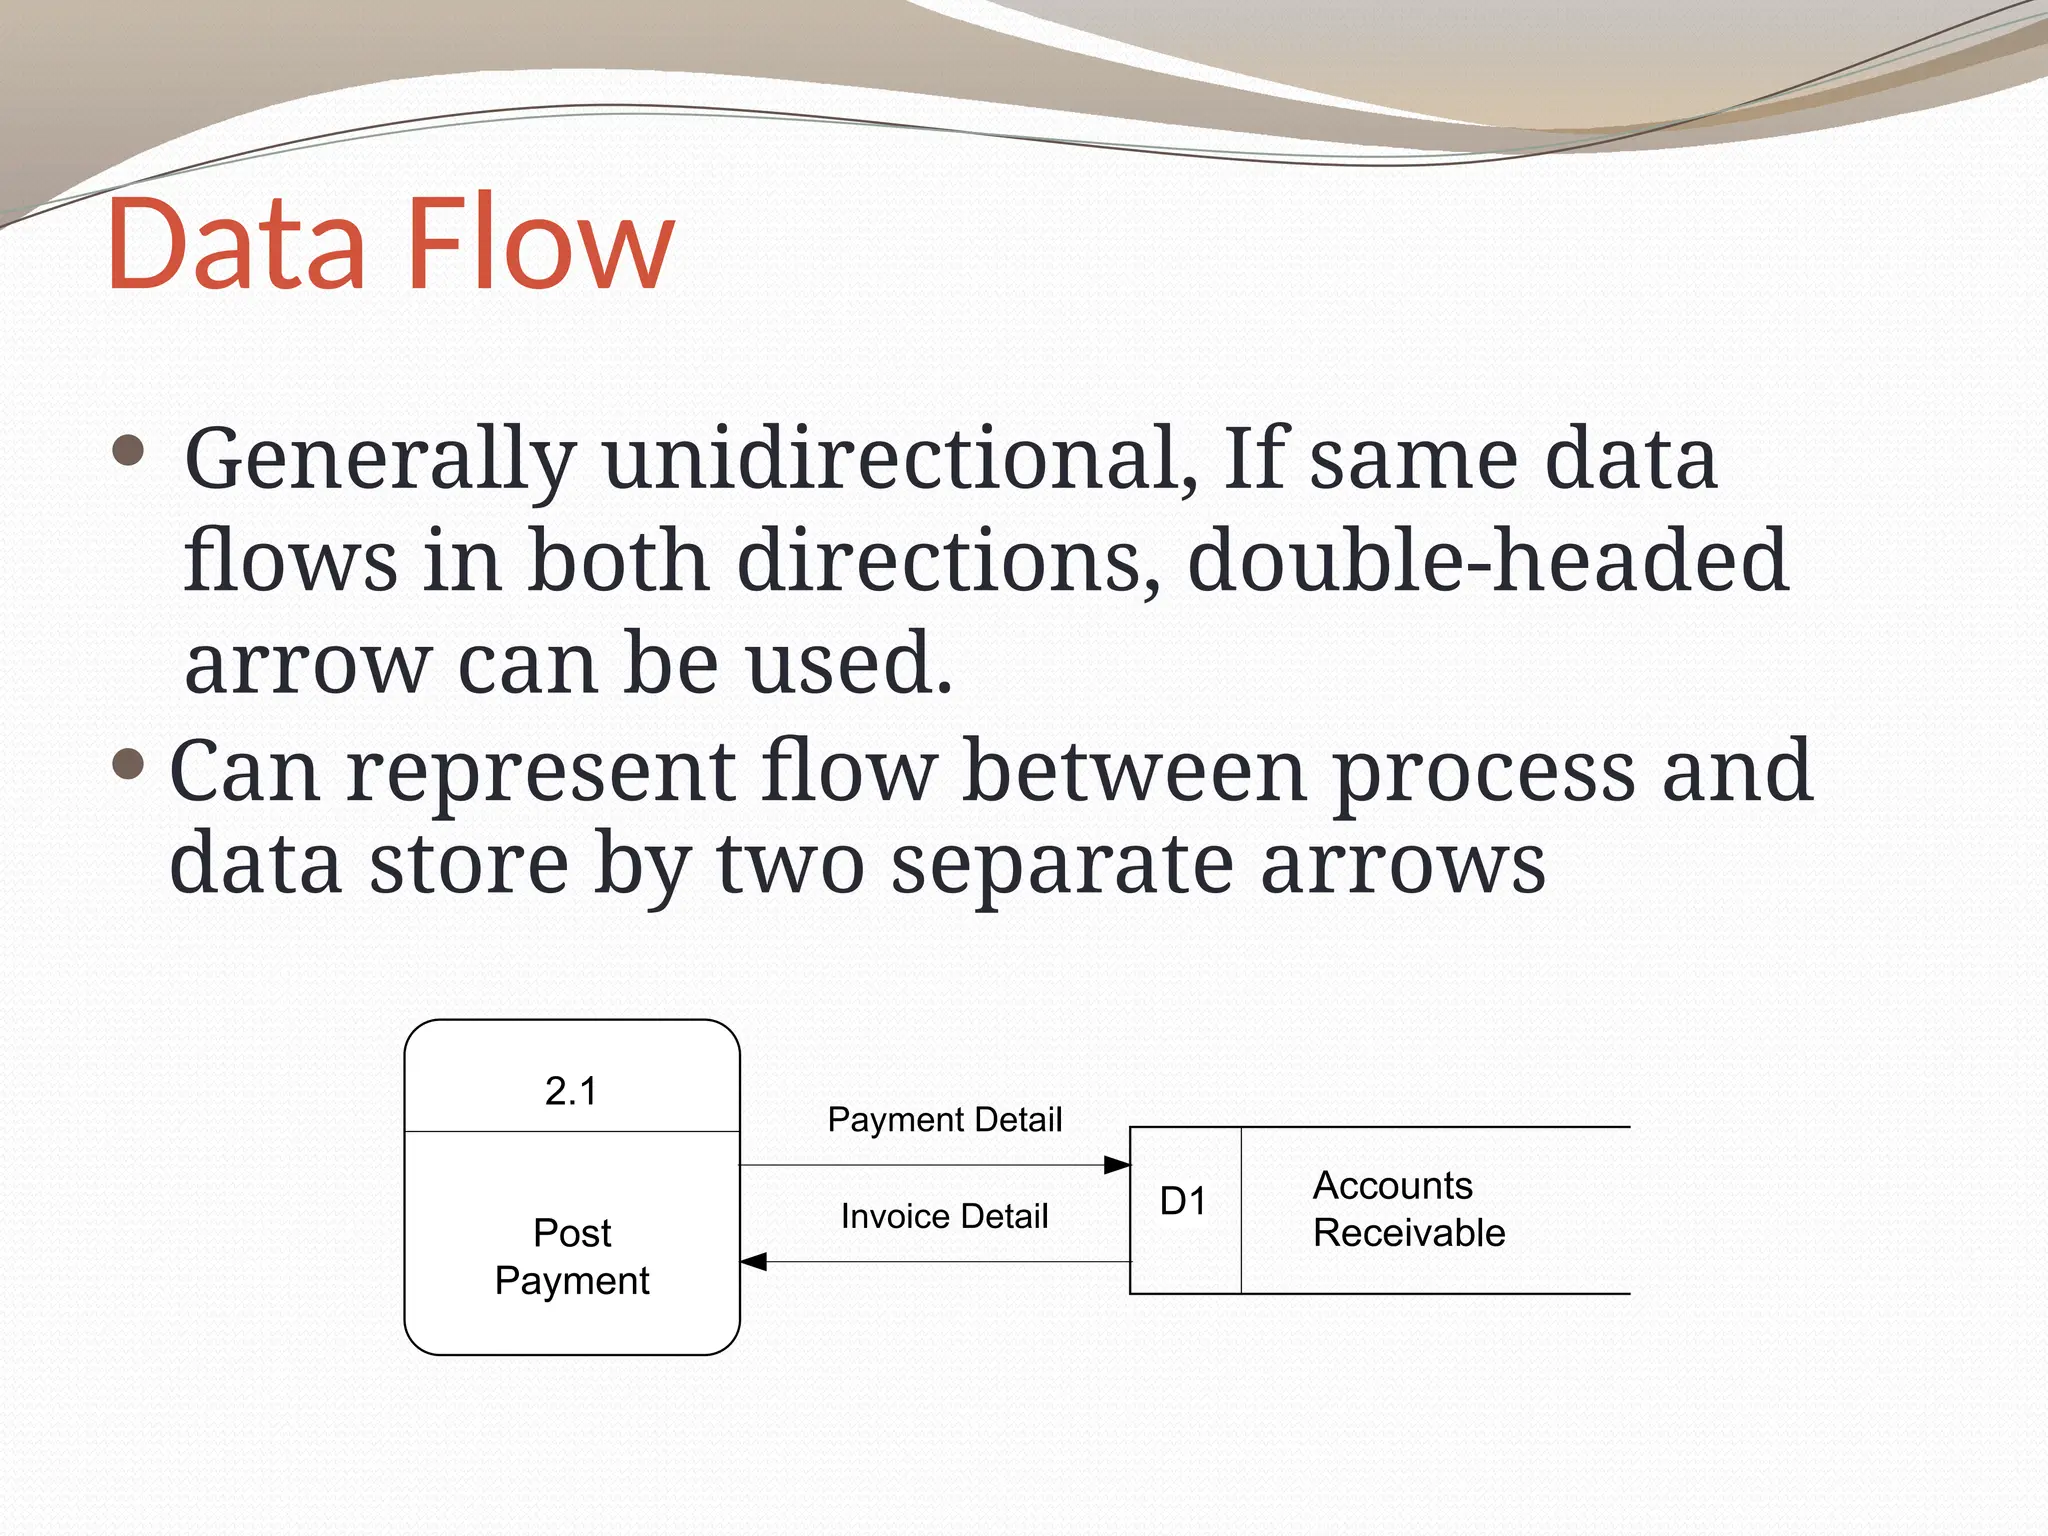
Data Flow
Generallyunidirectional, If same data
flows in both directions, double-headed
arrow can be used.
Can represent flow between process and
data store by two separate arrows
2.1
Post
Payment
Accounts
Receivable
D1
Payment Detail
Invoice Detail
15.
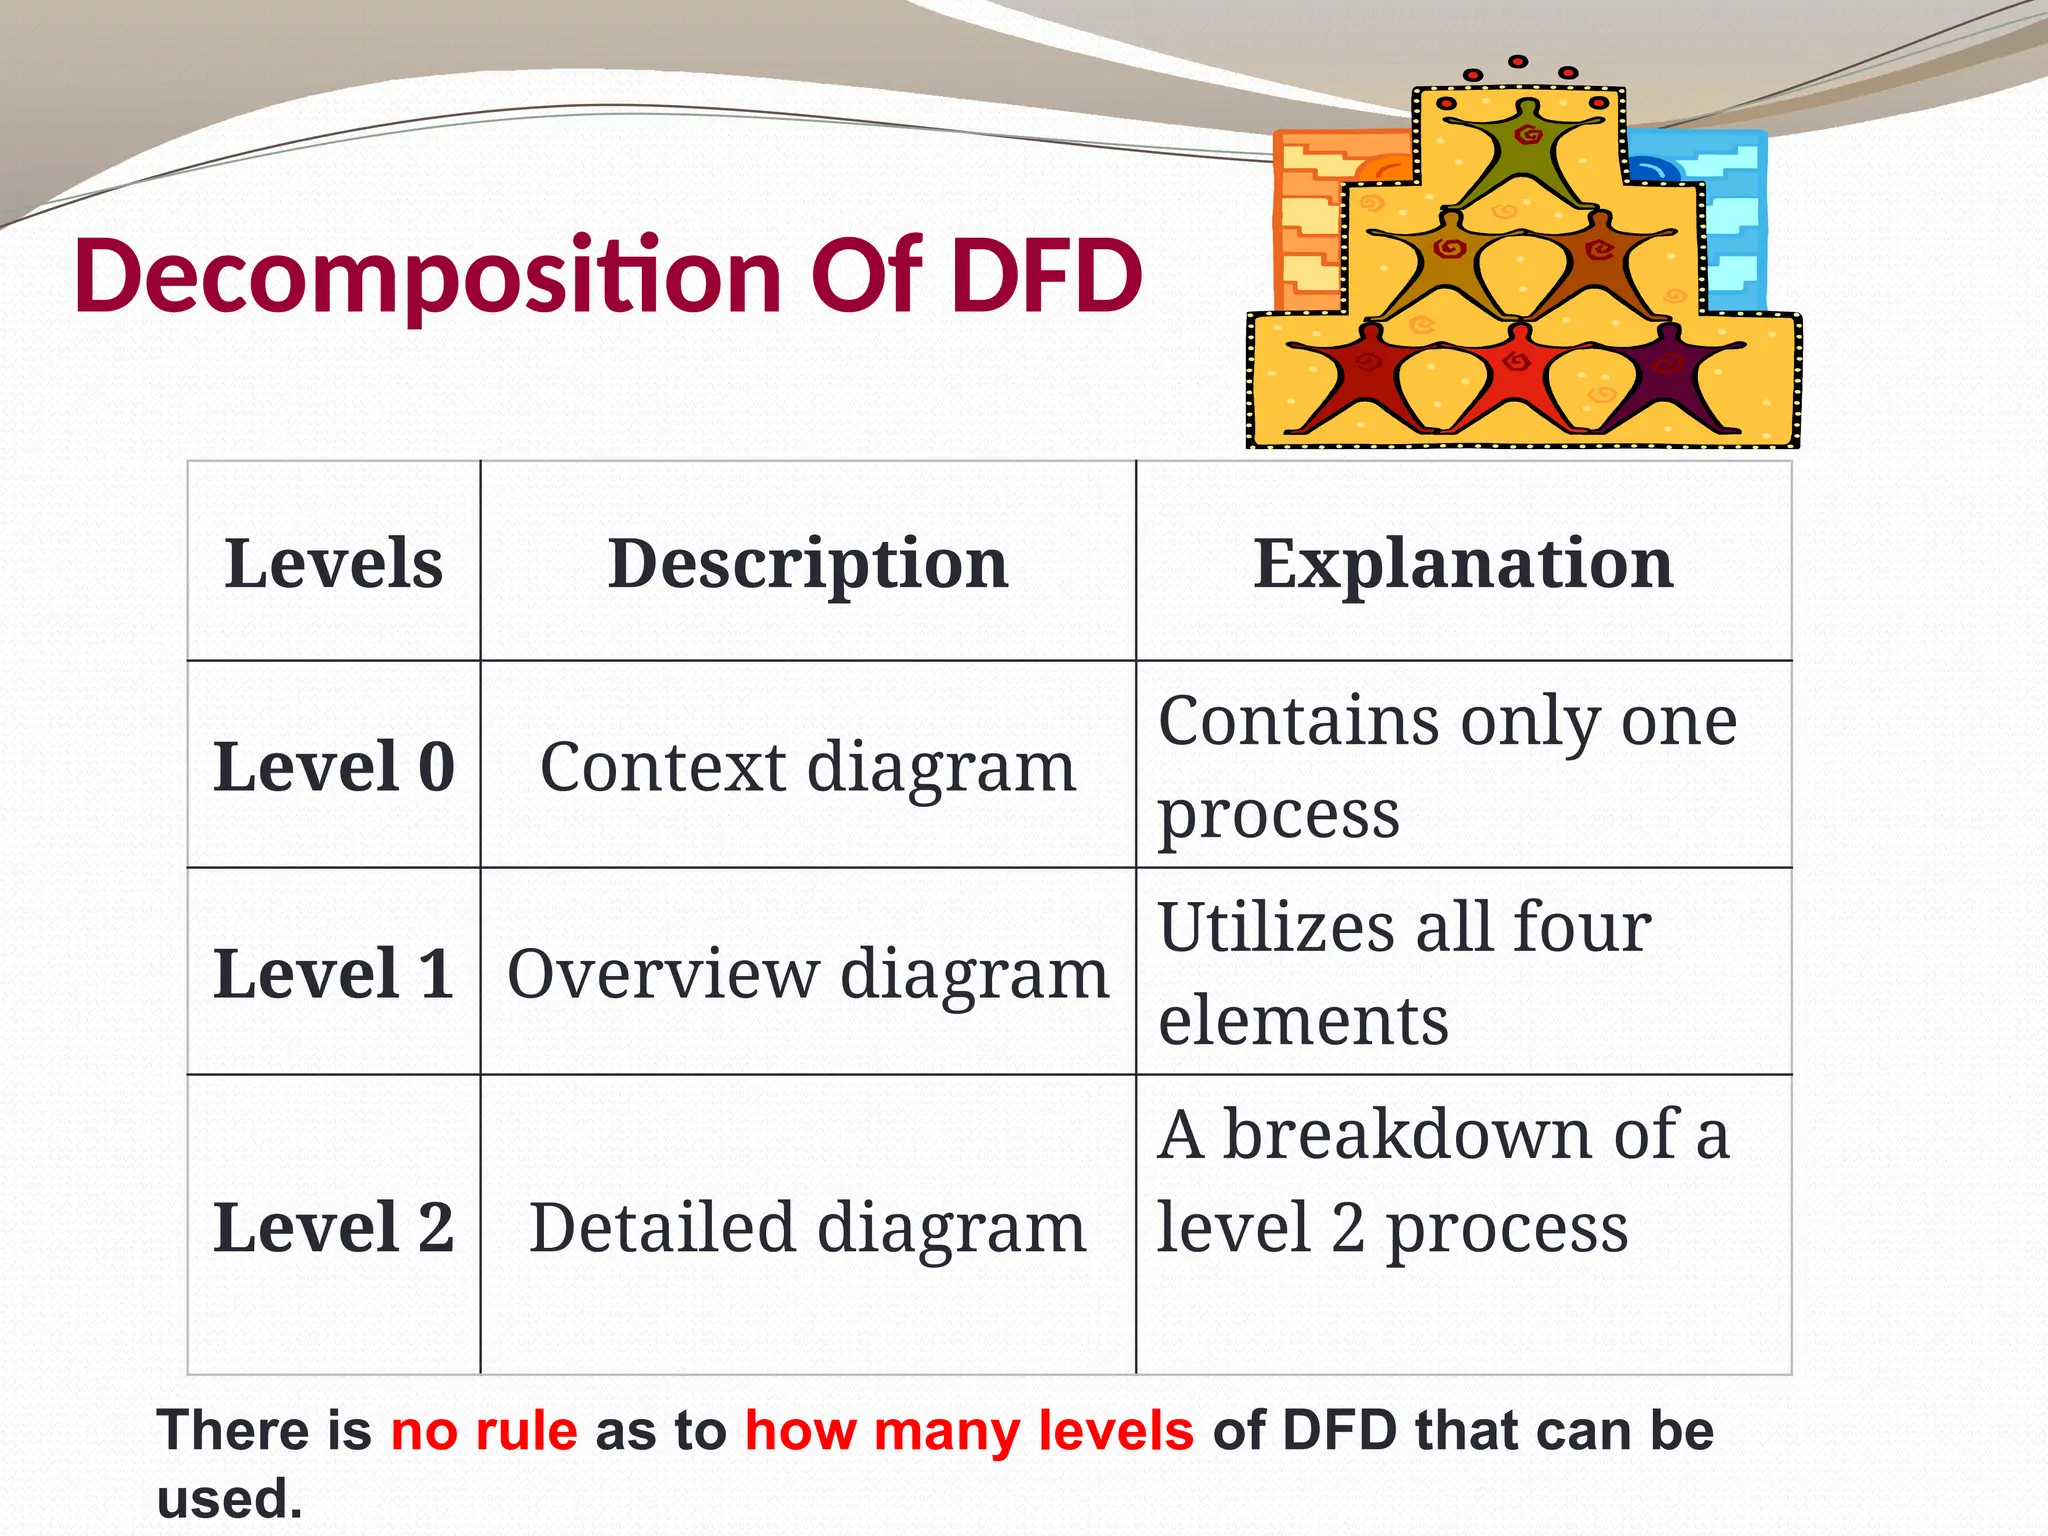
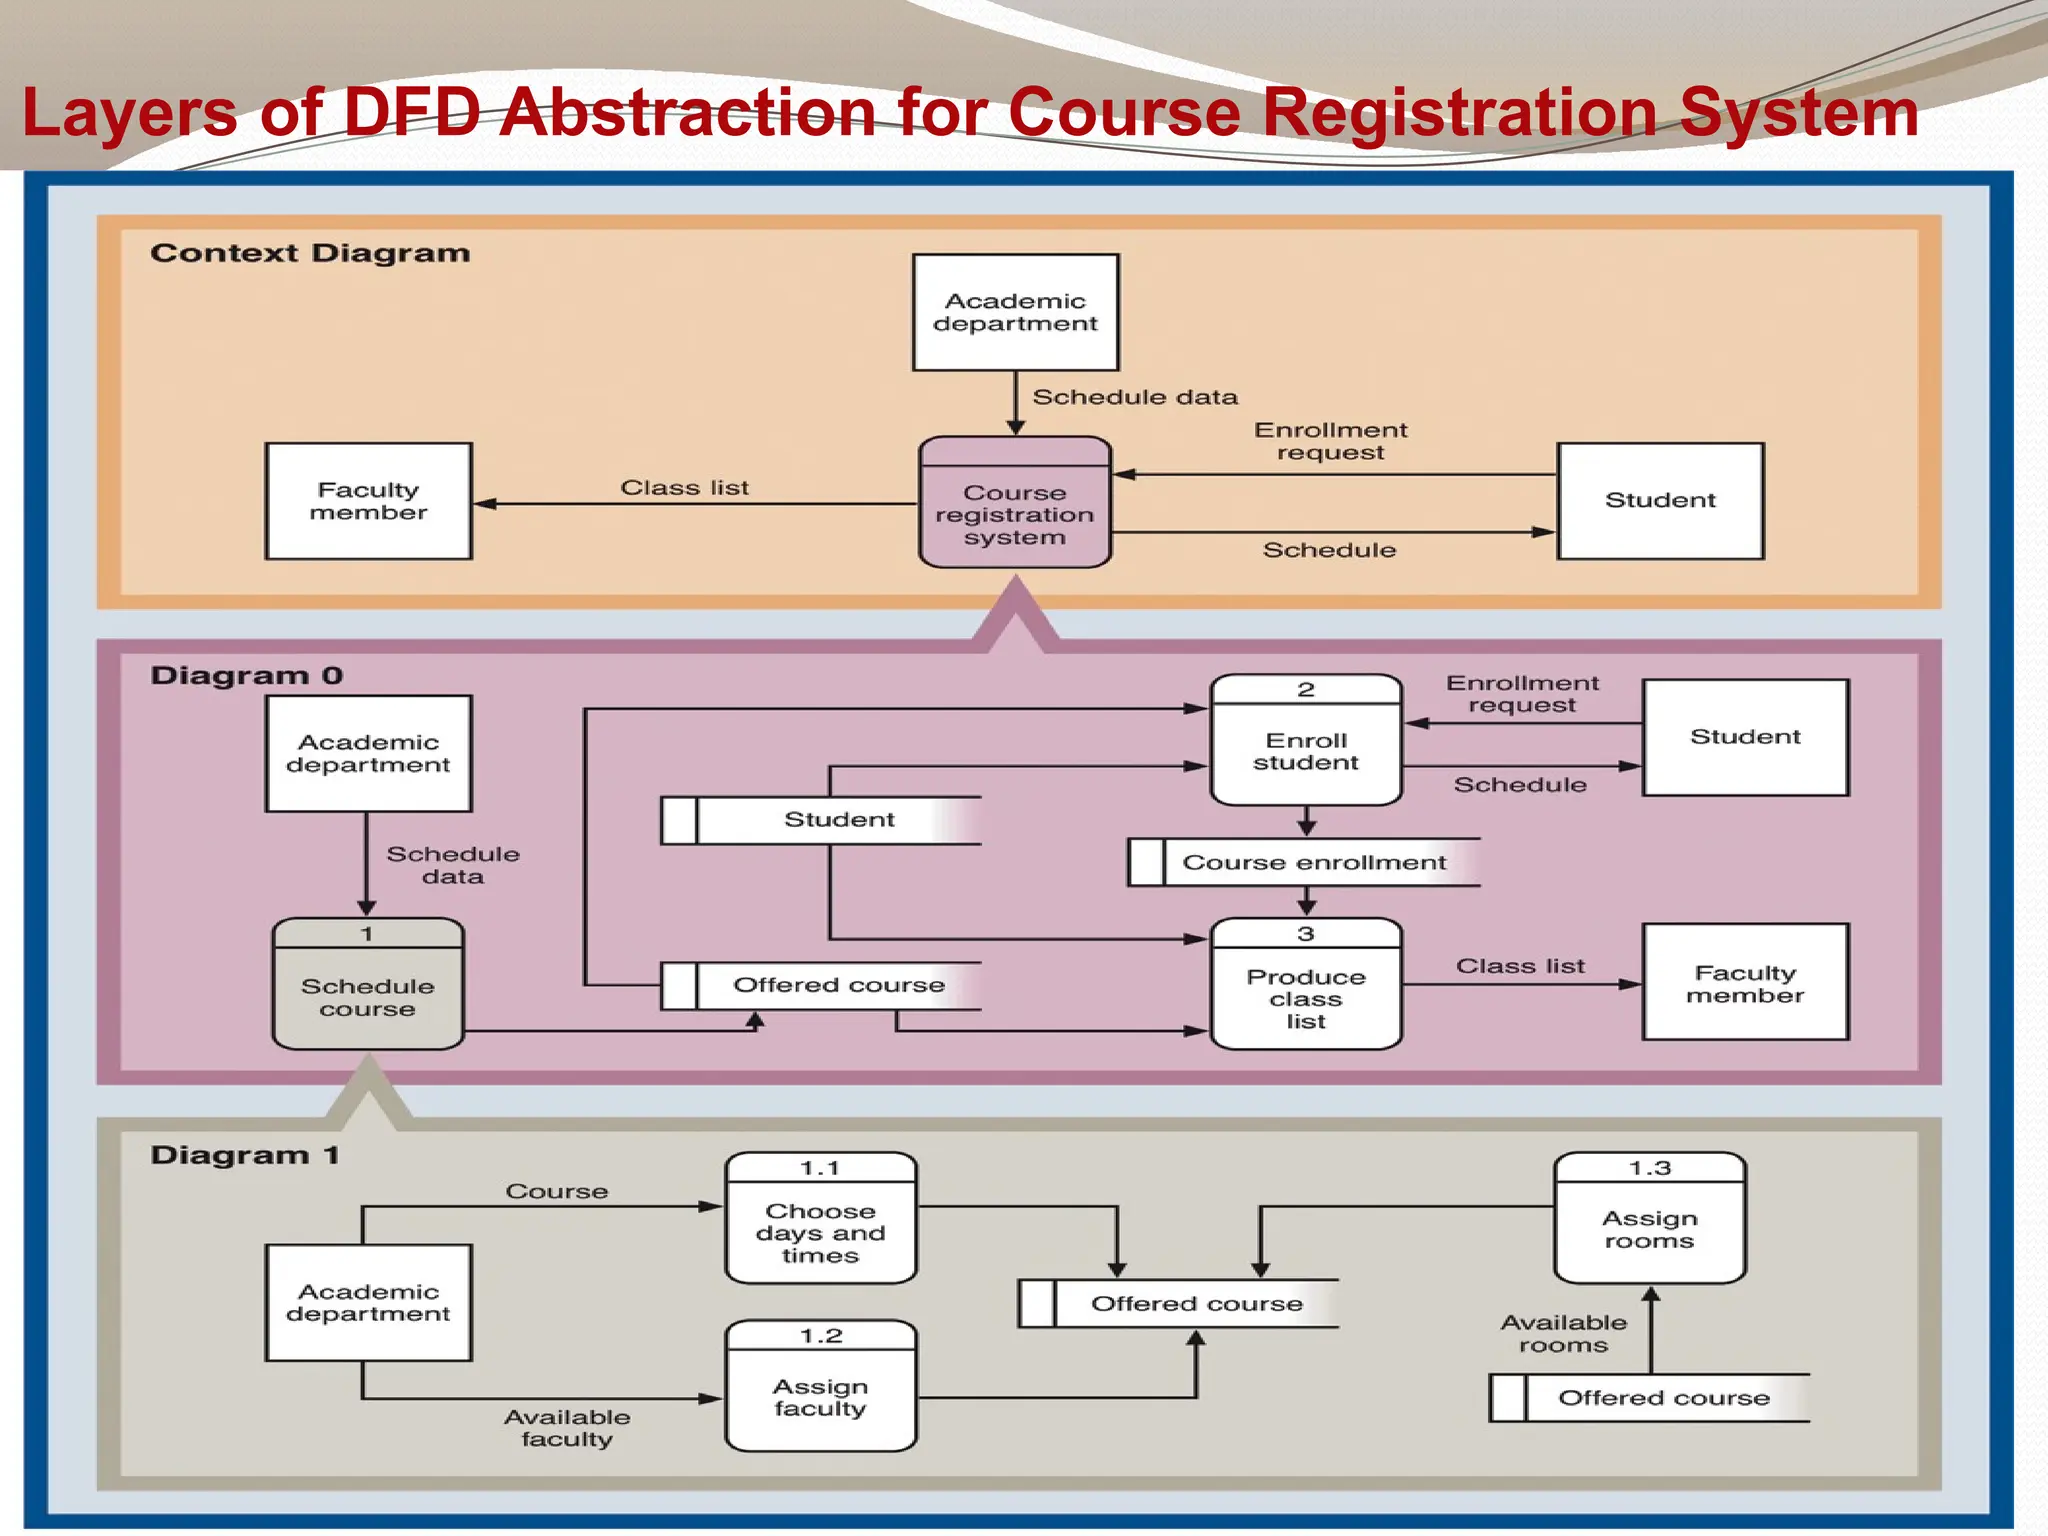
Decomposition Of DFD
LevelsDescription Explanation
Level 0 Context diagram
Contains only one
process
Level 1 Overview diagram
Utilizes all four
elements
Level 2 Detailed diagram
A breakdown of a
level 2 process
There is no rule as to how many levels of DFD that can be
used.
16.
17
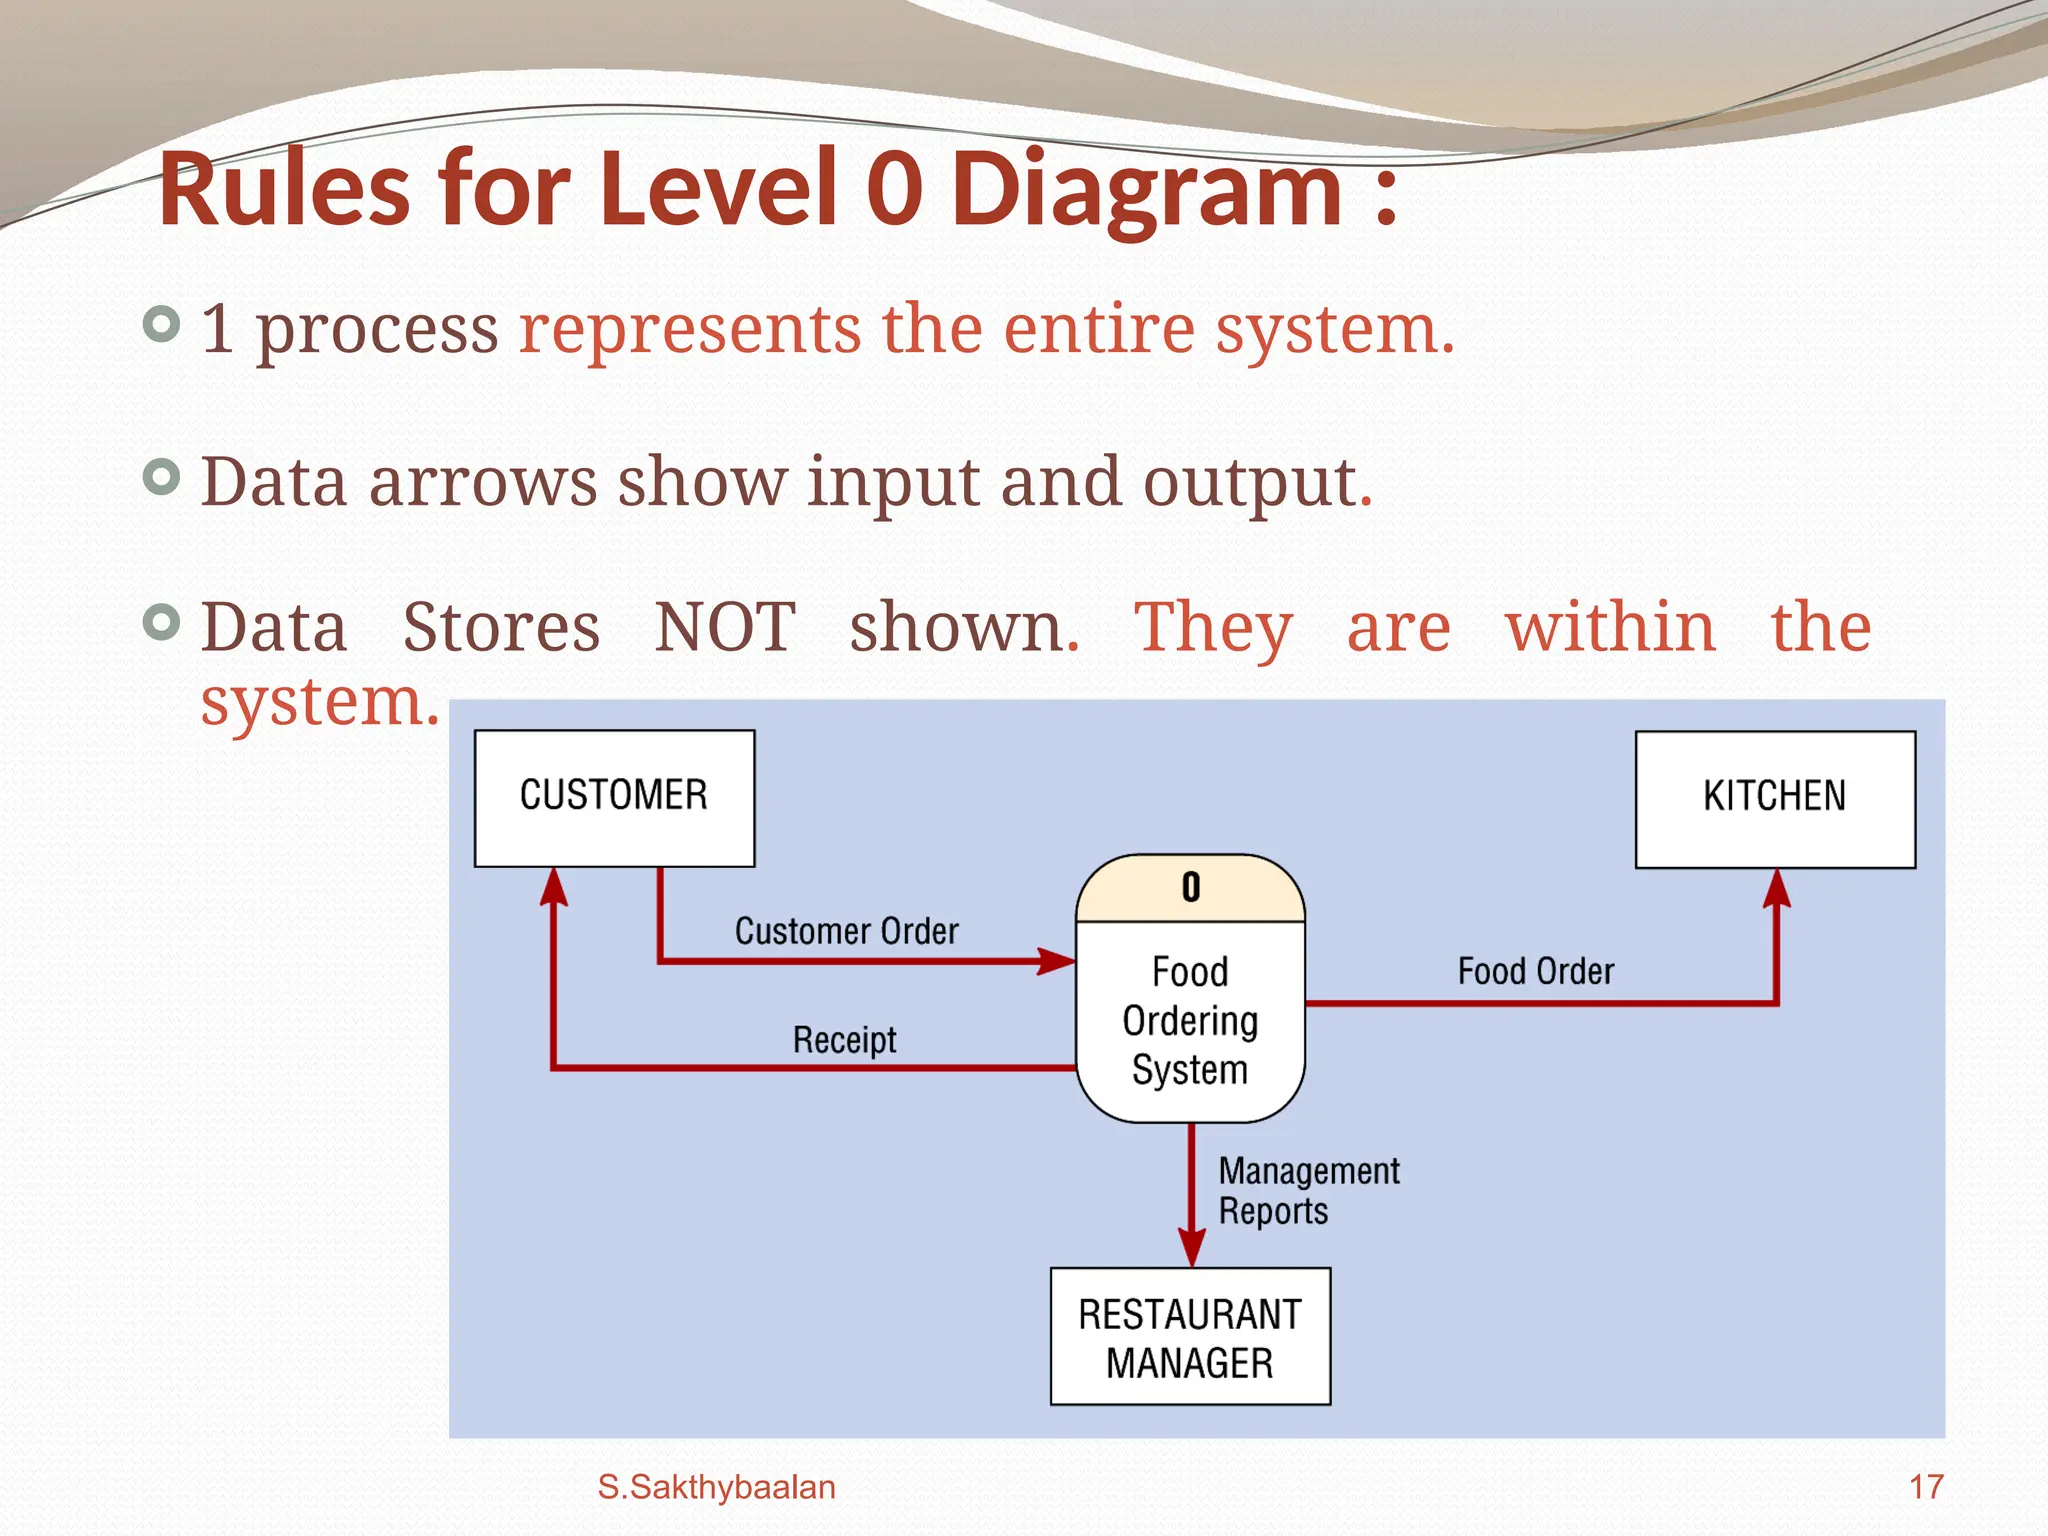
Rules for Level0 Diagram :
1 process represents the entire system.
Data arrows show input and output.
Data Stores NOT shown. They are within the
system.
S.Sakthybaalan
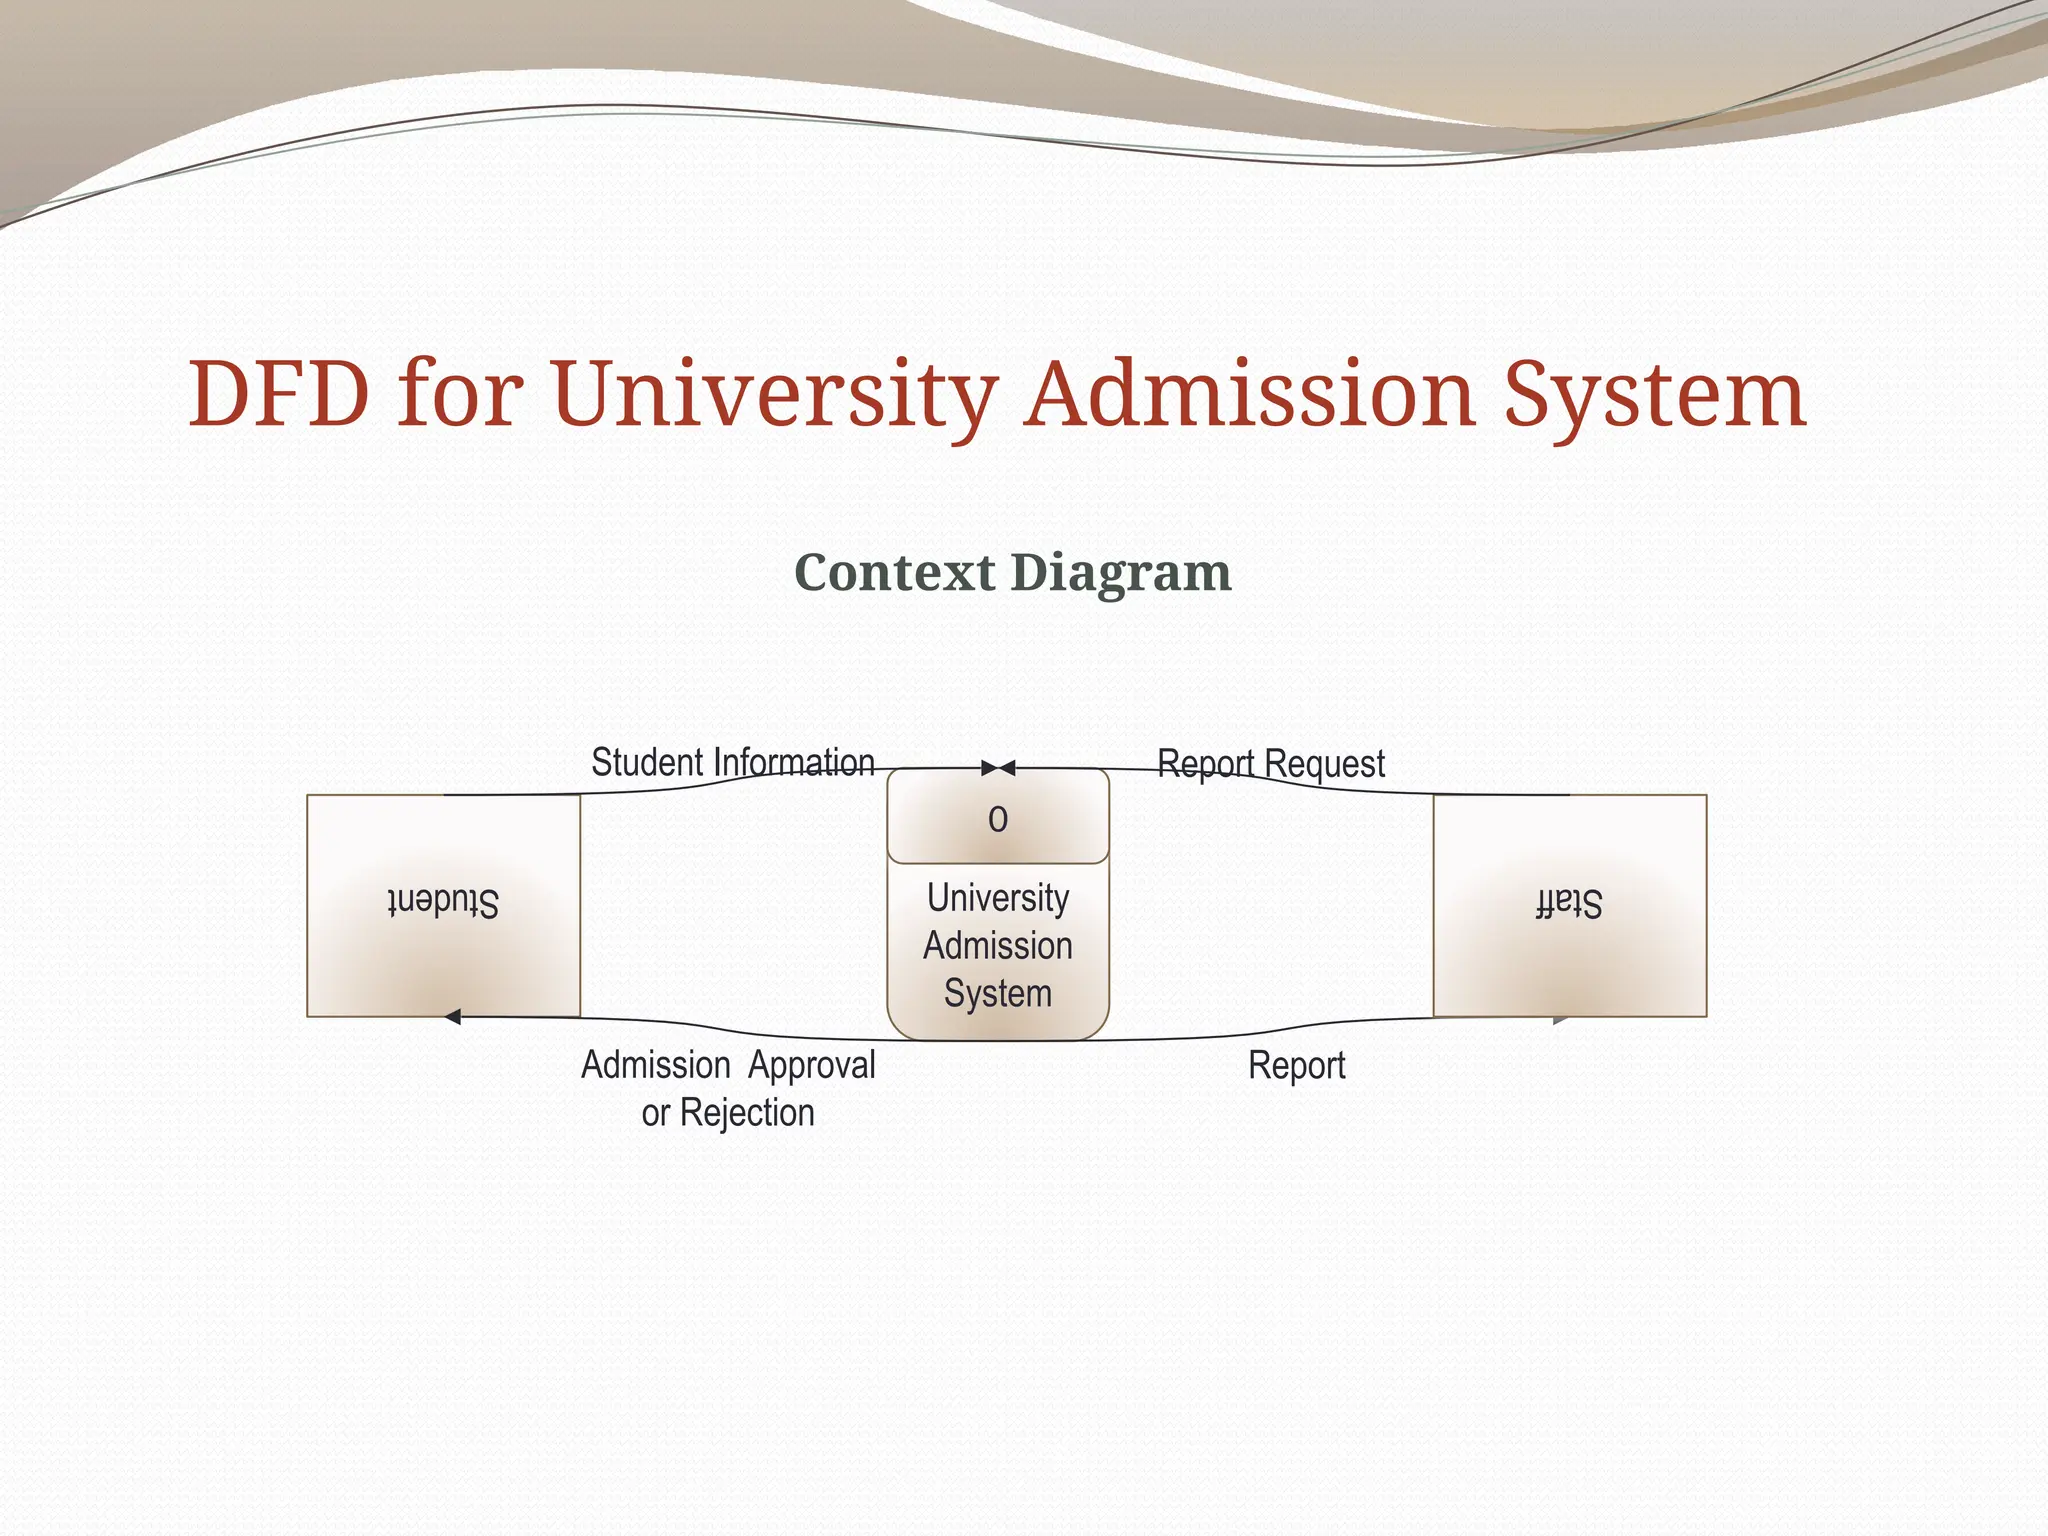
A Context Diagram(Level 0)
The major information flows between the
entities and the system.
A Context Diagram addresses only one
process.
19
19.
20
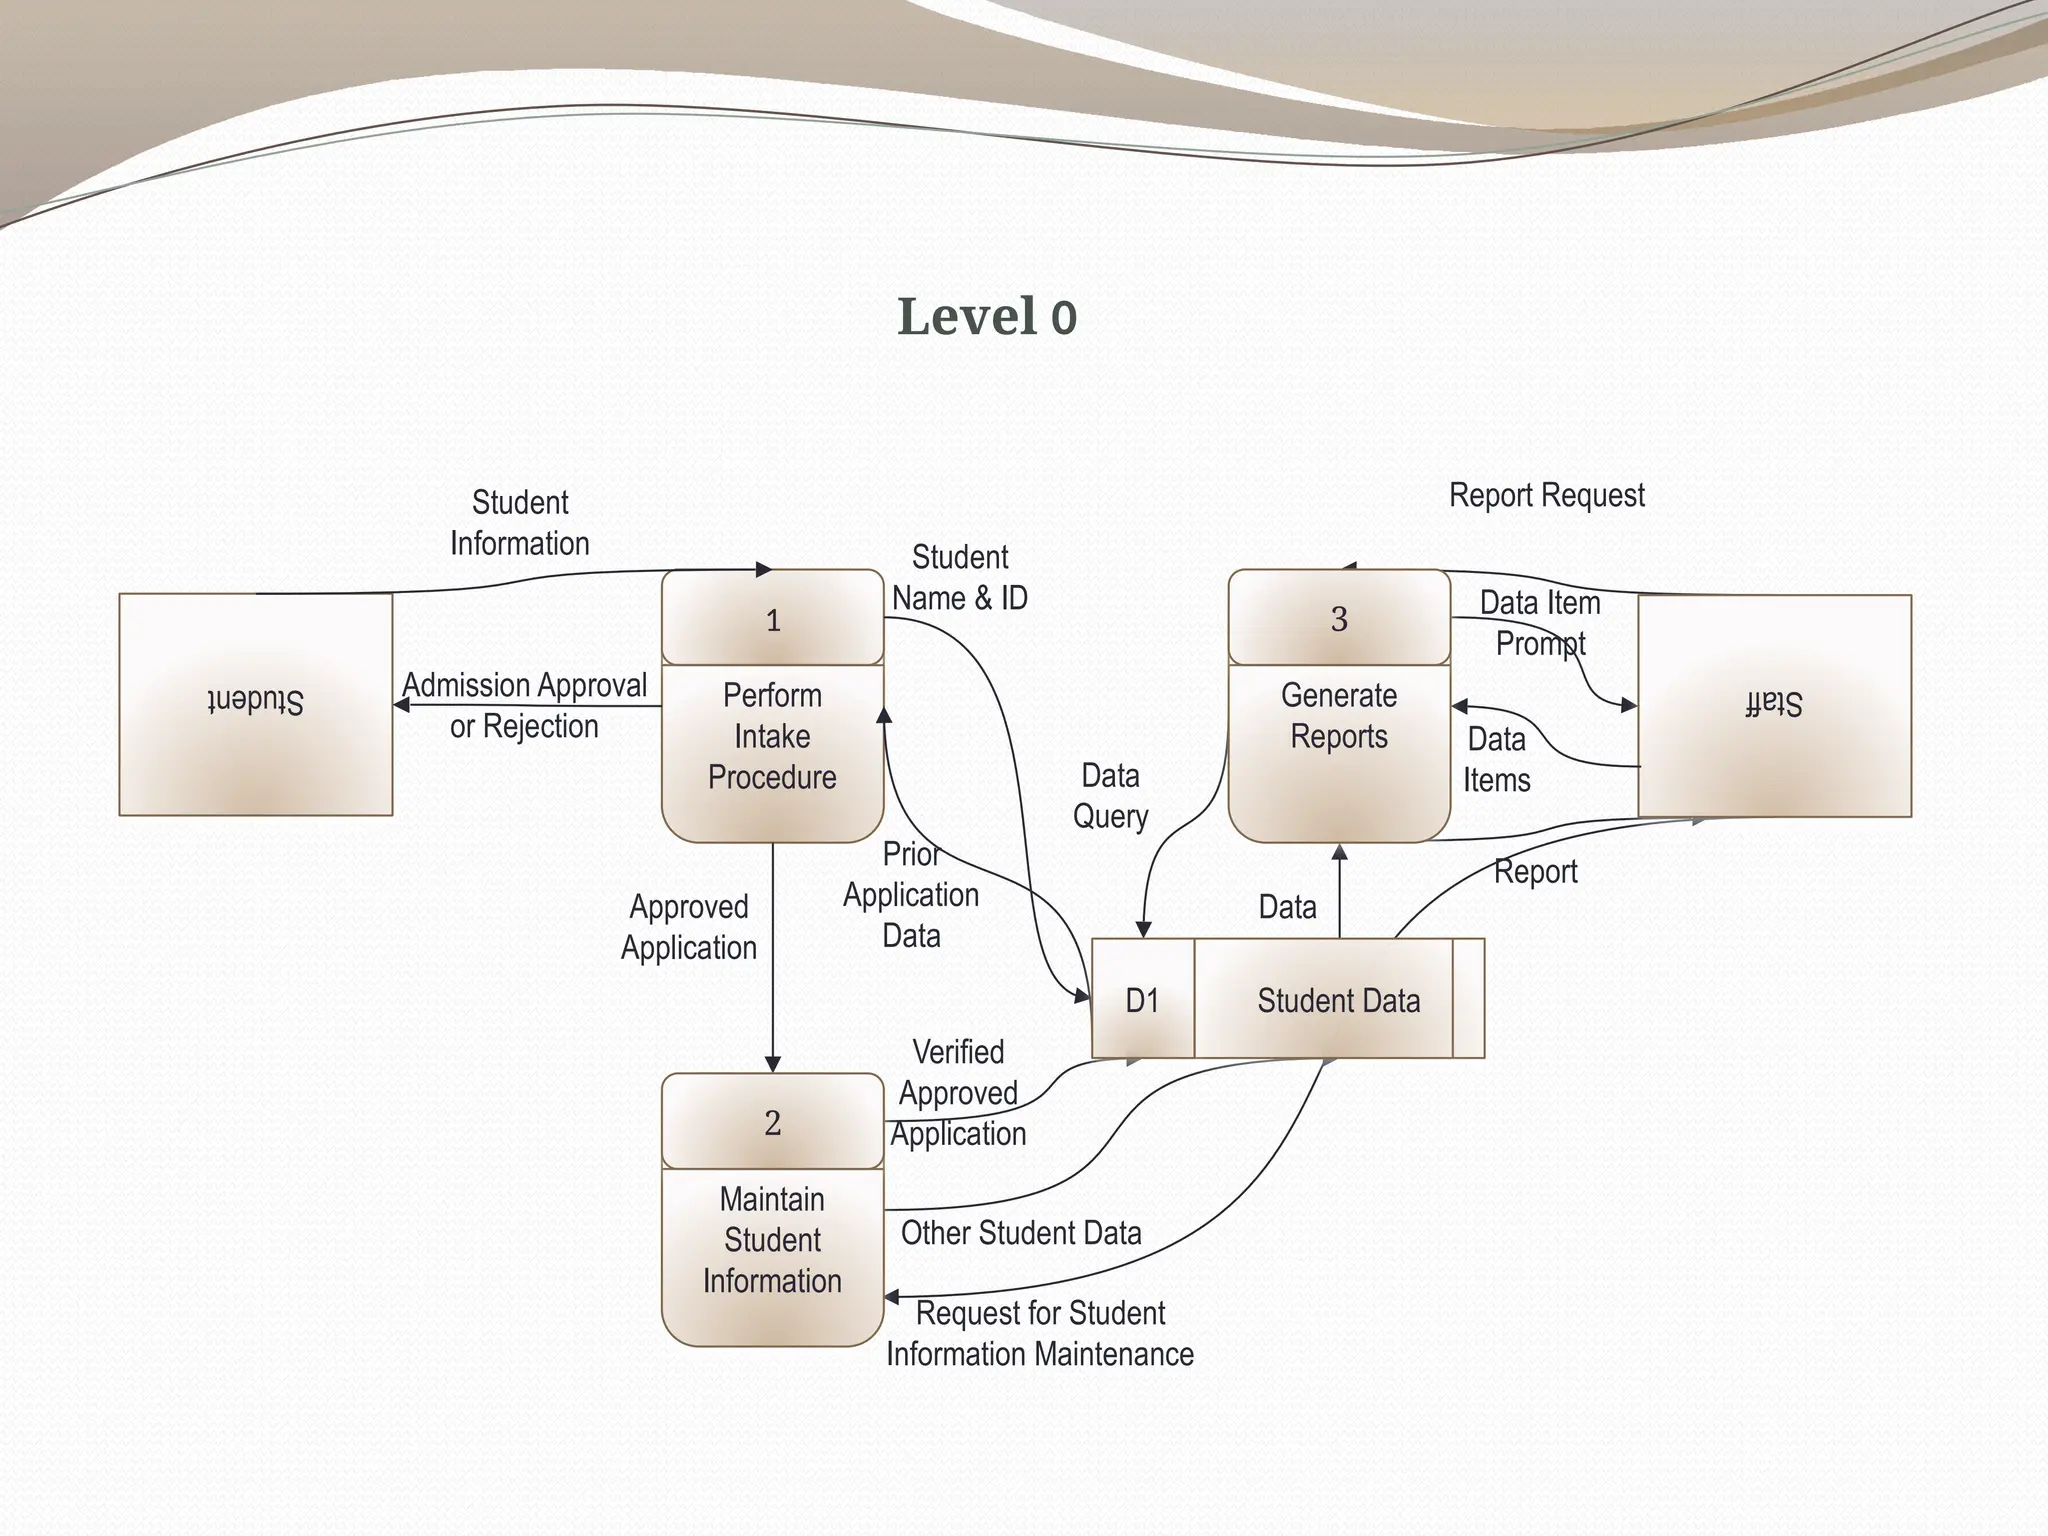
Rules for Level1 Diagram :
Level 1 DFD, must balance with the context
diagram it describes.
Input going into a process are different from
outputs leaving the process.
Data stores are first shown at this level.
20.
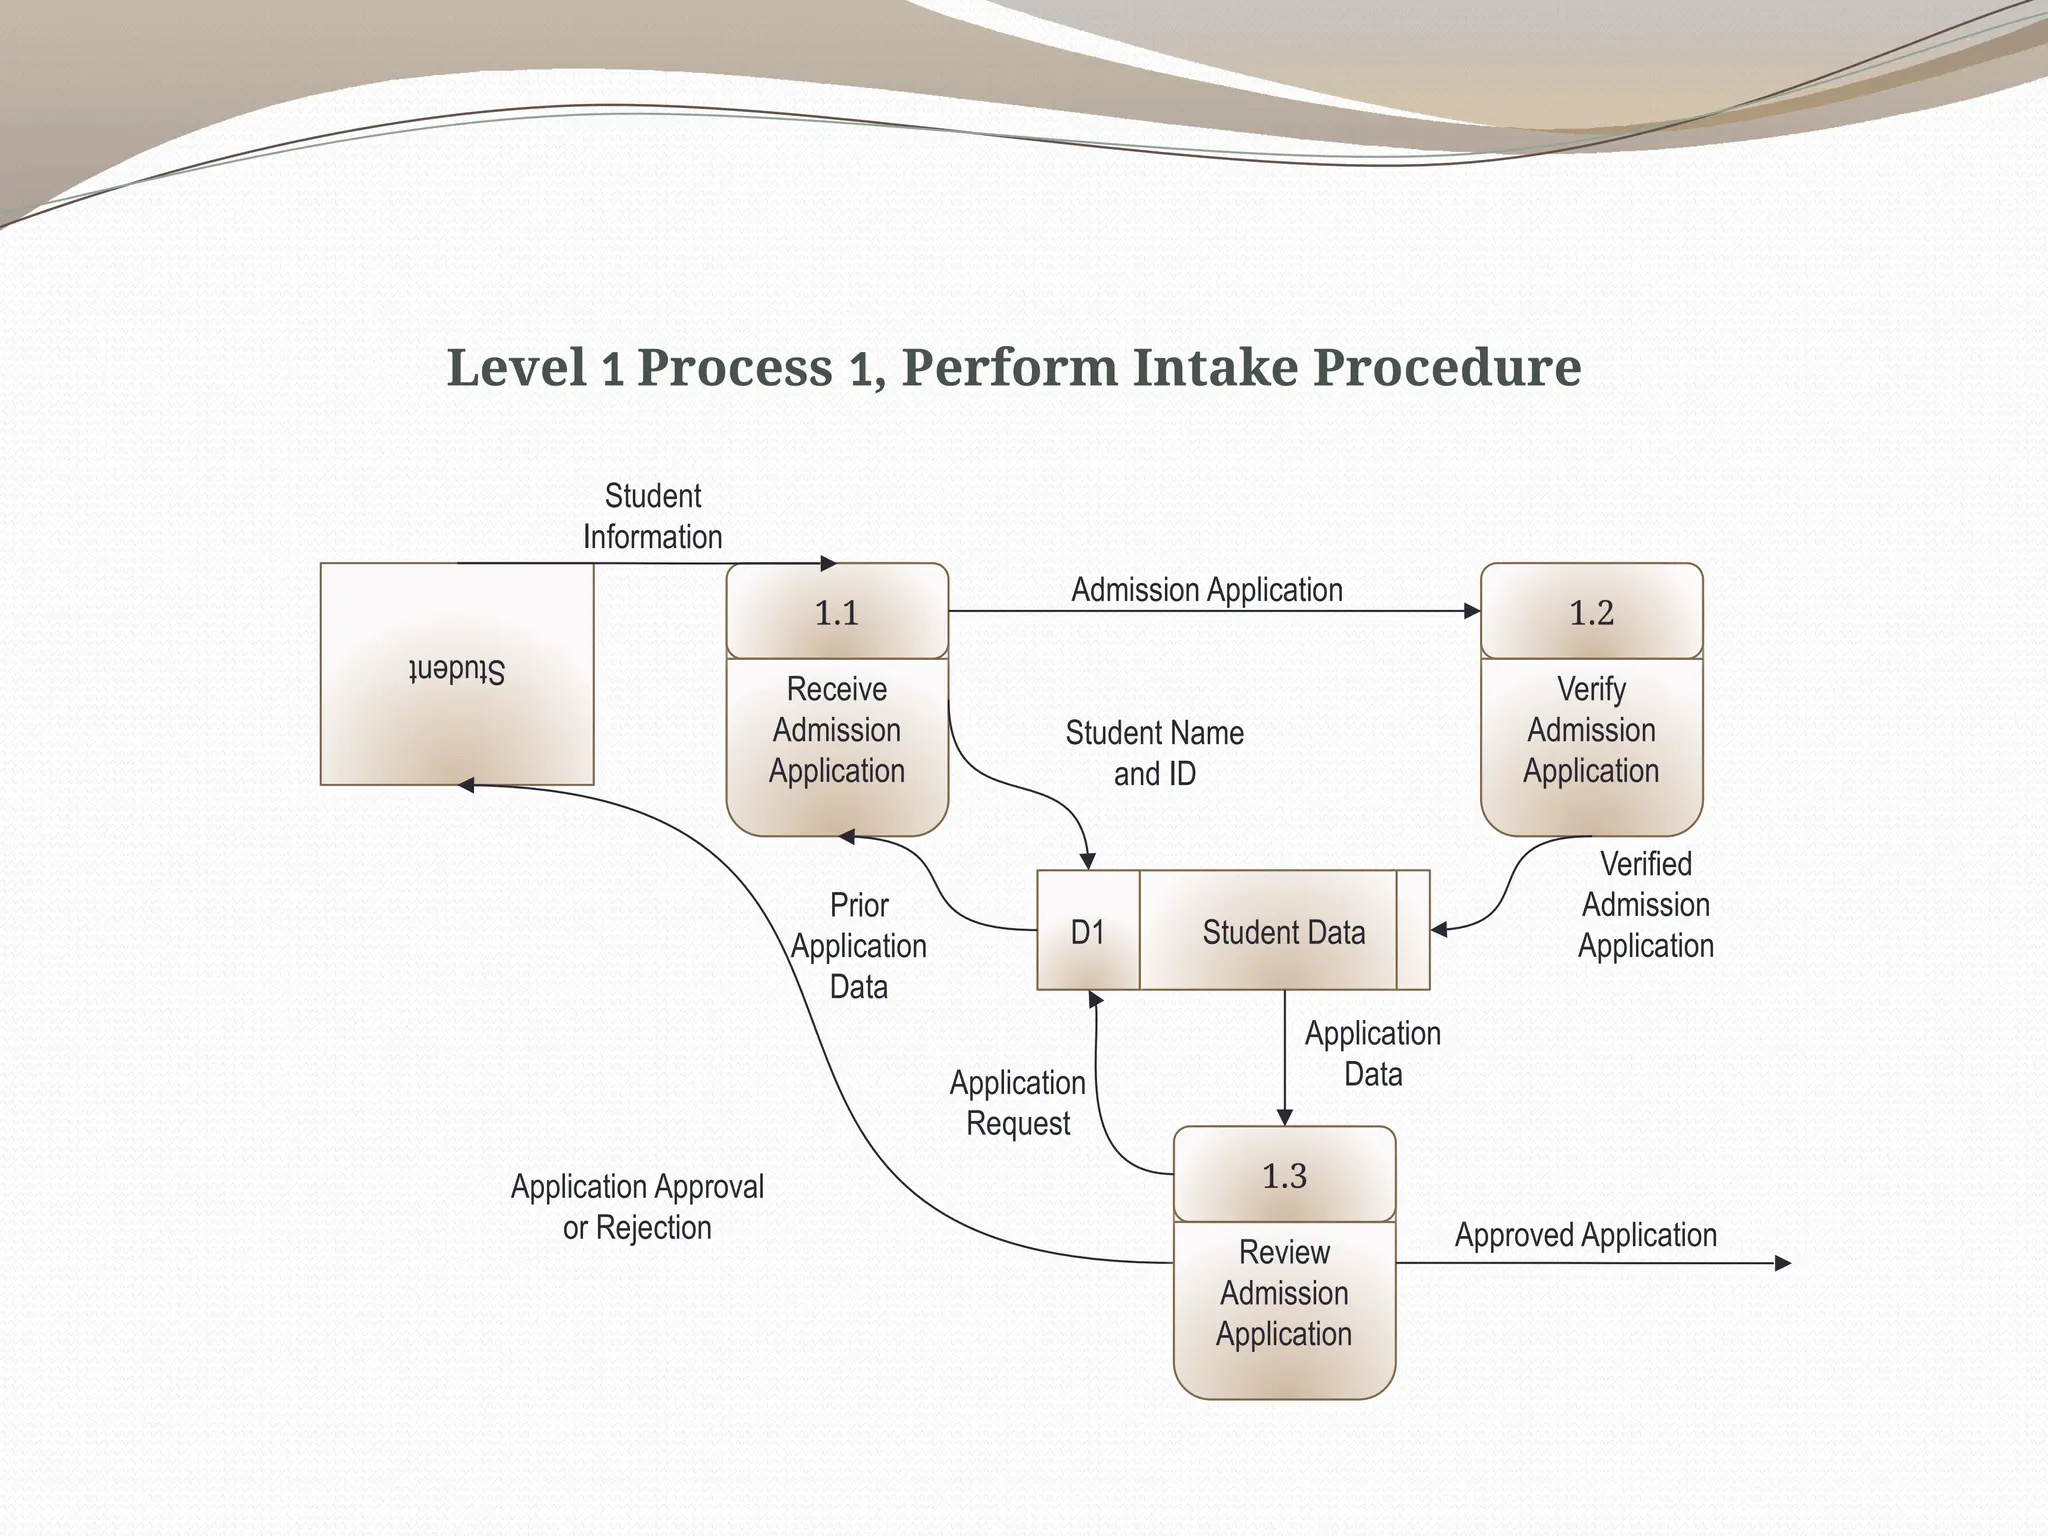
21
Rules for Level2 Diagram :
Level 2 DFD must balance with the Level 1 it
describes.
Input going into a process are different from
outputs leaving the process.
Continue to show data stores.
21.
22
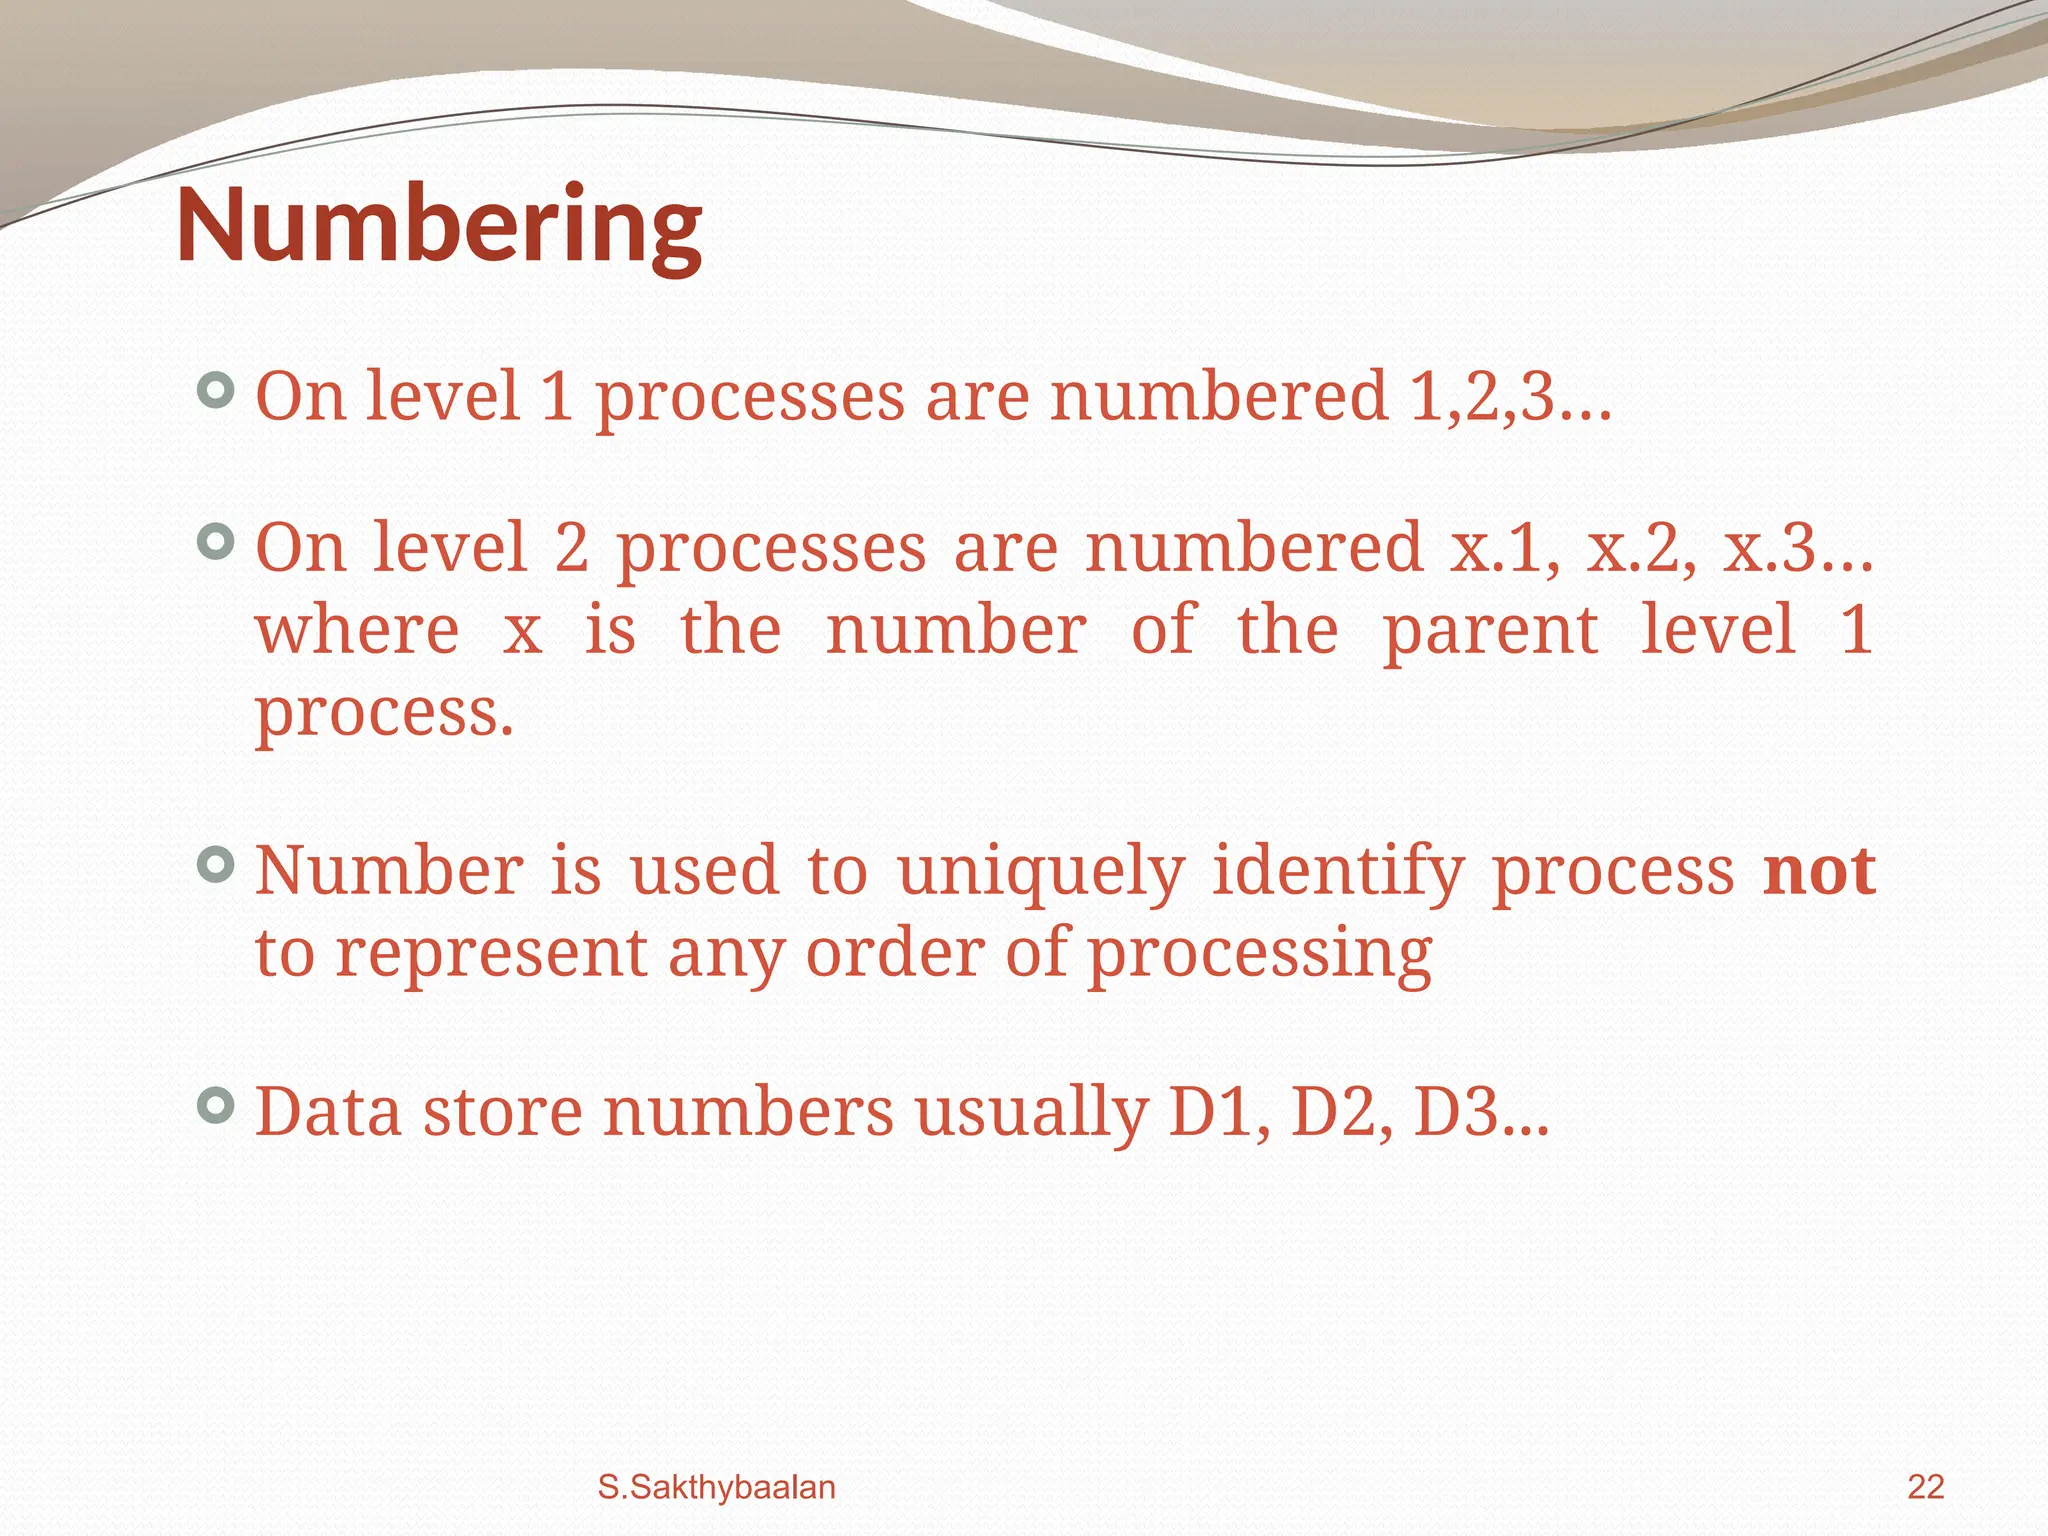
Numbering
On level1 processes are numbered 1,2,3…
On level 2 processes are numbered x.1, x.2, x.3…
where x is the number of the parent level 1
process.
Number is used to uniquely identify process not
to represent any order of processing
Data store numbers usually D1, D2, D3...
S.Sakthybaalan
22.
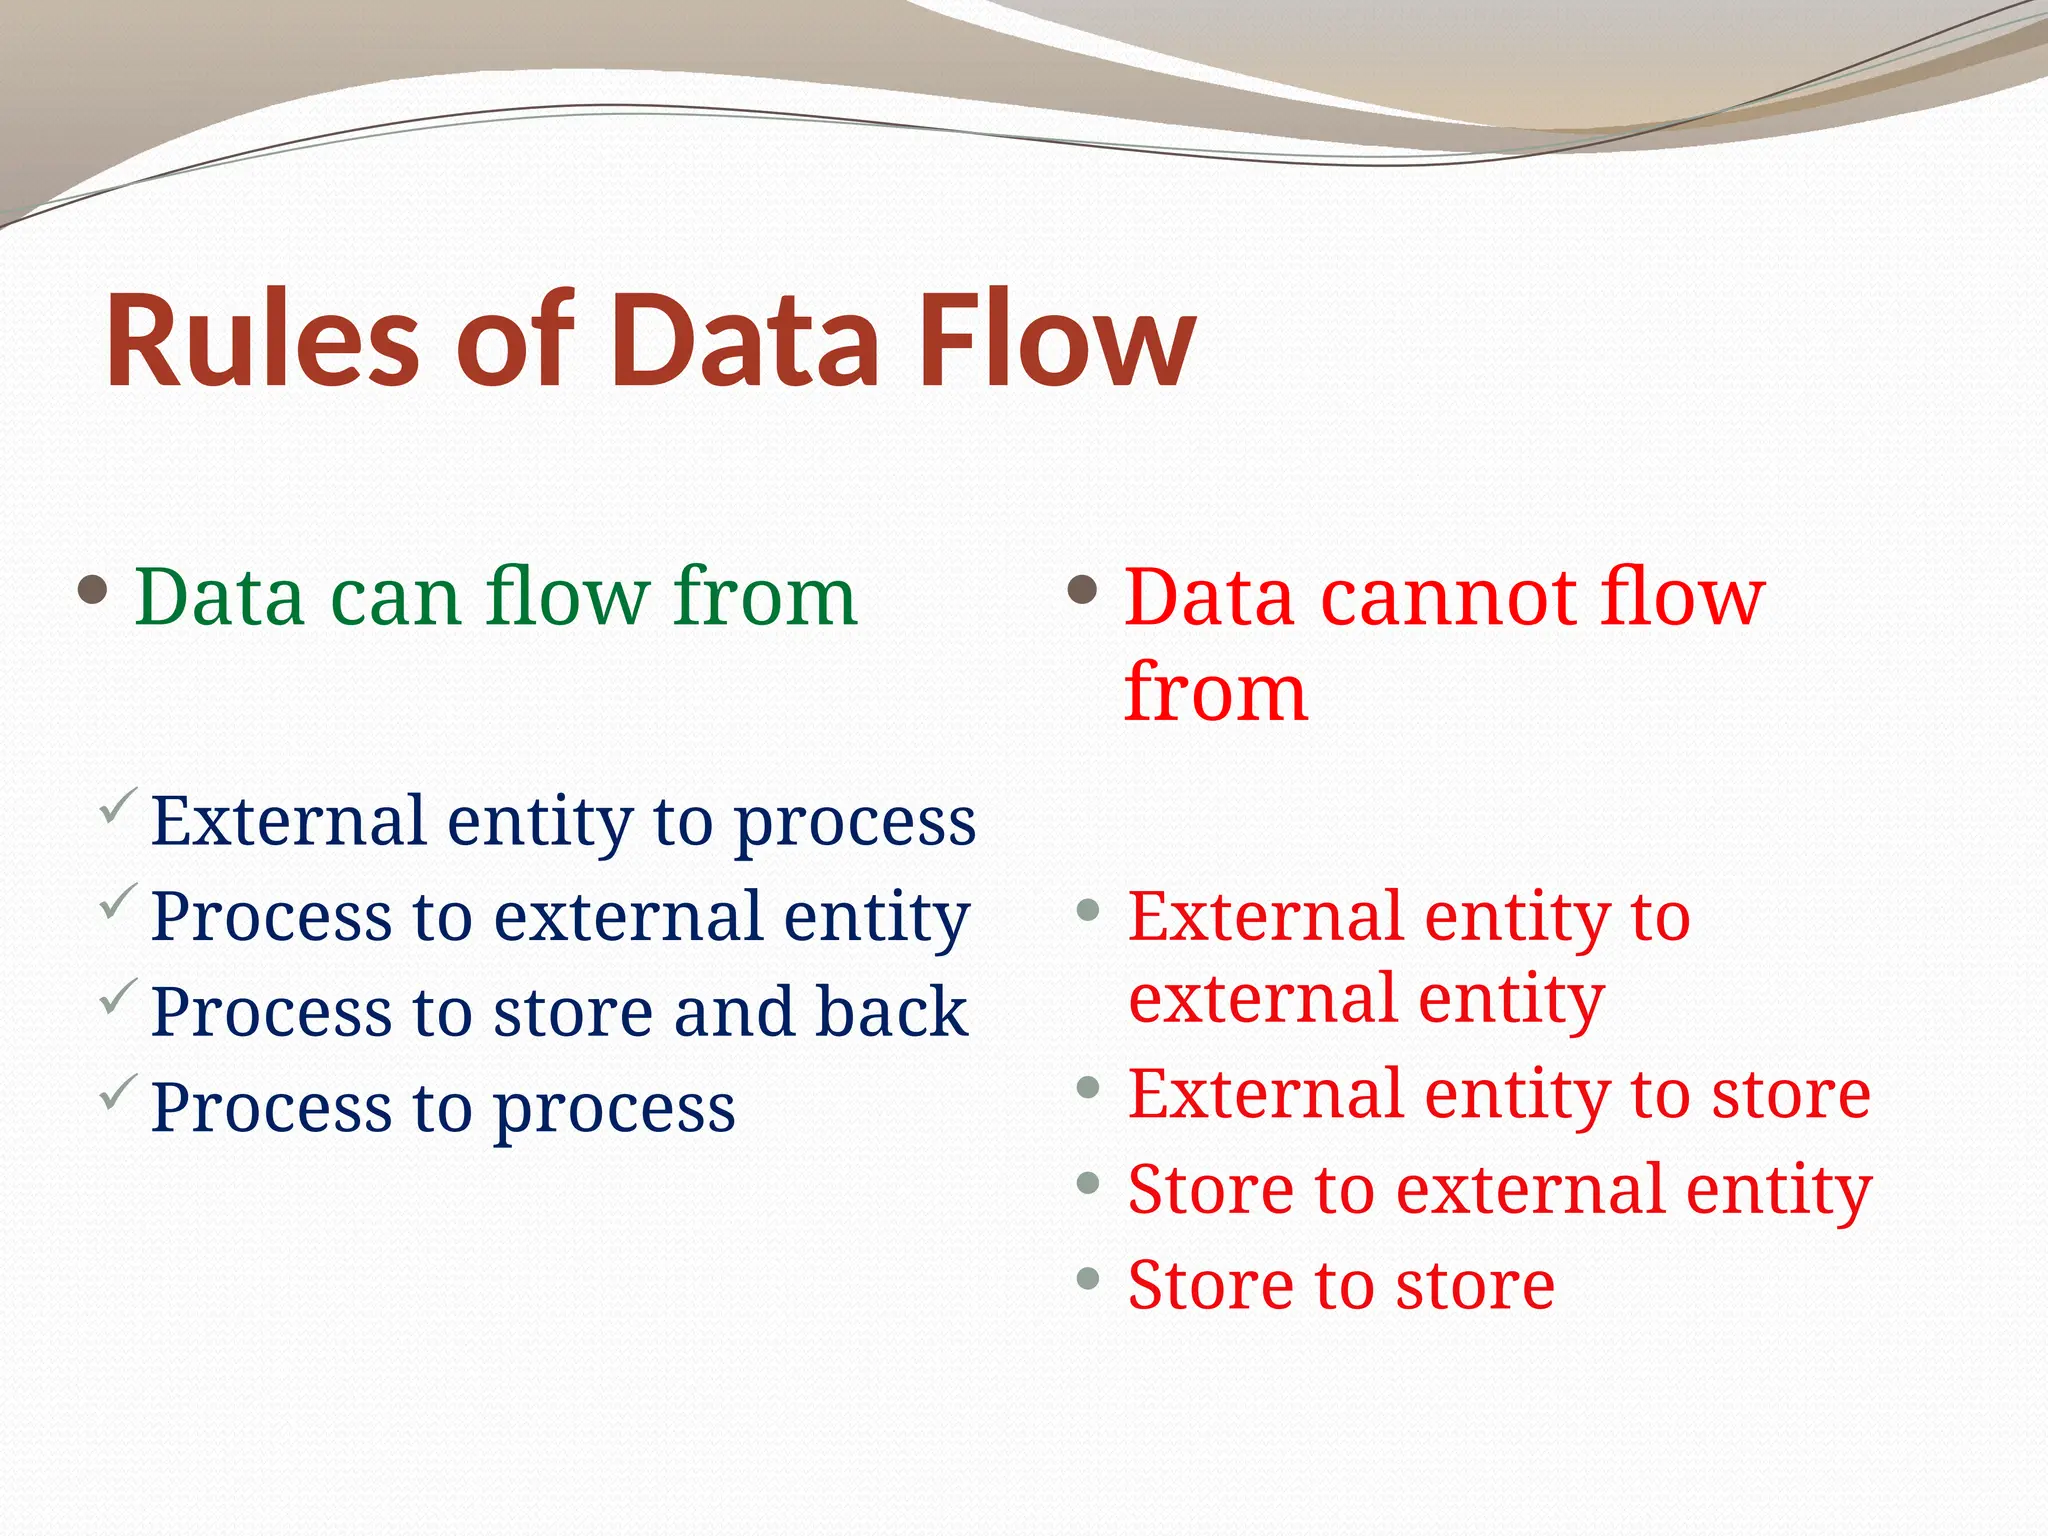
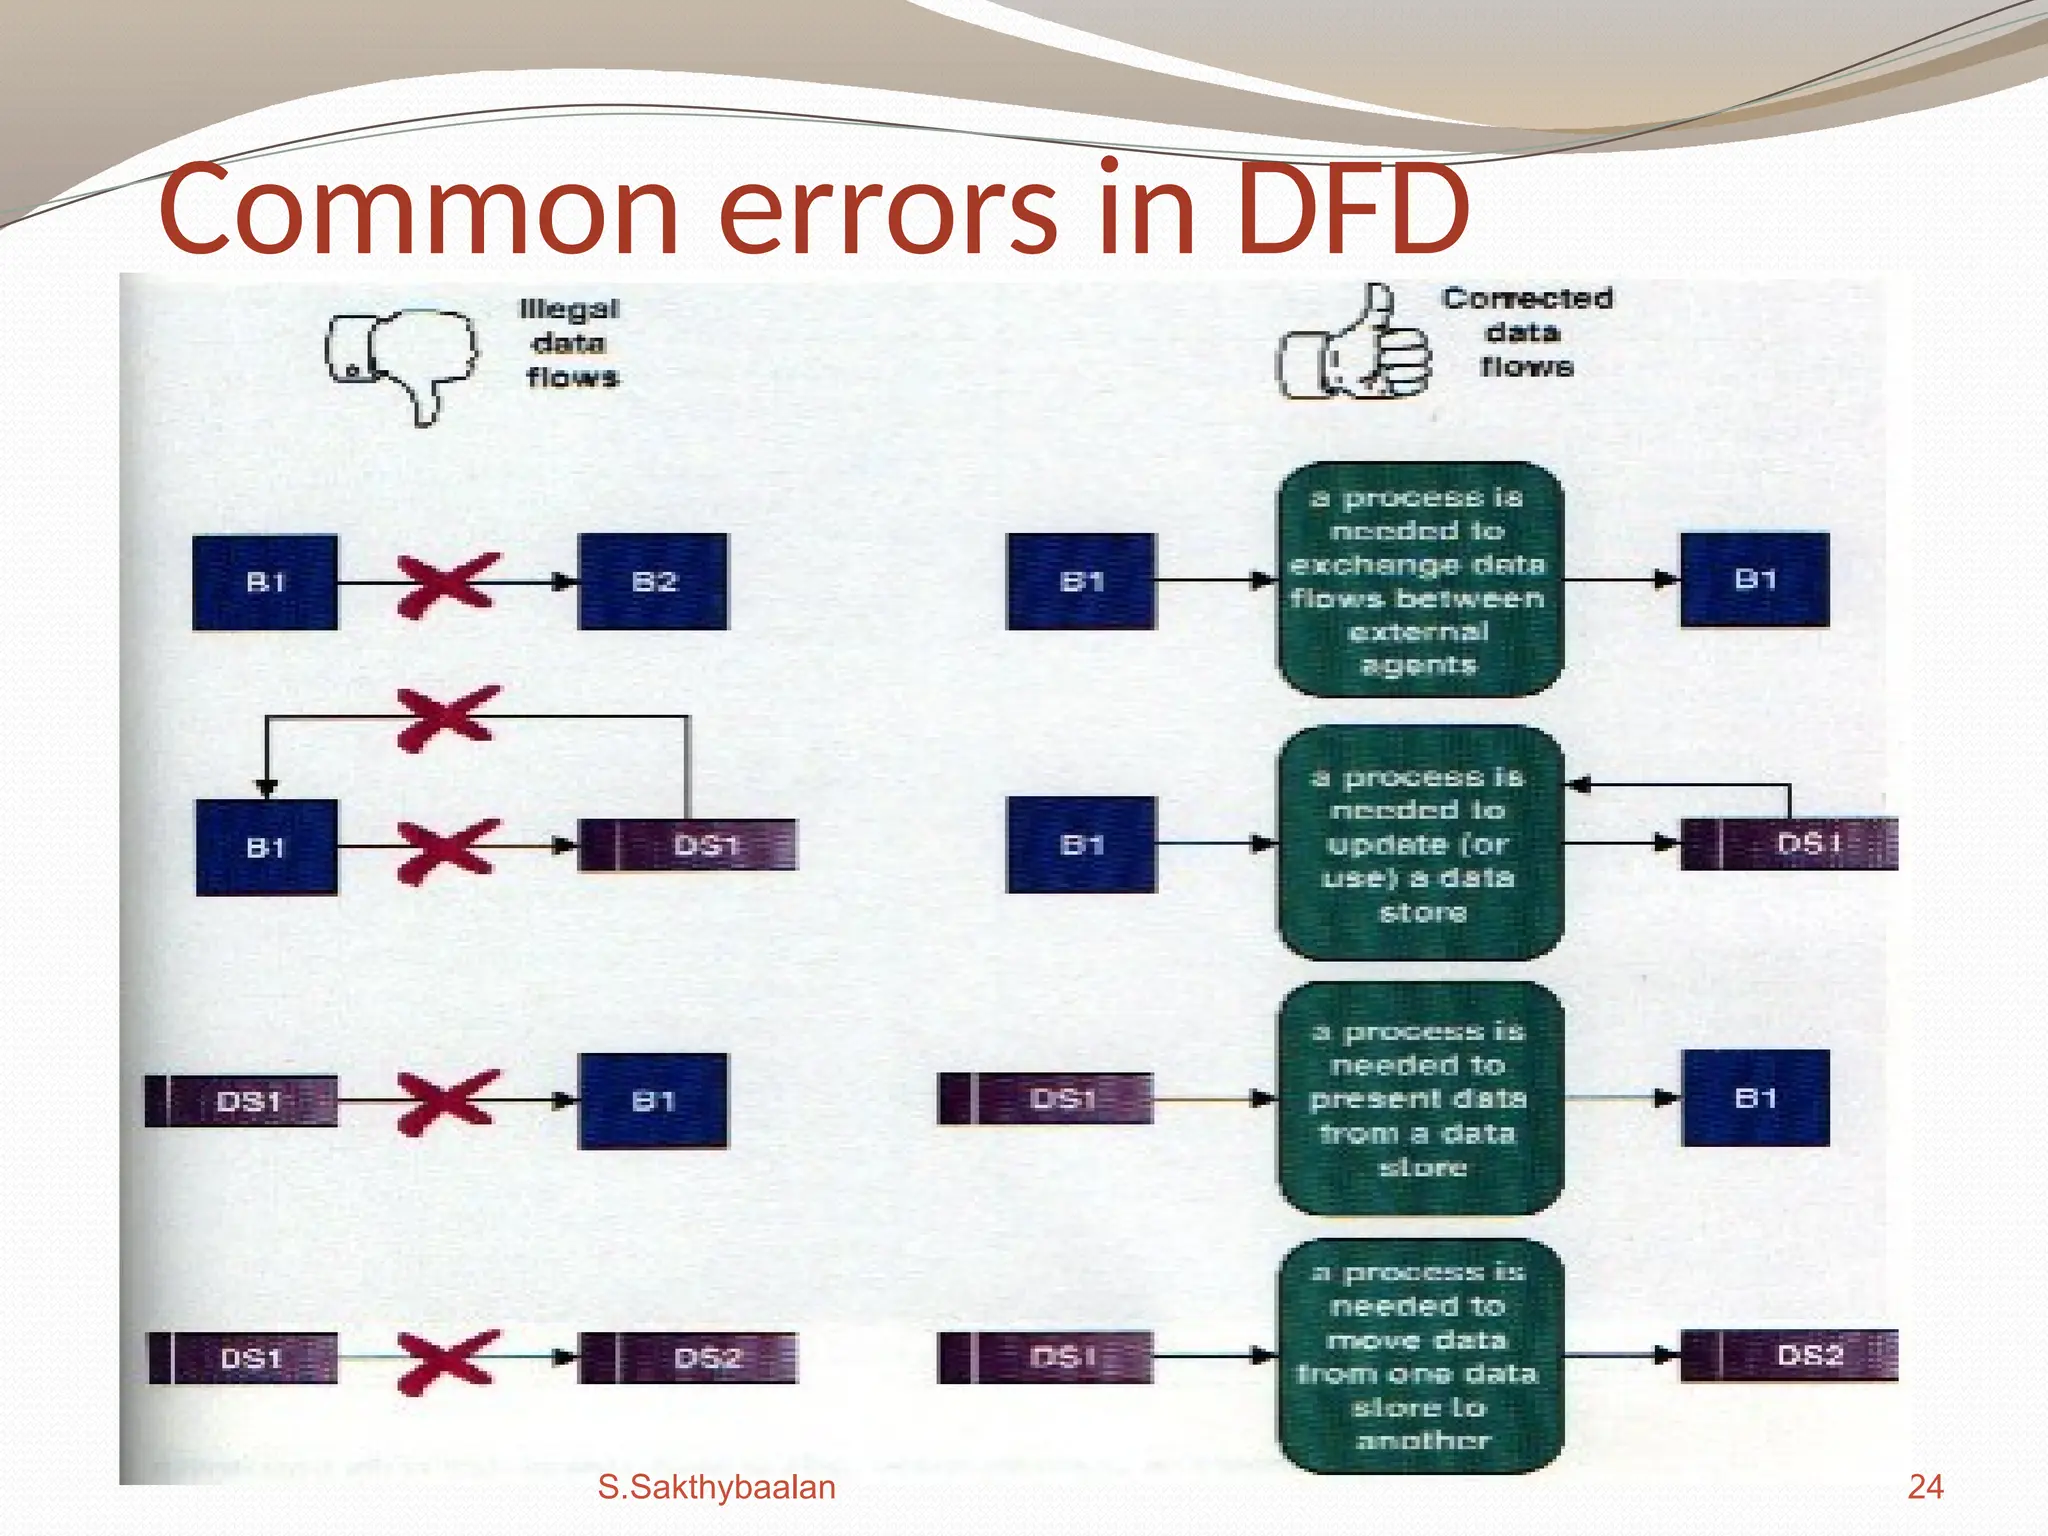
Rules of DataFlow
Data can flow from
External entity to process
Process to external entity
Process to store and back
Process to process
Data cannot flow
from
External entity to
external entity
External entity to store
Store to external entity
Store to store
25
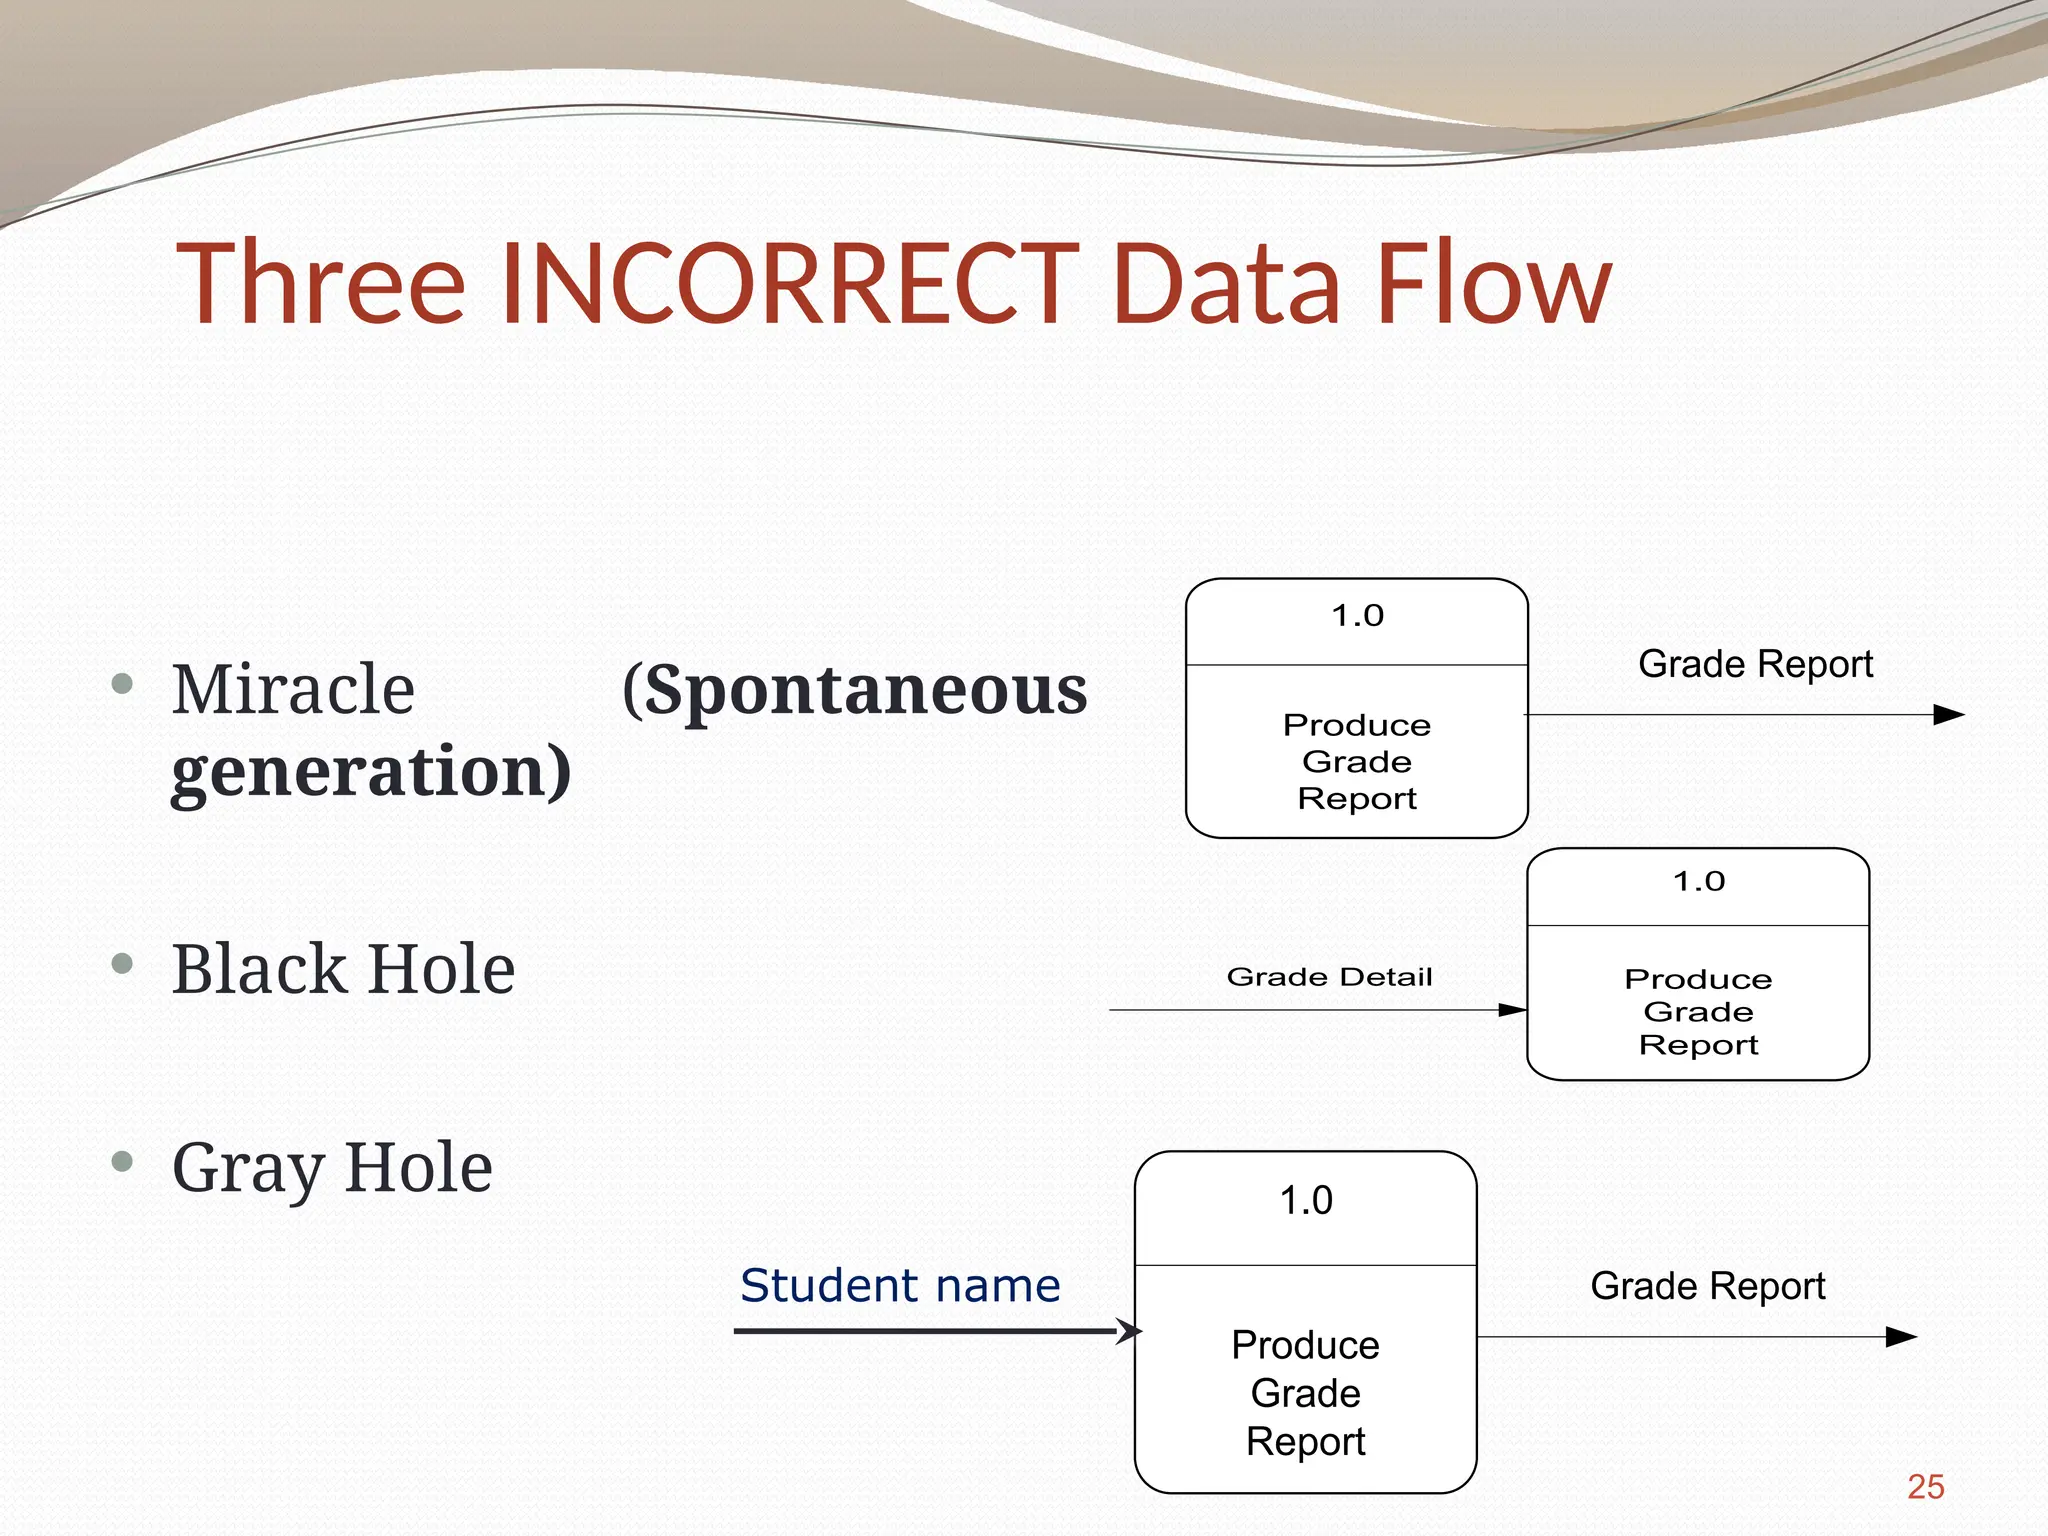
Miracle (Spontaneous
generation)
Black Hole
Gray Hole
1.0
Produce
Grade
Report
Grade Report
1.0
Produce
Grade
Report
Grade Detail
1.0
Produce
Grade
Report
Grade Report
Student name
Three INCORRECT Data Flow
25.
Good Style inDrawing DFD
Use meaningful names for data flows, processes
and data stores.
Use top down development starting from context
diagram and successively levelling DFD
Only previously stored data can be read
A process can only transfer input to output. It
cannot create new data
Data stores cannot create new data
26.
Creating DFDs
Createa preliminary Context Diagram.
Identify Use Cases, i.e. the ways in which users most
commonly use the system.
Create DFD fragments for each use case.
Create a Level 0 diagram from fragments.
Decompose to Level 1,2,…
Validate DFDs with users.
27.
Creating the ContextDiagram
Draw one process
representing the entire
system (process 0)
Find all inputs and outputs
that come from or go to
external entities; draw as
data flows.
Draw in external entities as
the source or destination of
the data flows.
28.
Creating Level 0Diagram
Combine the set of
DFD fragments into
one diagram.
Generally move from
top to bottom, left to
right.
Minimize crossed
lines.
29.
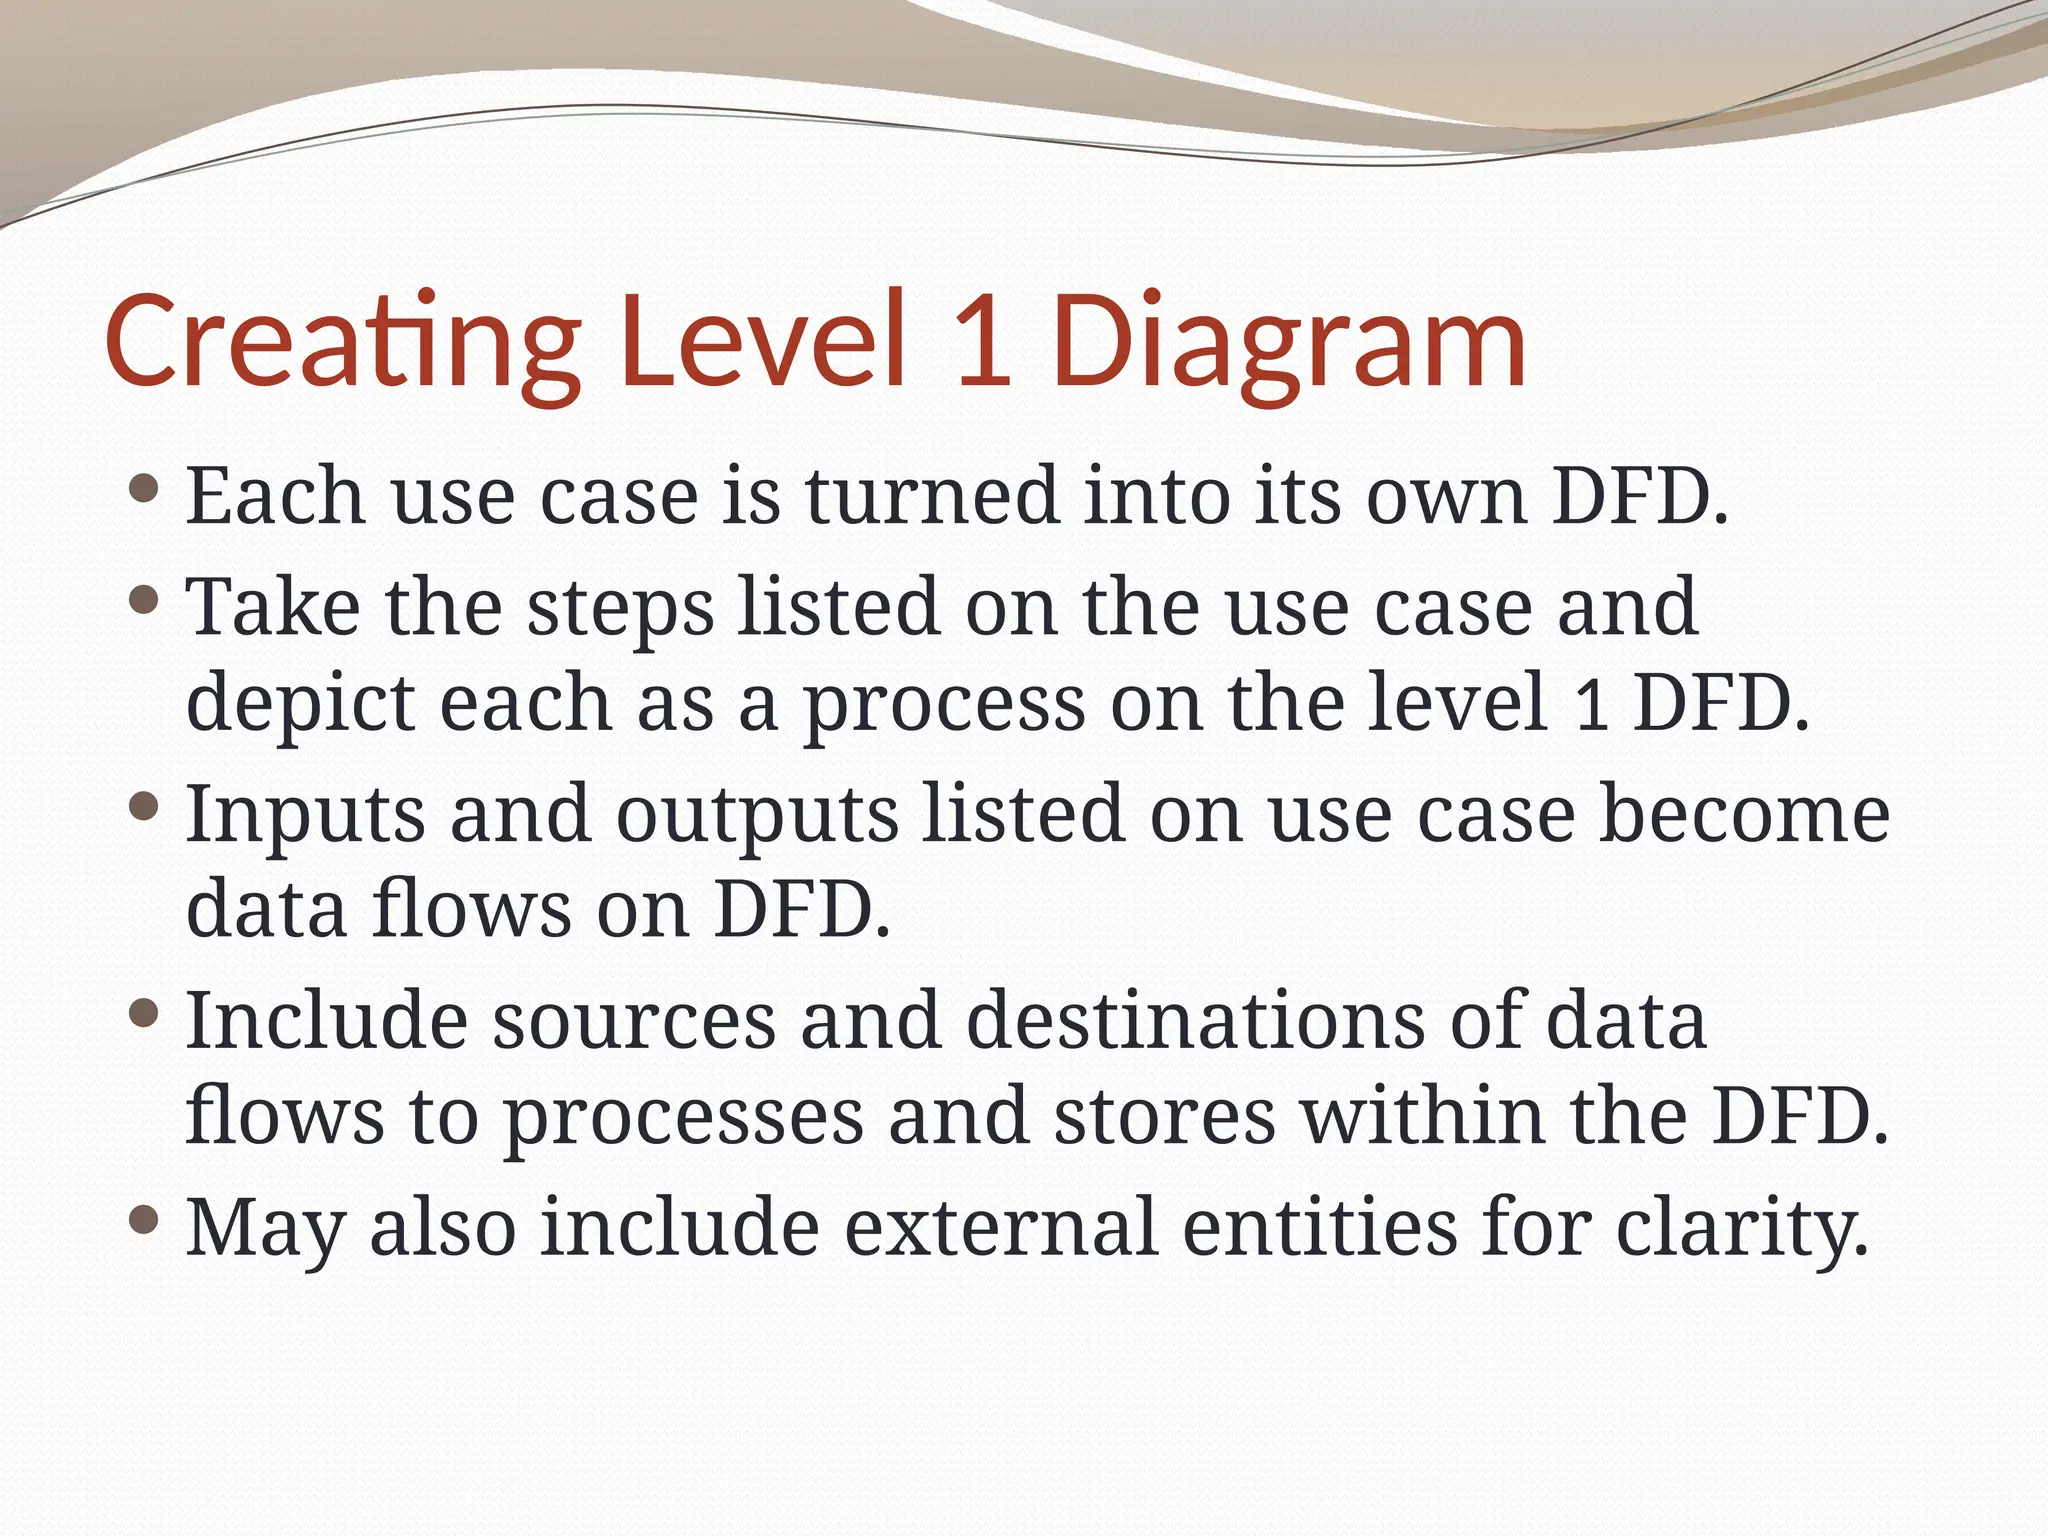
Creating Level 1Diagram
Each use case is turned into its own DFD.
Take the steps listed on the use case and
depict each as a process on the level 1 DFD.
Inputs and outputs listed on use case become
data flows on DFD.
Include sources and destinations of data
flows to processes and stores within the DFD.
May also include external entities for clarity.
30.
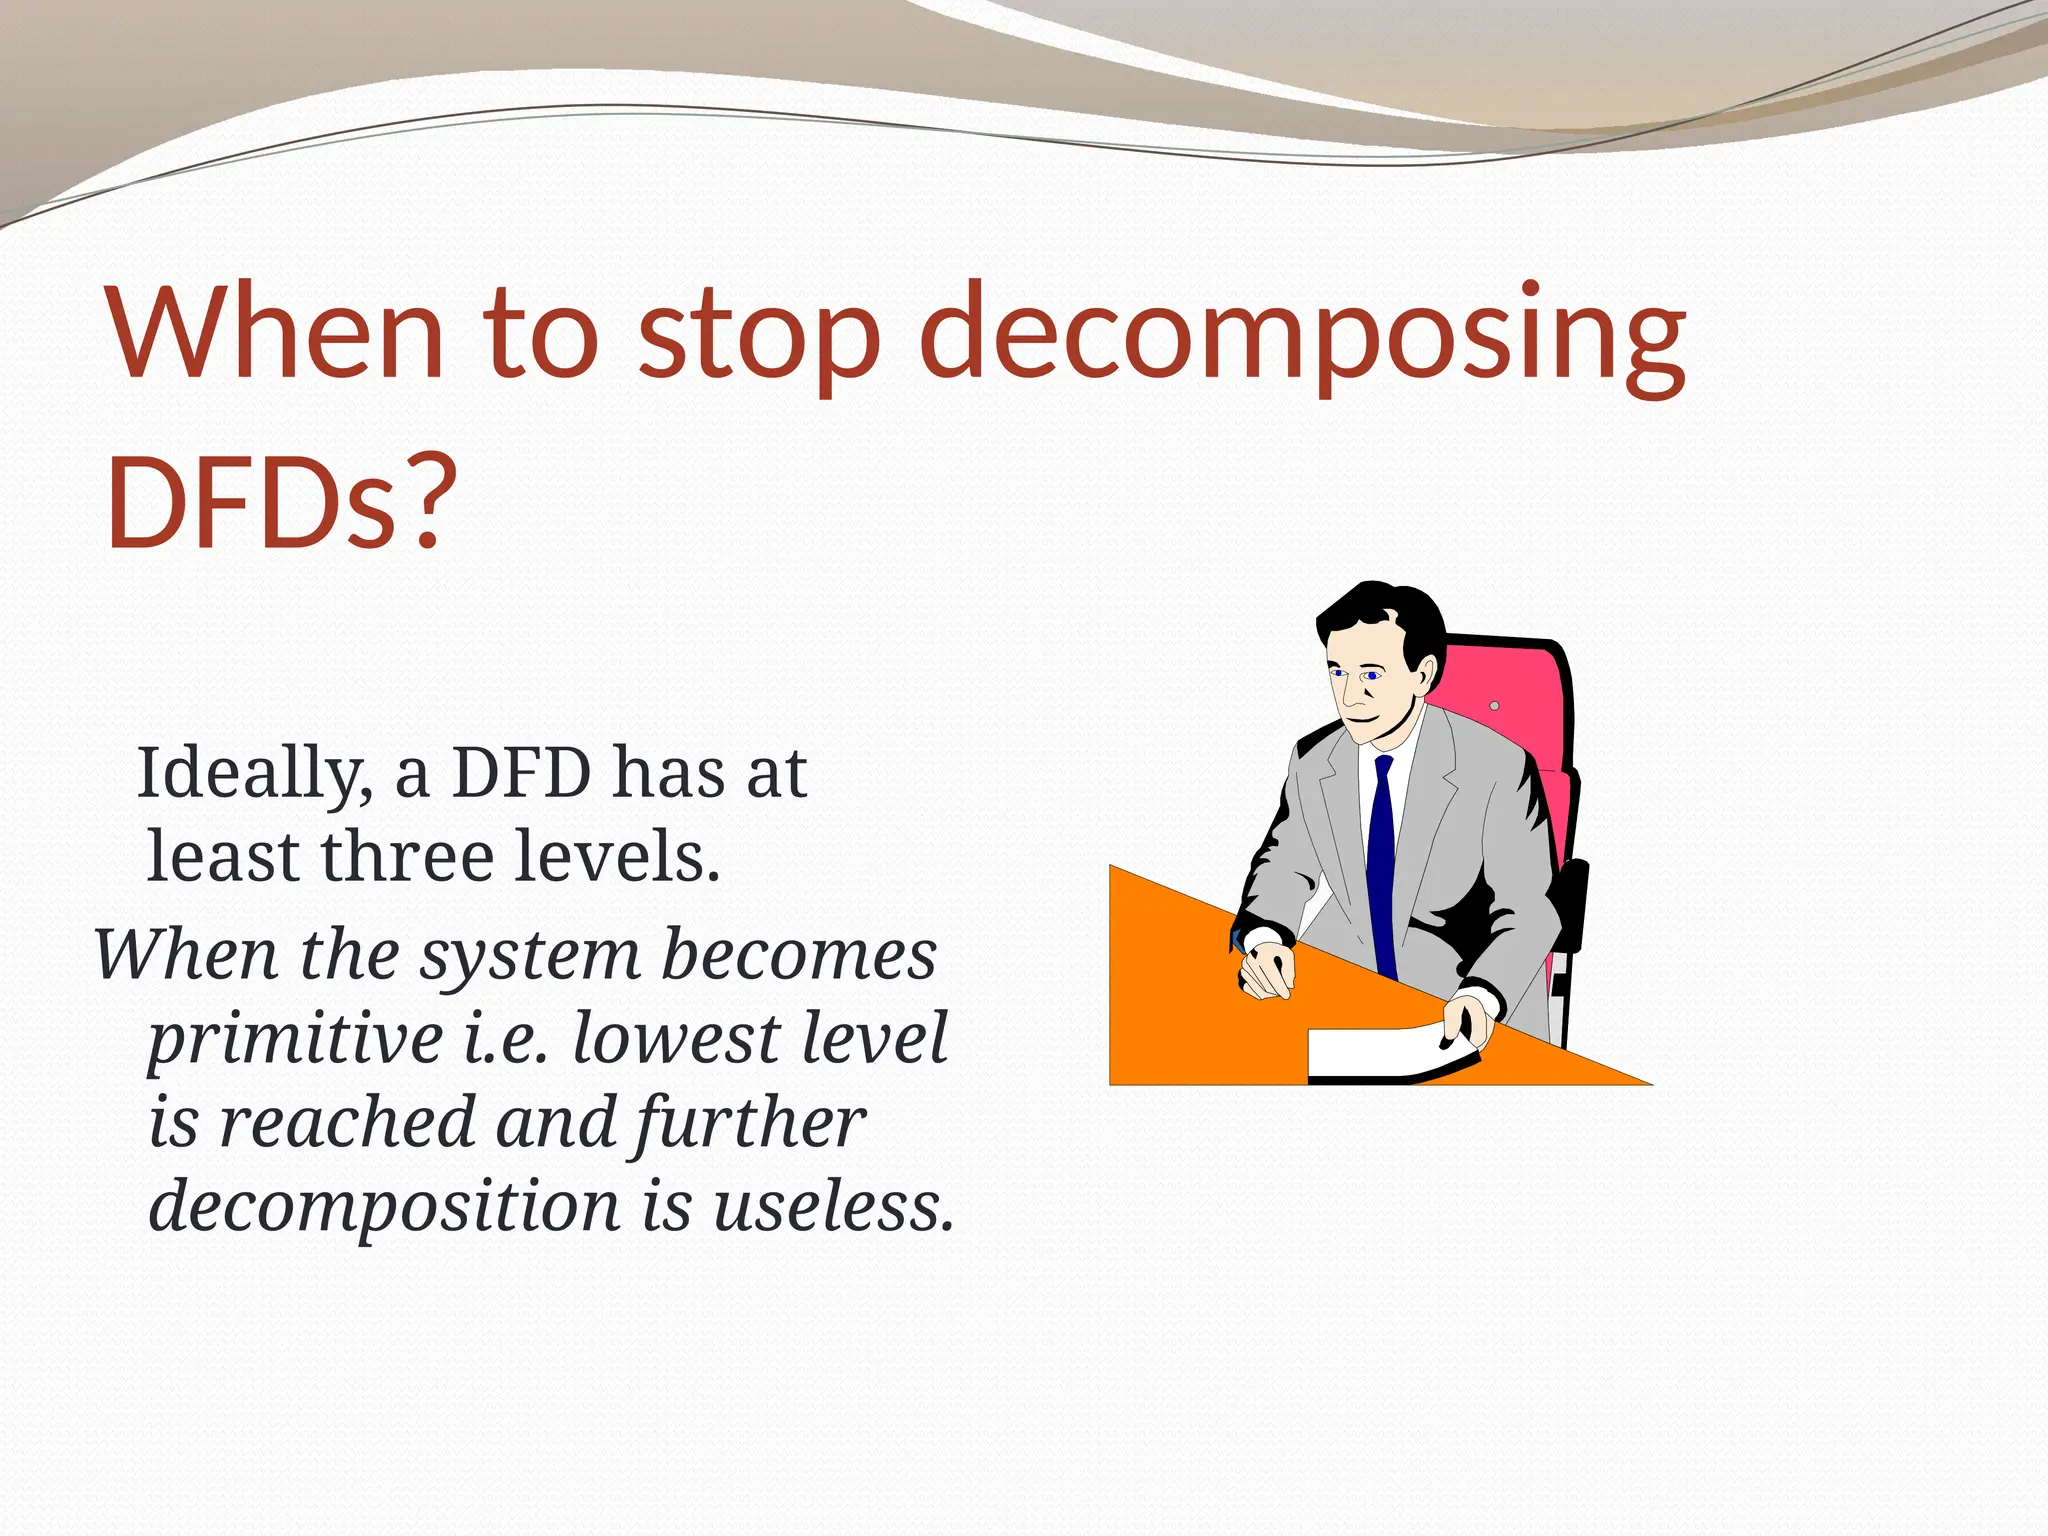
When to stopdecomposing
DFDs?
Ideally, a DFD has at
least three levels.
When the system becomes
primitive i.e. lowest level
is reached and further
decomposition is useless.
31.
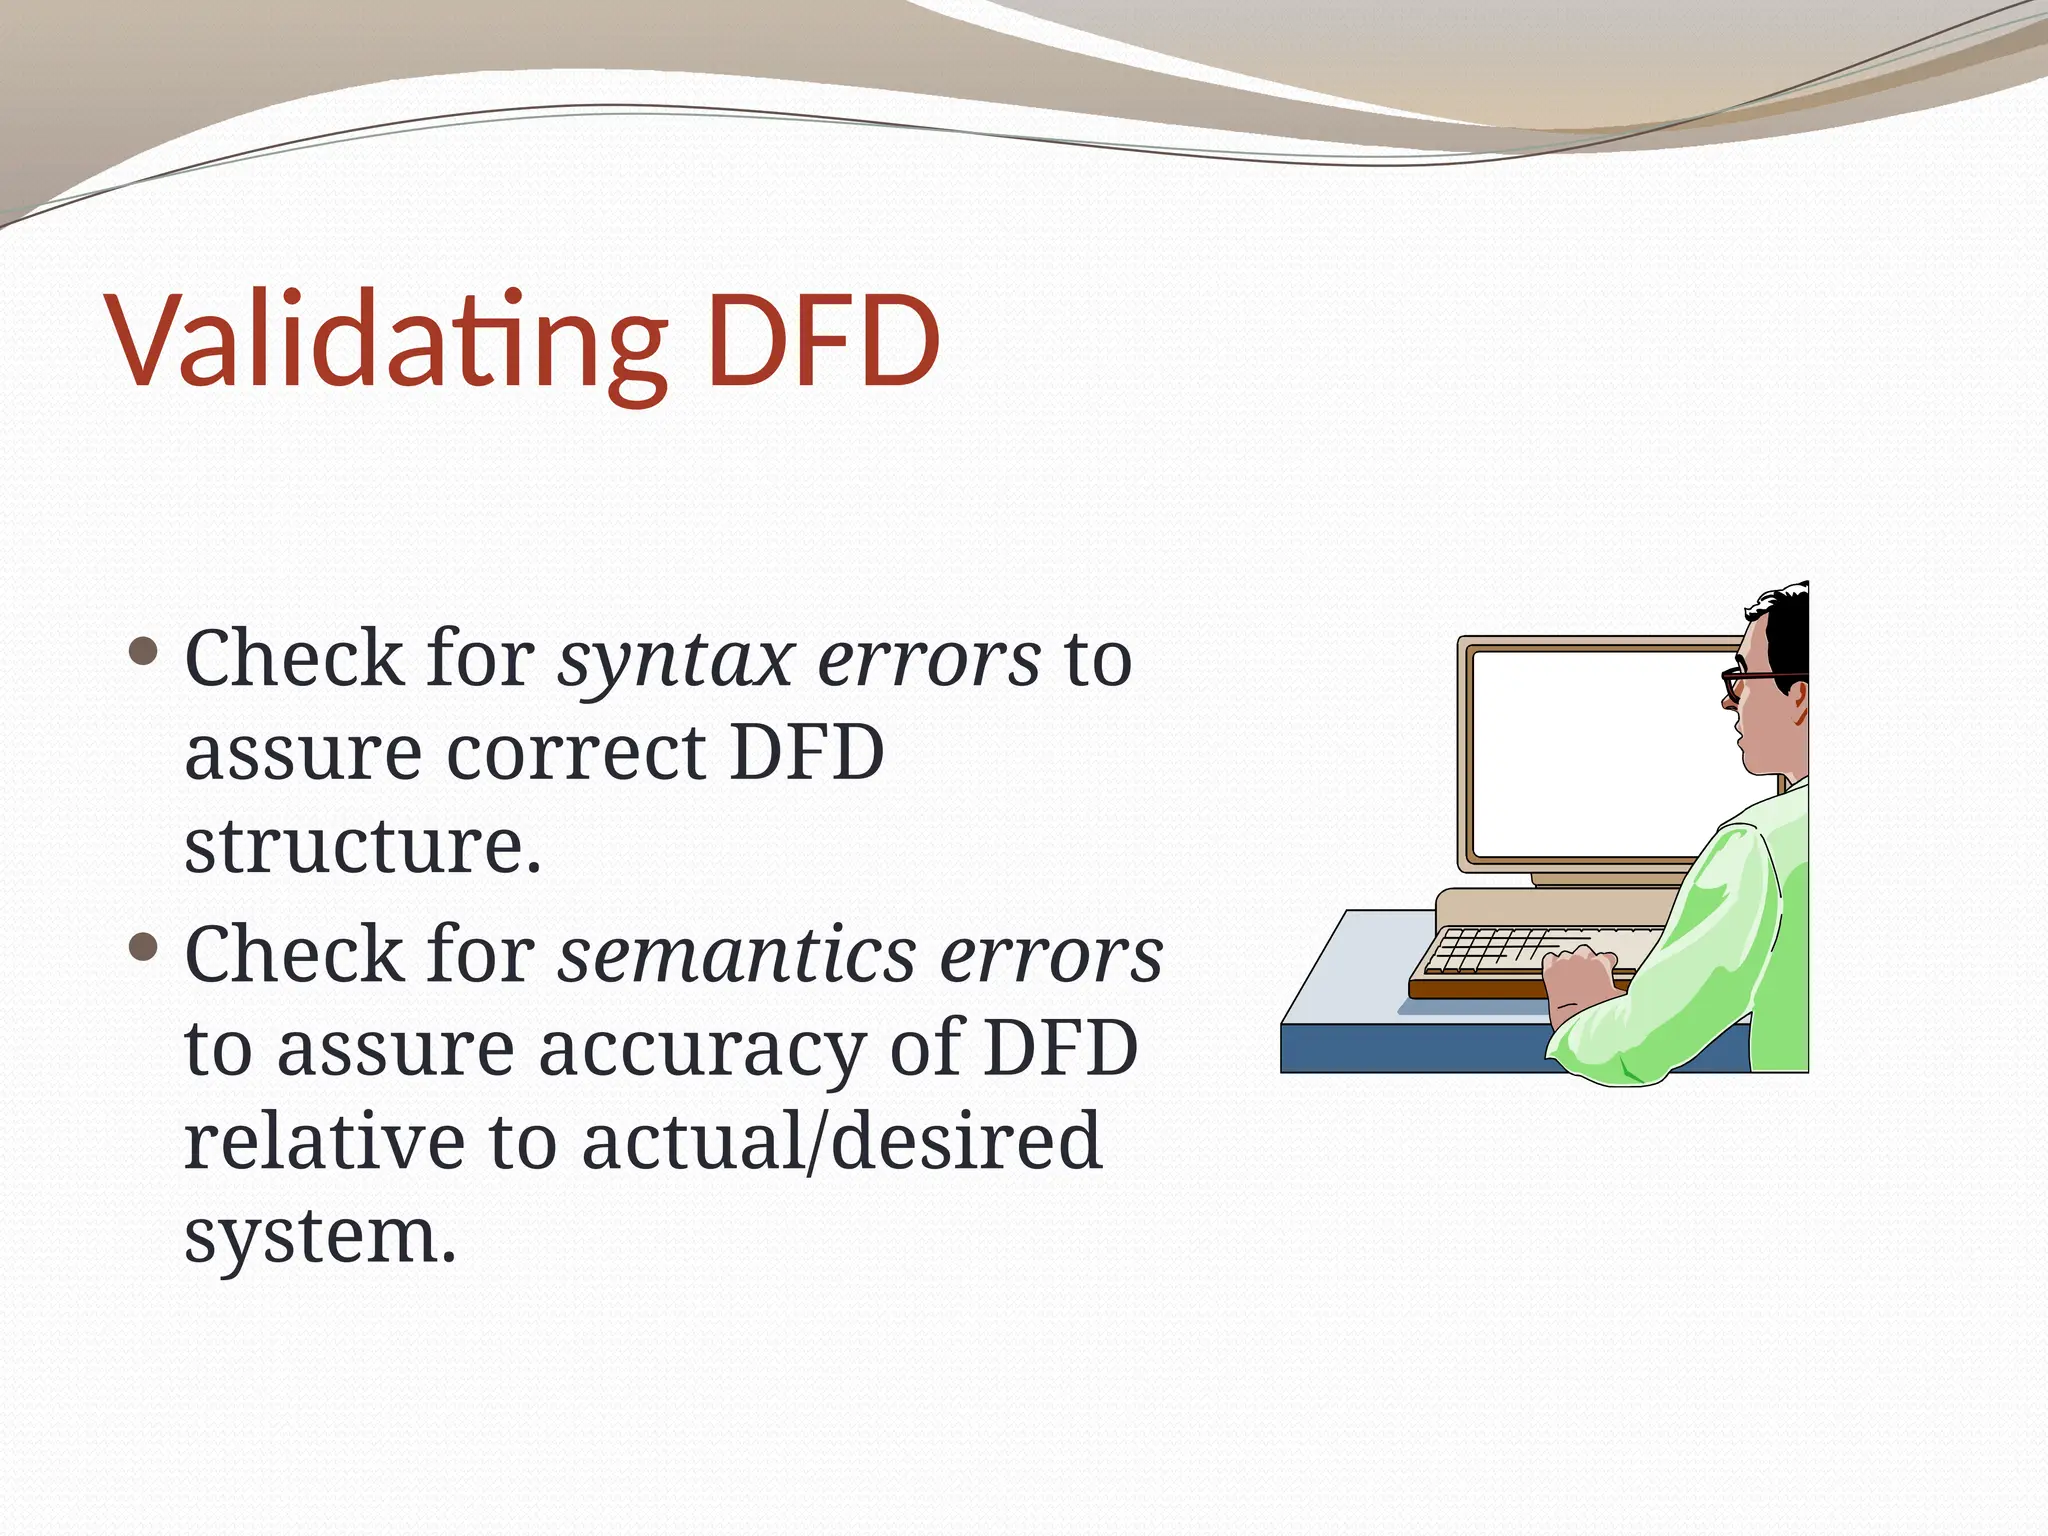
Validating DFD
Checkfor syntax errors to
assure correct DFD
structure.
Check for semantics errors
to assure accuracy of DFD
relative to actual/desired
system.
Add New
Student
2.2
Edit Existing
Student
2.3
Delete
Existing
Student
2.4
StudentData
D1
Cancel
Operation
2.5
Approved Application to Edit
ID of Student
to Delete
Determination to
Cancel Operation
Determine
Operation
2.1
Approved Application
Request for Student
Information Maintenance
Approved Application
to Add
Verified Approved
Application
Verified Changed
Student Data
Verified ID of
Student to Delete
Level 1 Process 2, Maintain Student
Information
36.
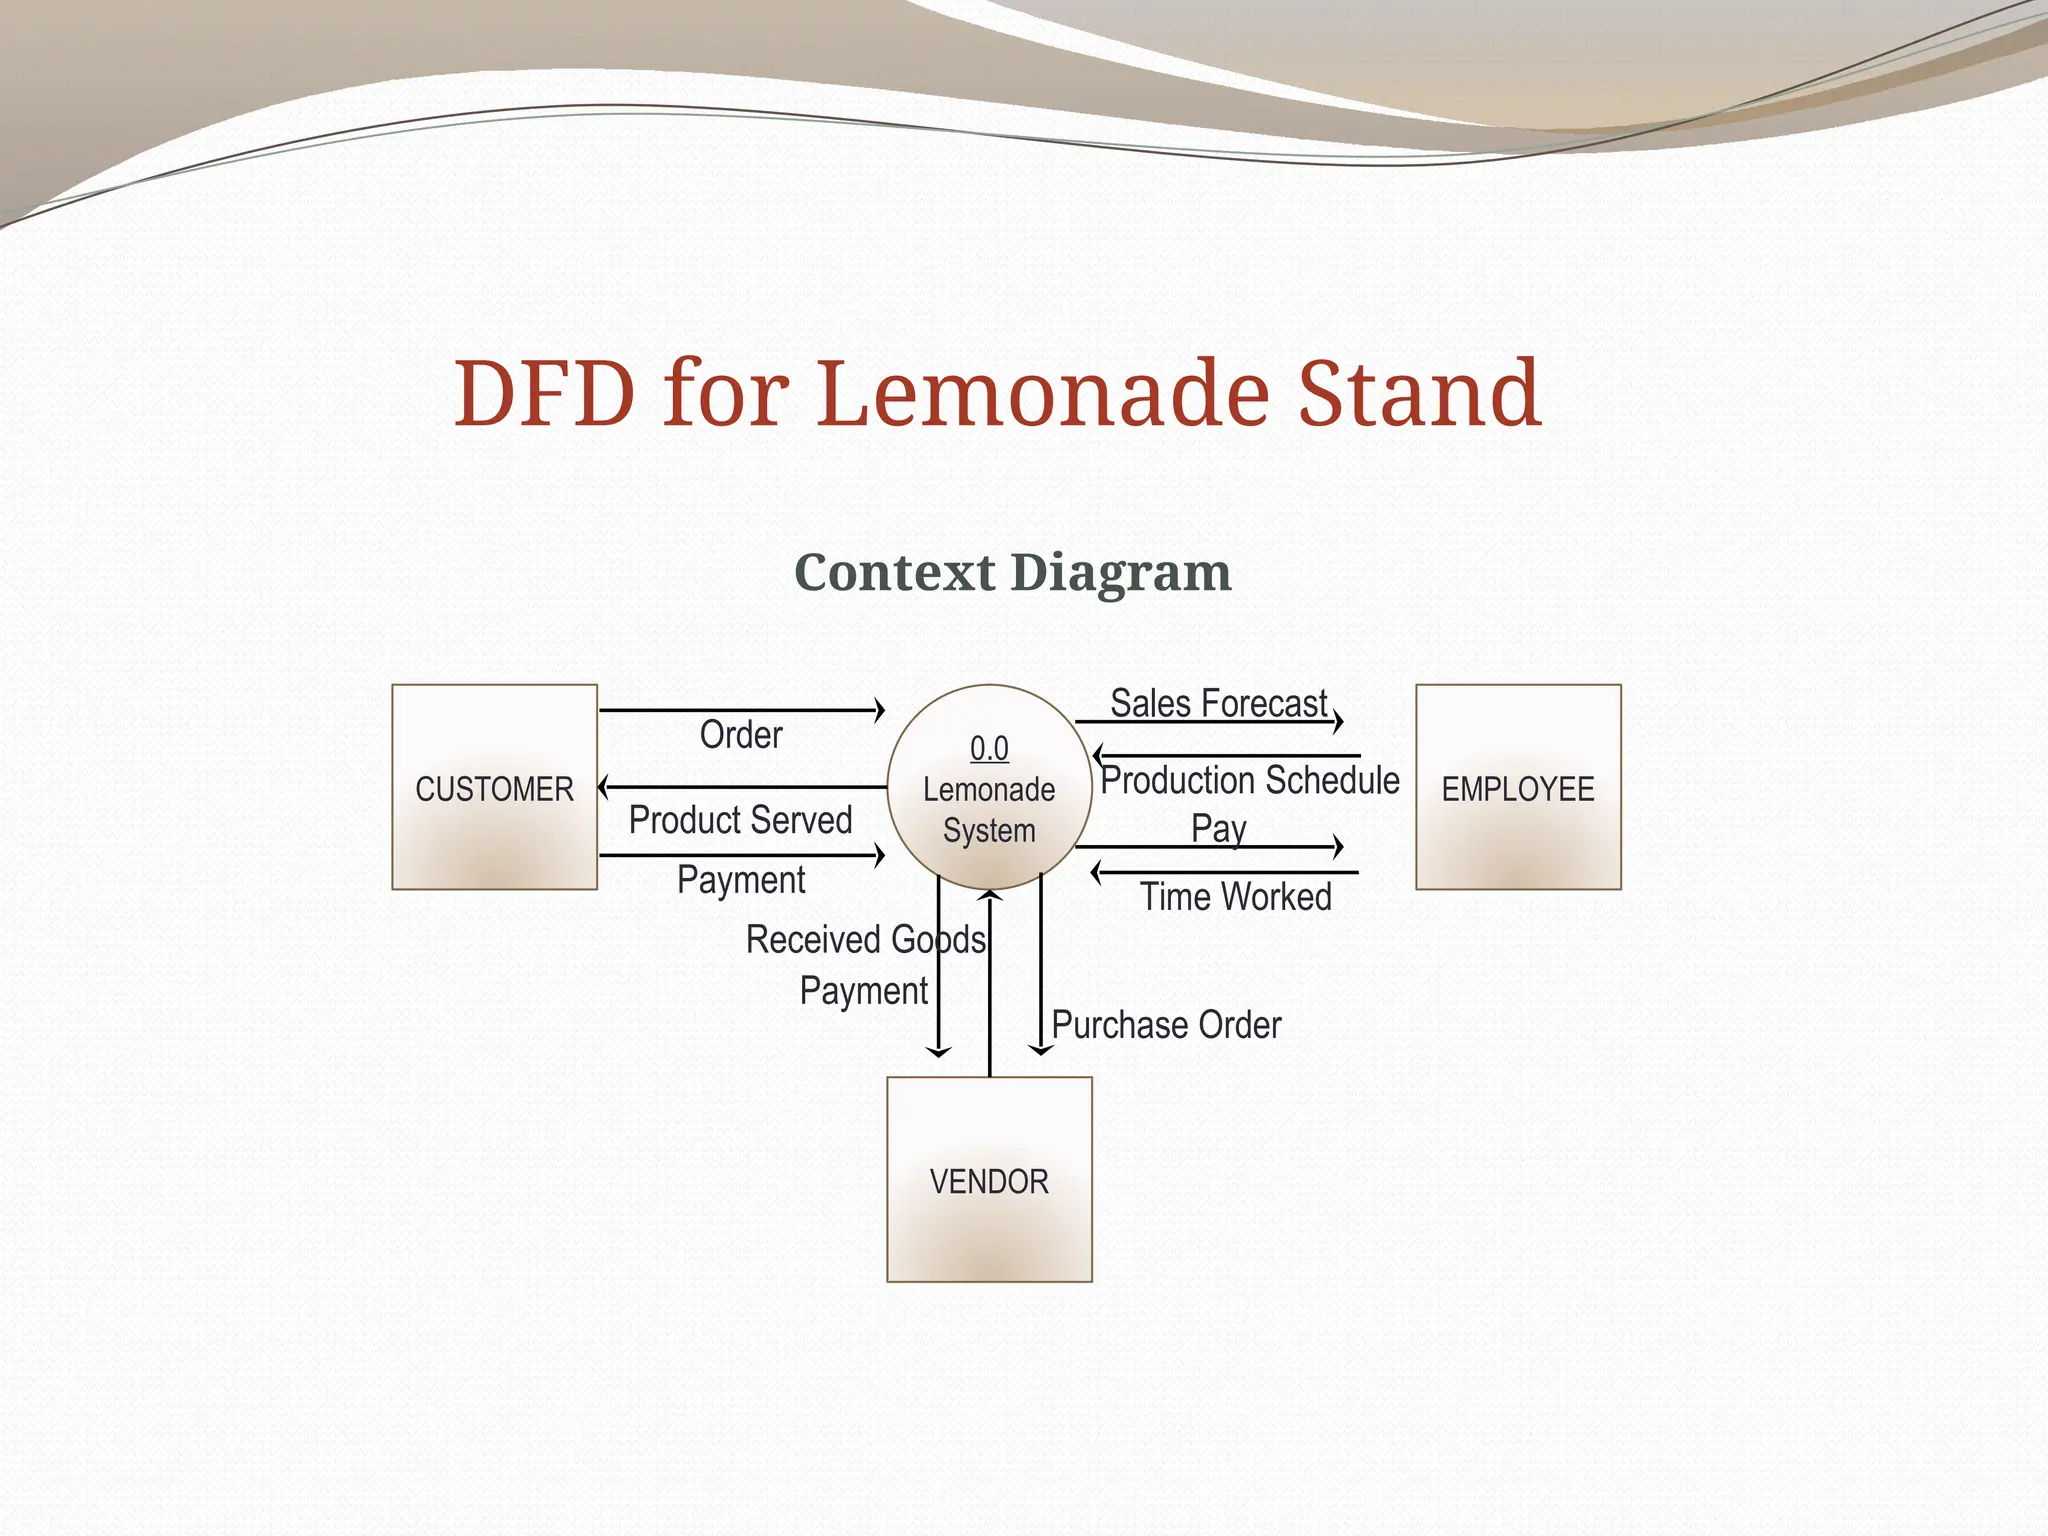
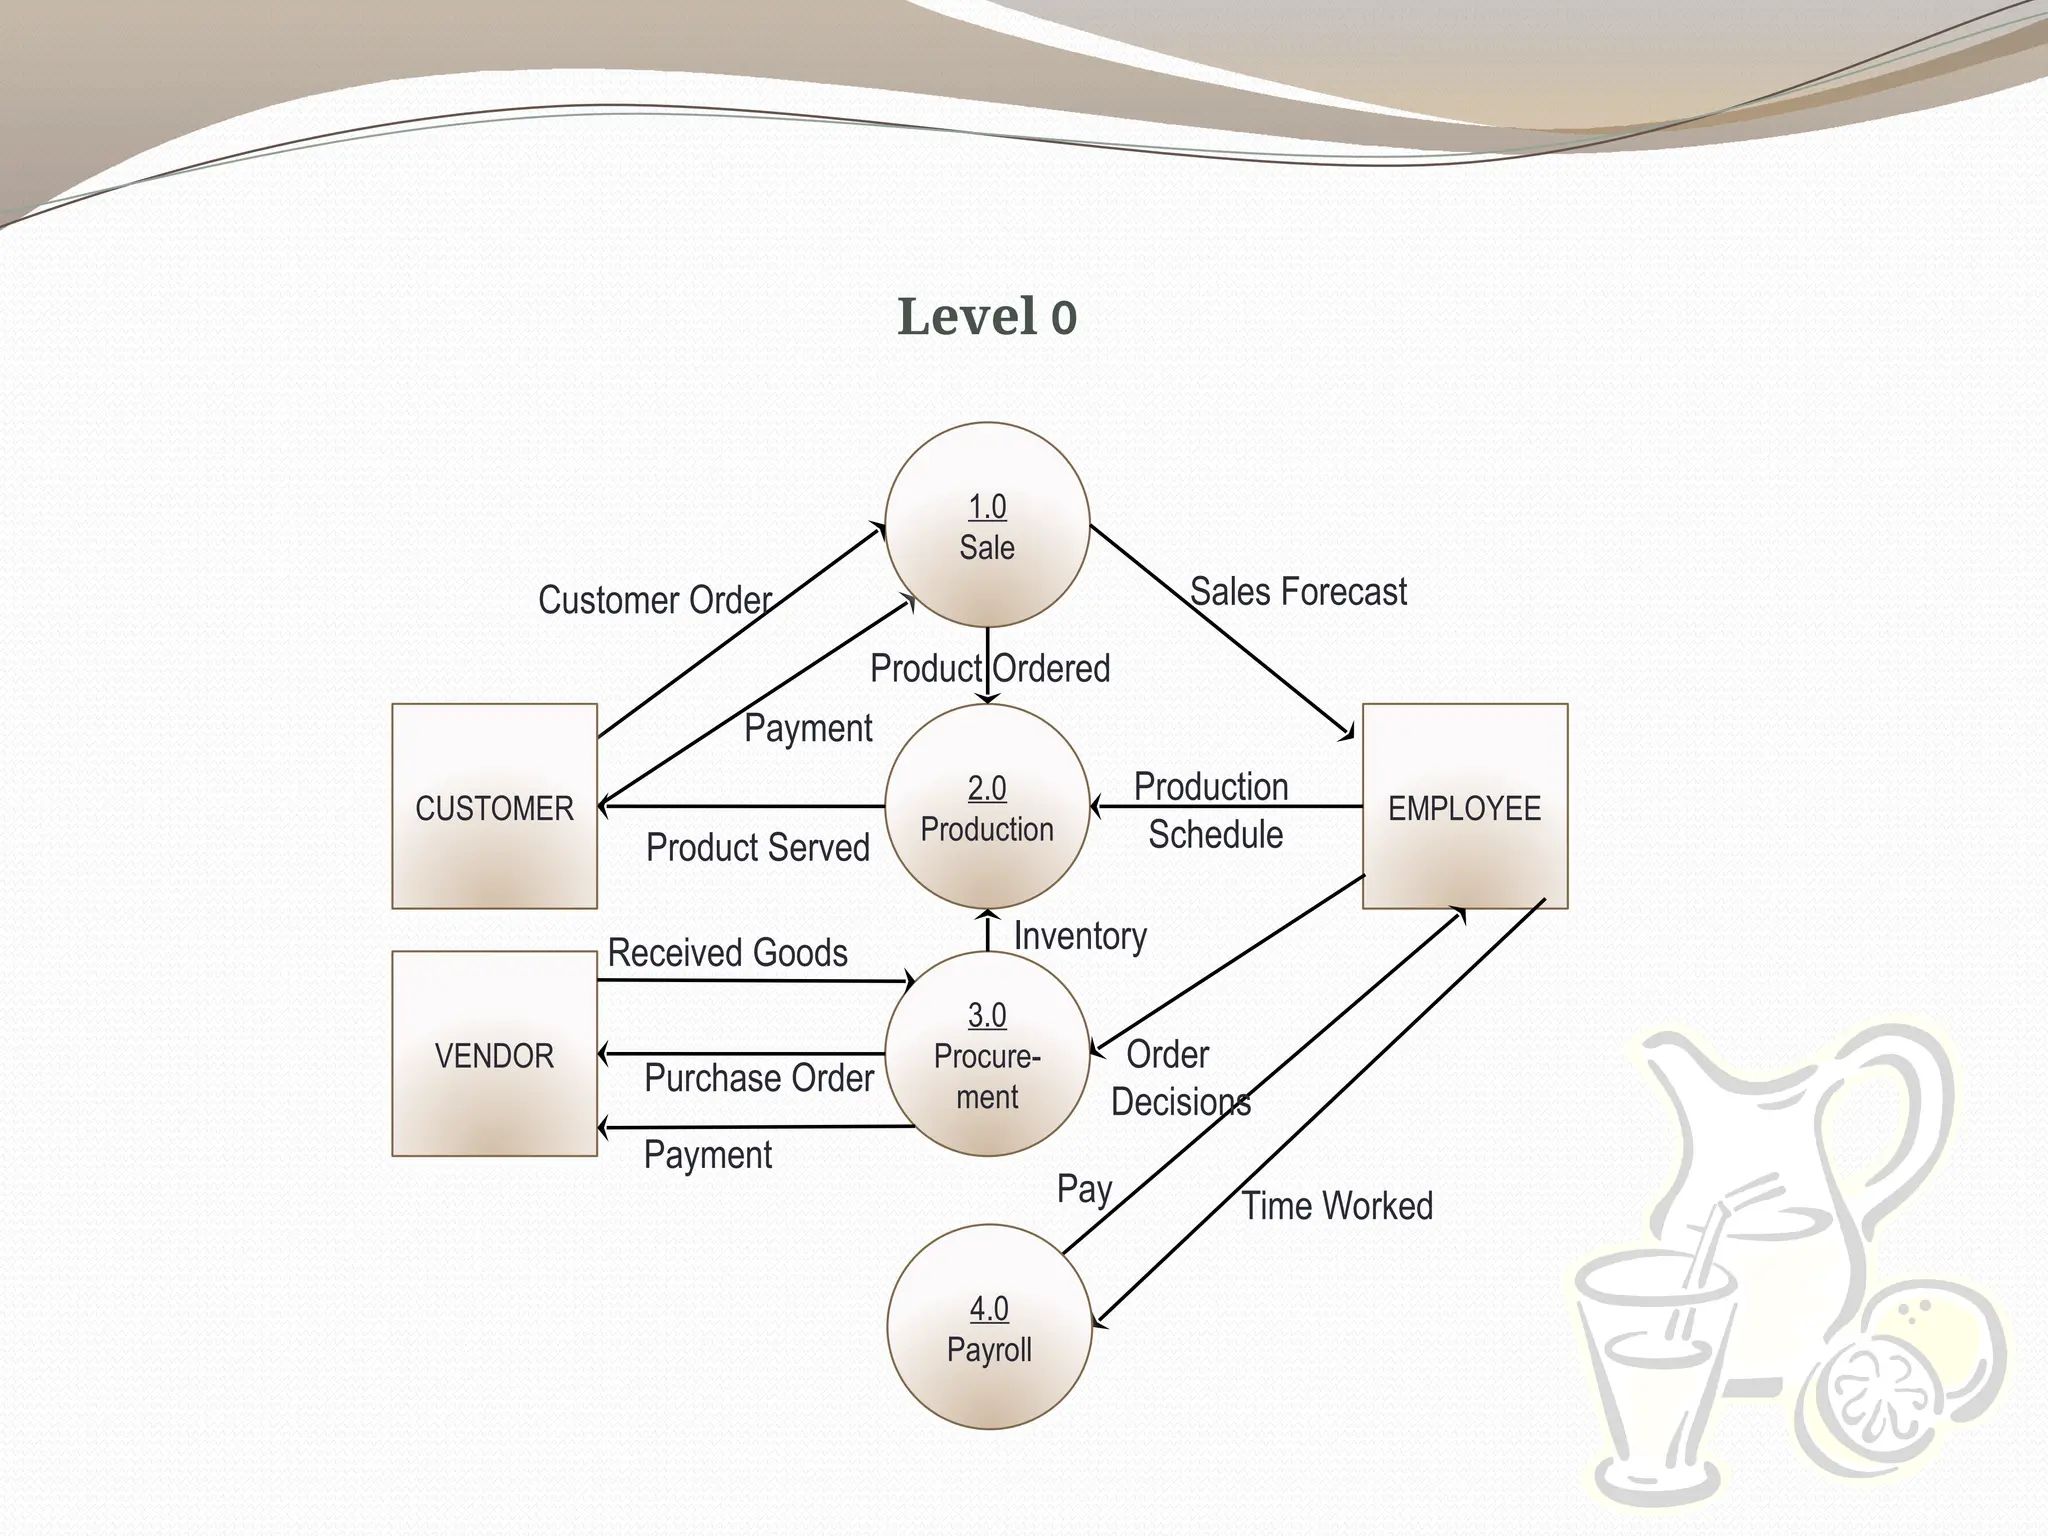
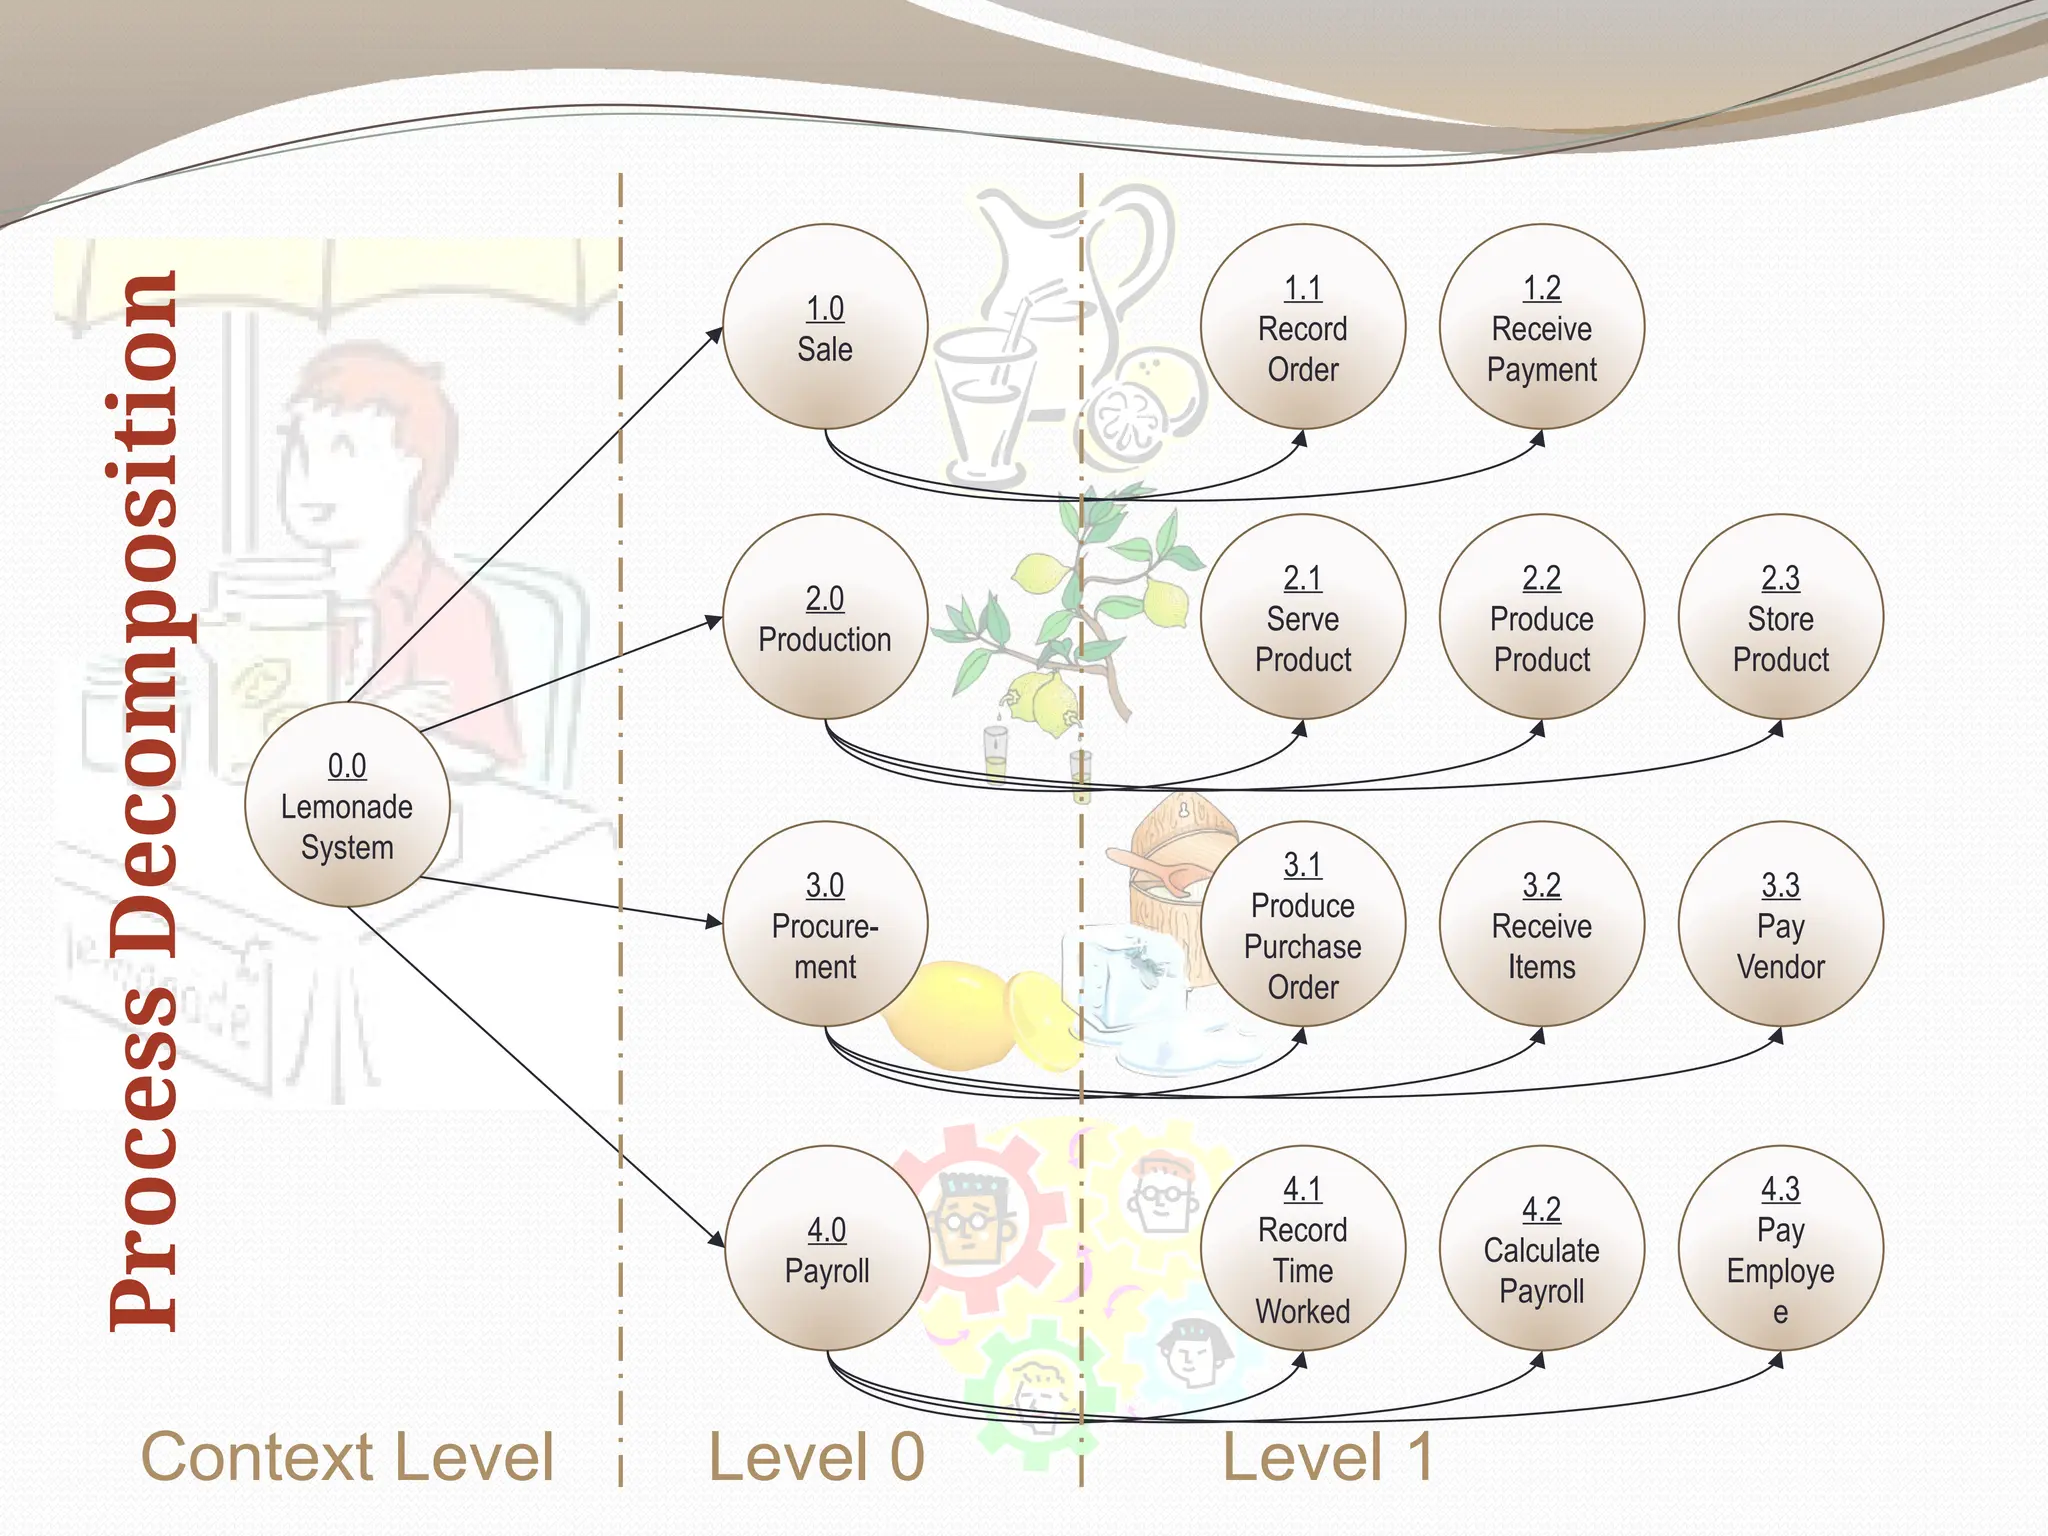
Context Diagram
DFD forLemonade Stand
0.0
Lemonade
System
EMPLOYEE
CUSTOMER
Pay
Payment
Order
VENDOR
Payment
Purchase Order
Production Schedule
Received Goods
Time Worked
Sales Forecast
Product Served
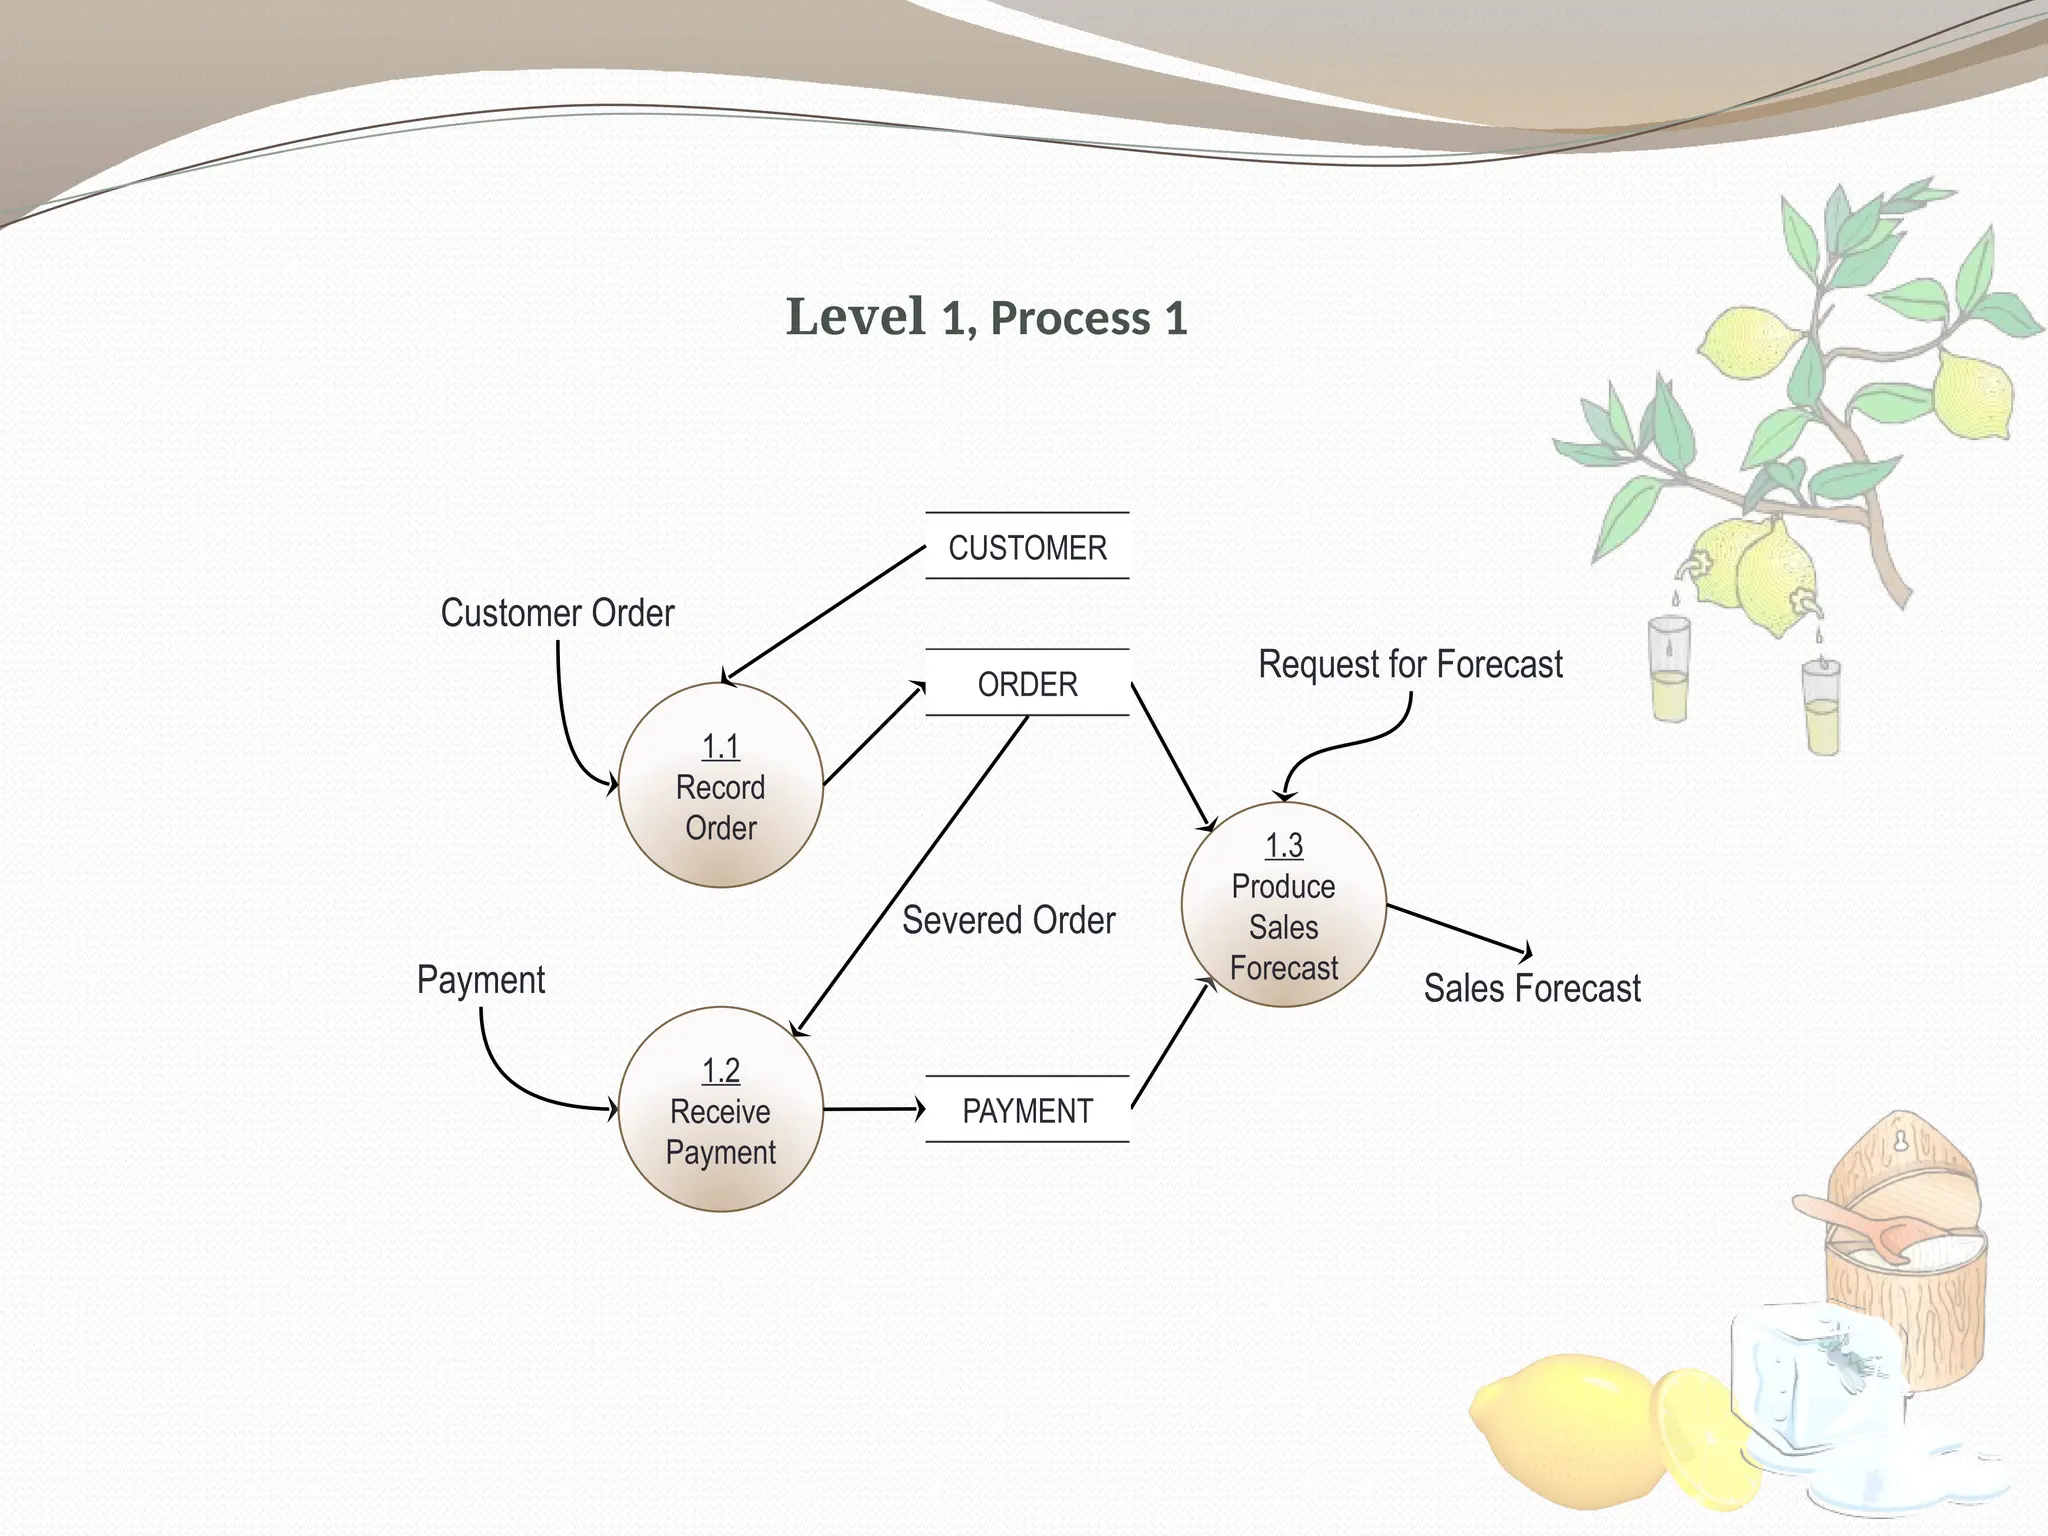
Level 1, Process1
1.3
Produce
Sales
Forecast
Sales Forecast
Payment
1.1
Record
Order
Customer Order
ORDER
1.2
Receive
Payment
PAYMENT
Severed Order
Request for Forecast
CUSTOMER
39.
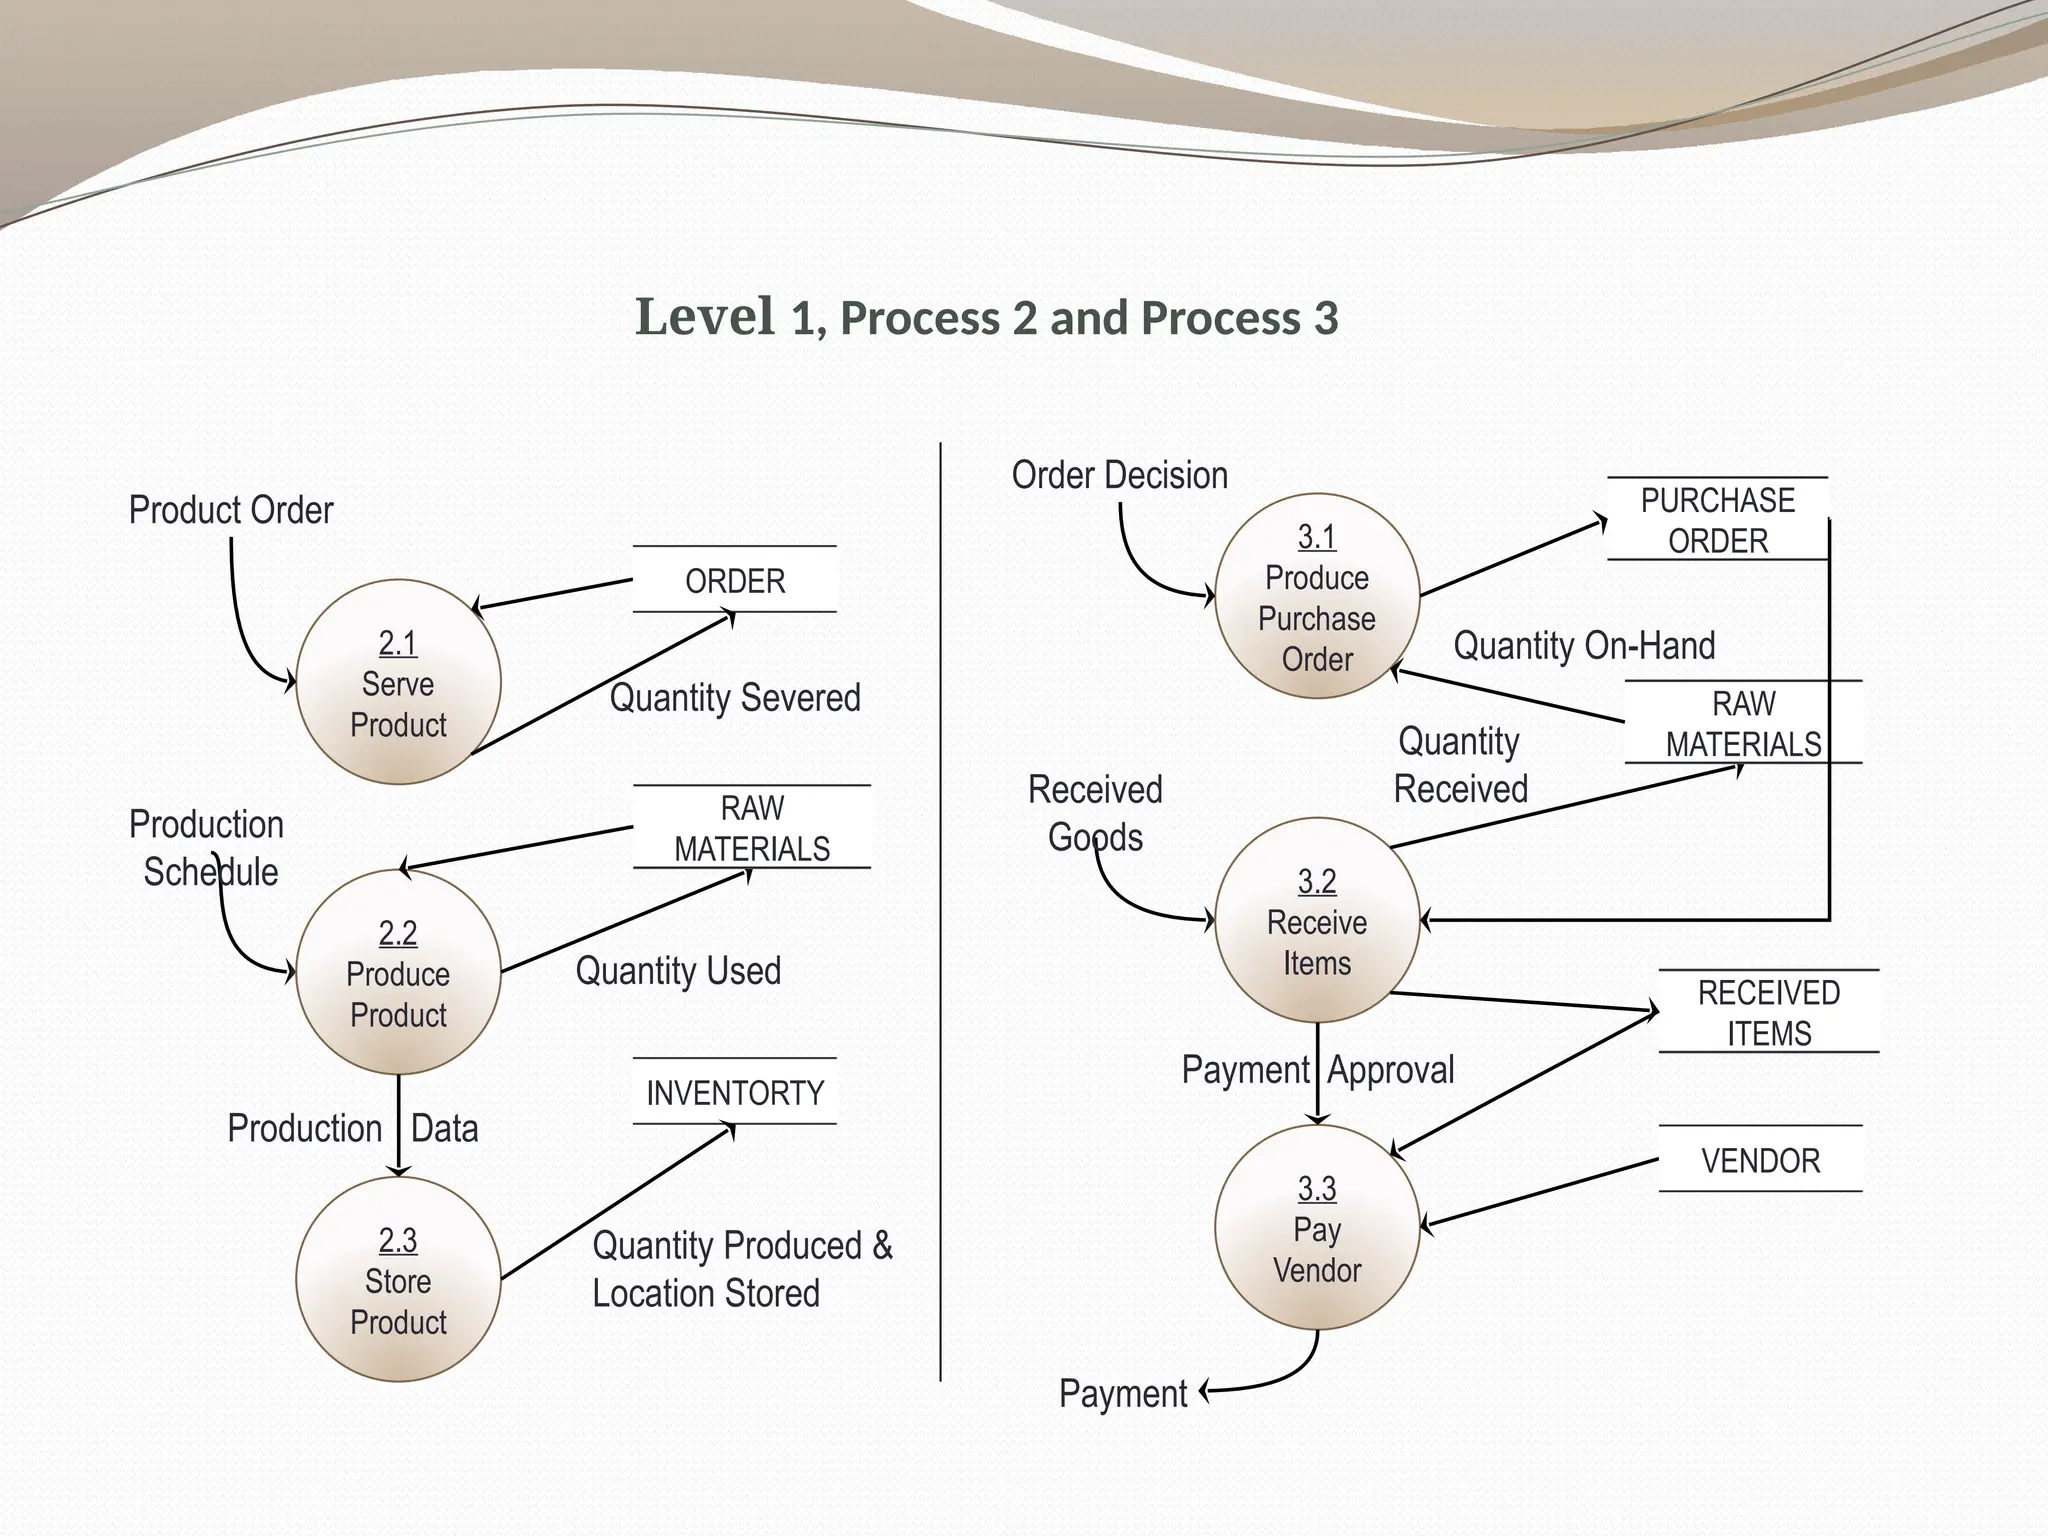
Level 1, Process2 and Process 3
2.1
Serve
Product
Product Order
ORDER
2.2
Produce
Product
INVENTORTY
Quantity Severed
Production
Schedule
RAW
MATERIALS
2.3
Store
Product
Quantity Produced &
Location Stored
Quantity Used
Production Data
3.1
Produce
Purchase
Order
Order Decision
PURCHASE
ORDER
3.2
Receive
Items
Received
Goods
RAW
MATERIALS
3.3
Pay
Vendor
Quantity
Received
Quantity On-Hand
RECEIVED
ITEMS
VENDOR
Payment Approval
Payment
40.
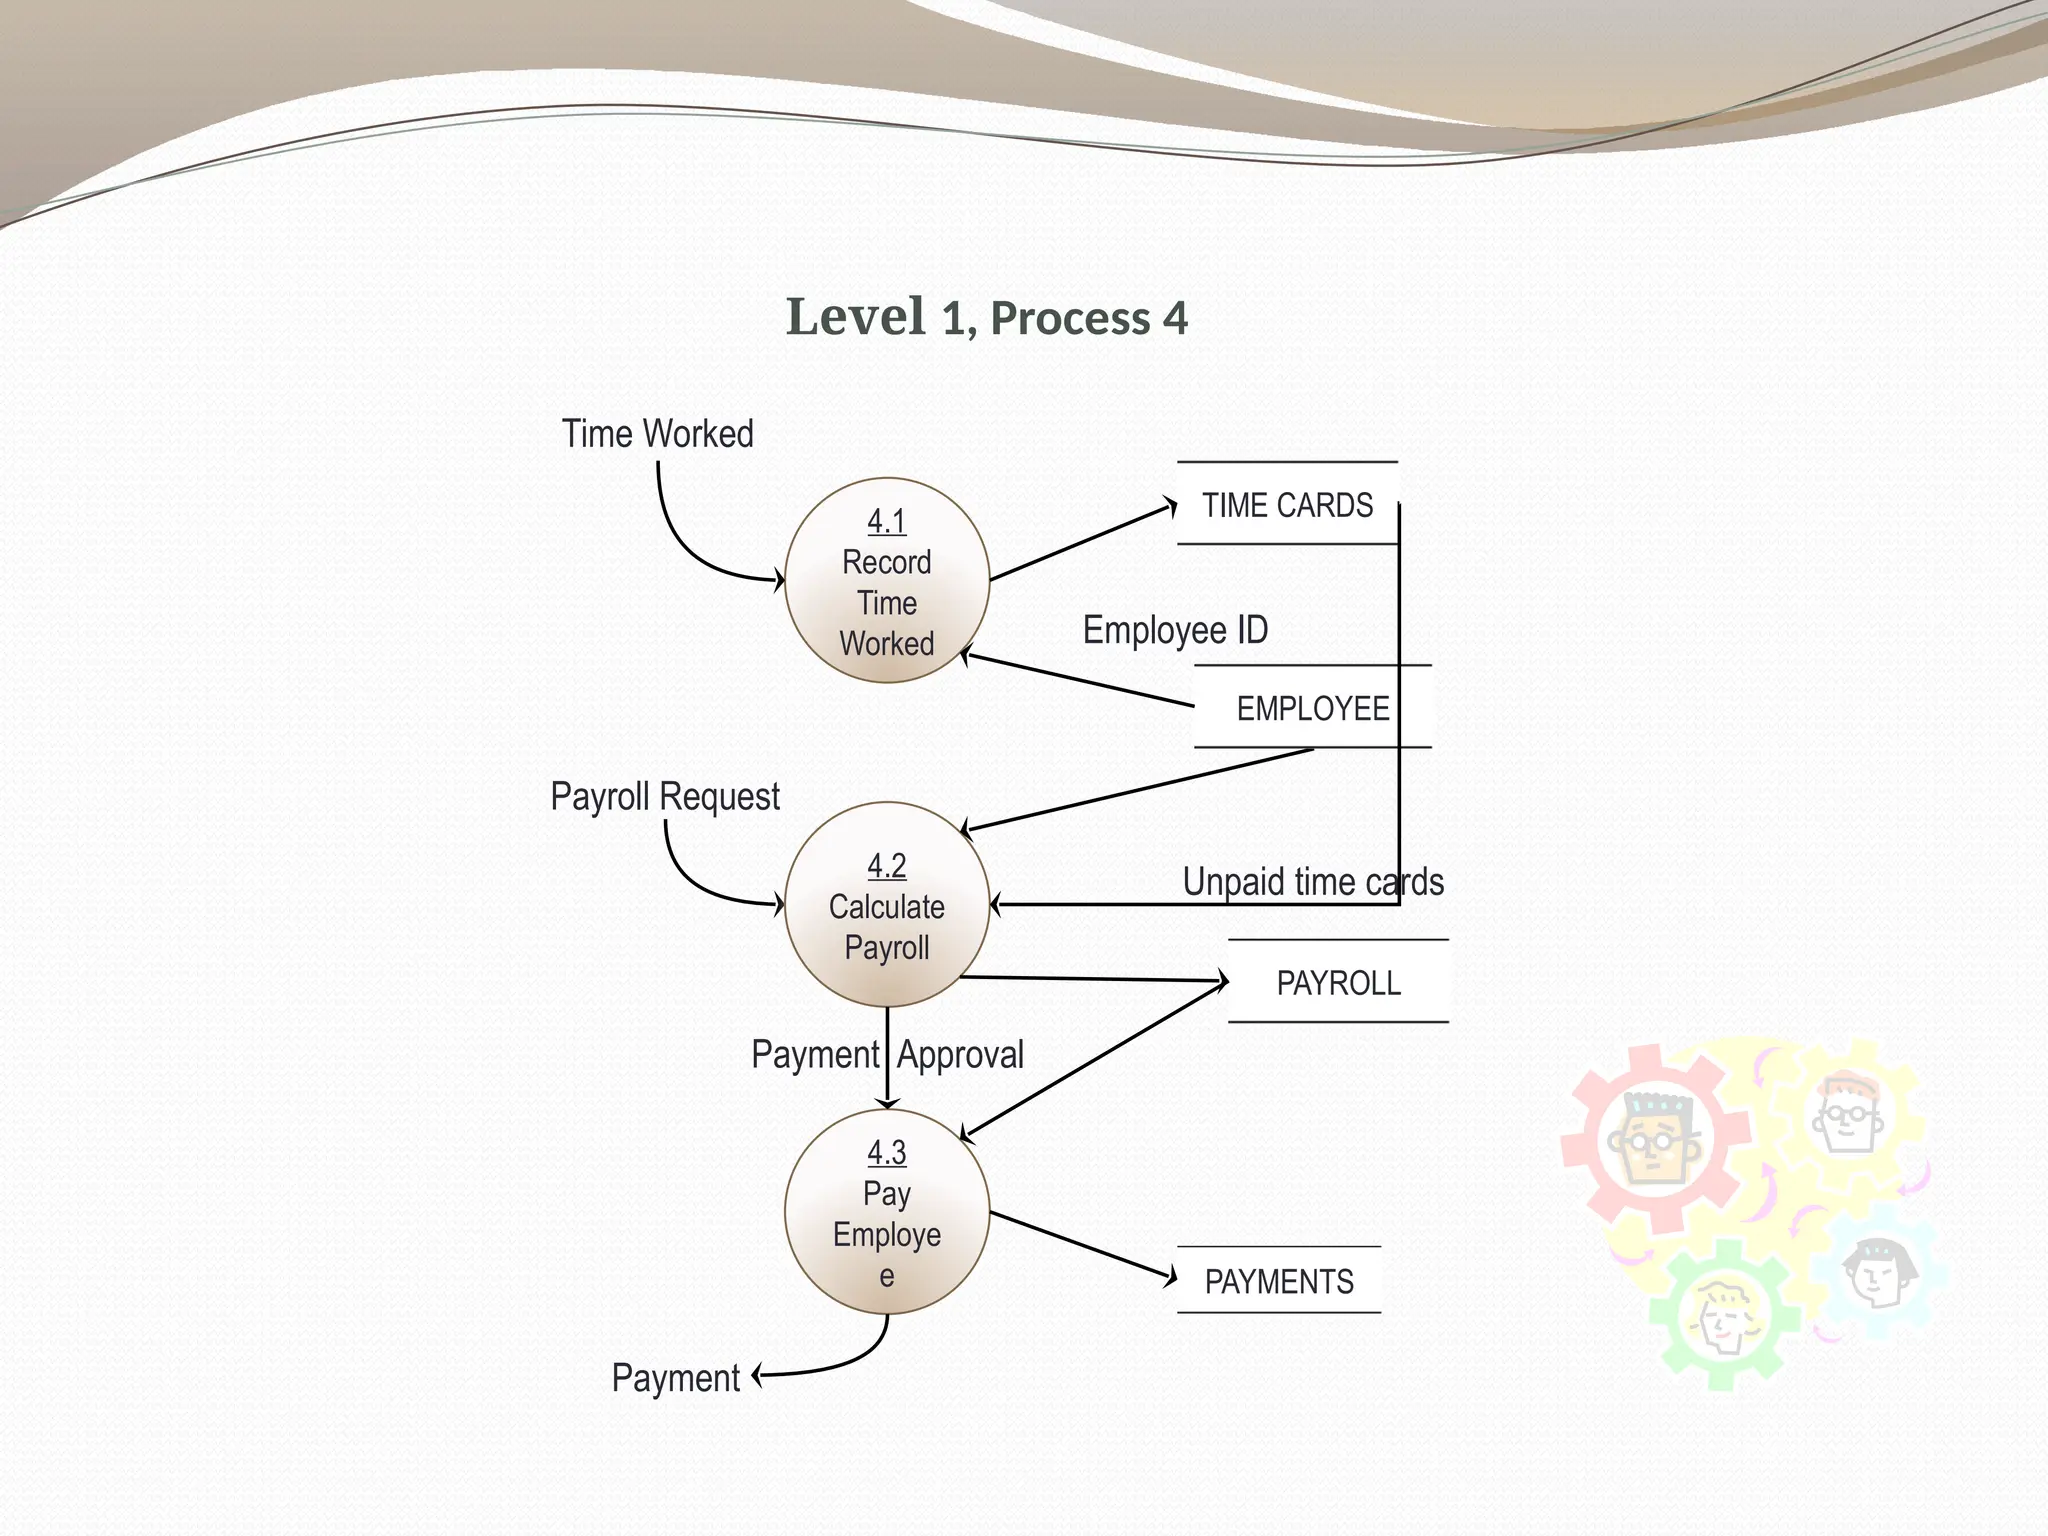
Level 1, Process4
Time Worked
4.1
Record
Time
Worked
TIME CARDS
4.2
Calculate
Payroll
Payroll Request
EMPLOYEE
4.3
Pay
Employe
e
Employee ID
PAYROLL
PAYMENTS
Payment Approval
Payment
Unpaid time cards
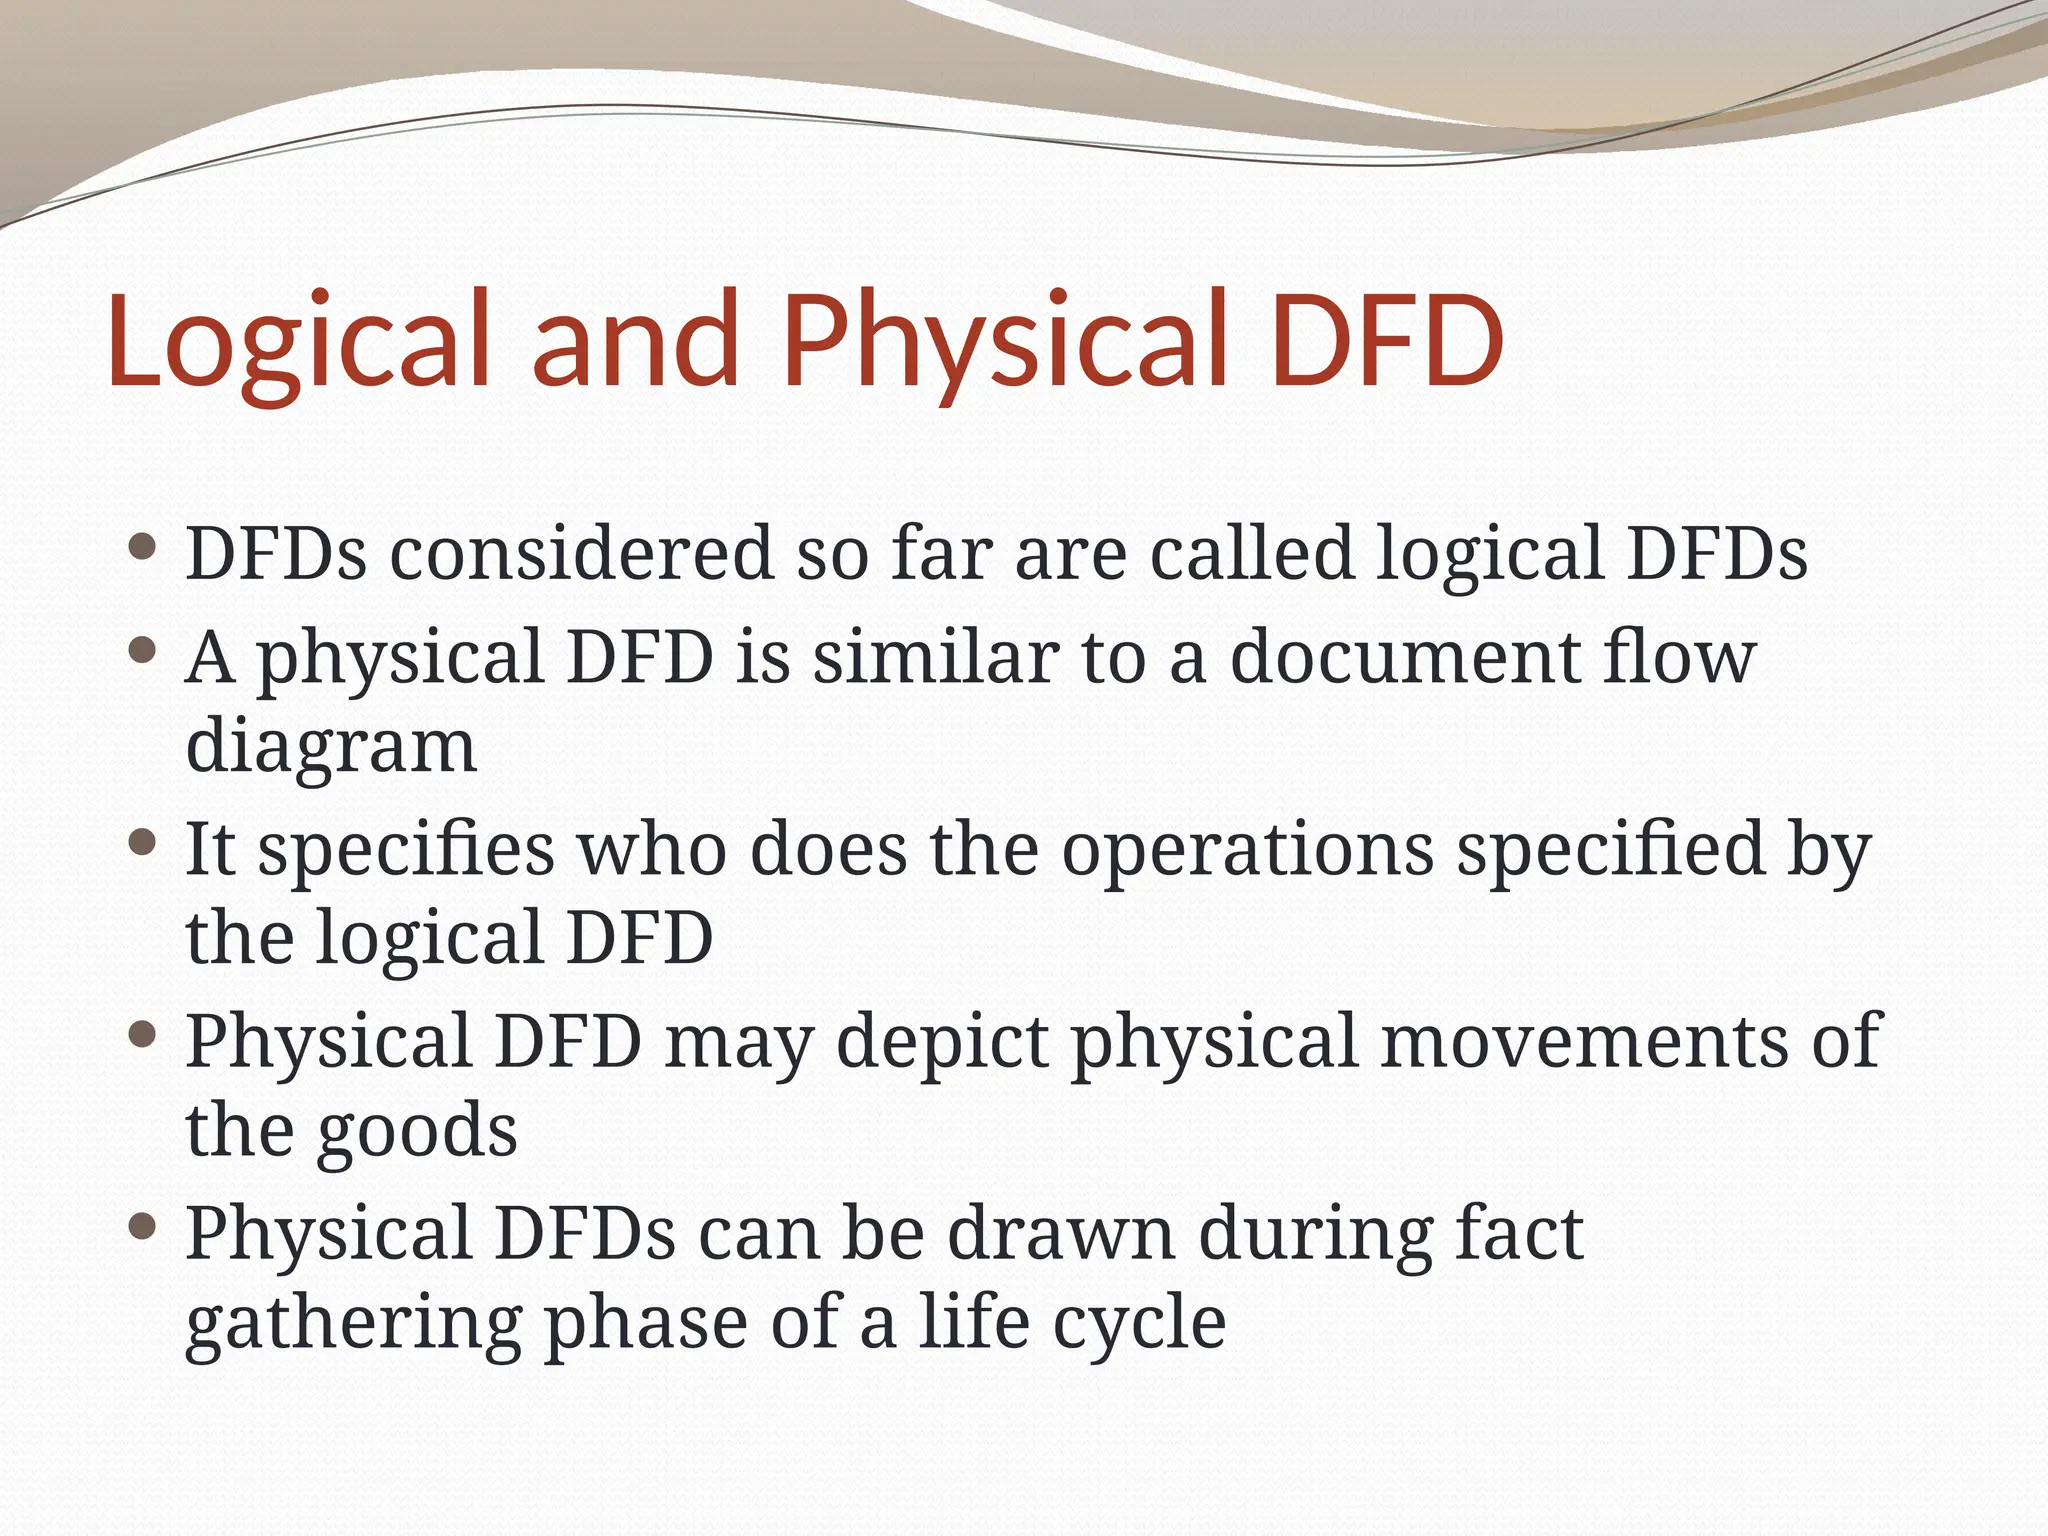
Logical and PhysicalDFD
DFDs considered so far are called logical DFDs
A physical DFD is similar to a document flow
diagram
It specifies who does the operations specified by
the logical DFD
Physical DFD may depict physical movements of
the goods
Physical DFDs can be drawn during fact
gathering phase of a life cycle
43.
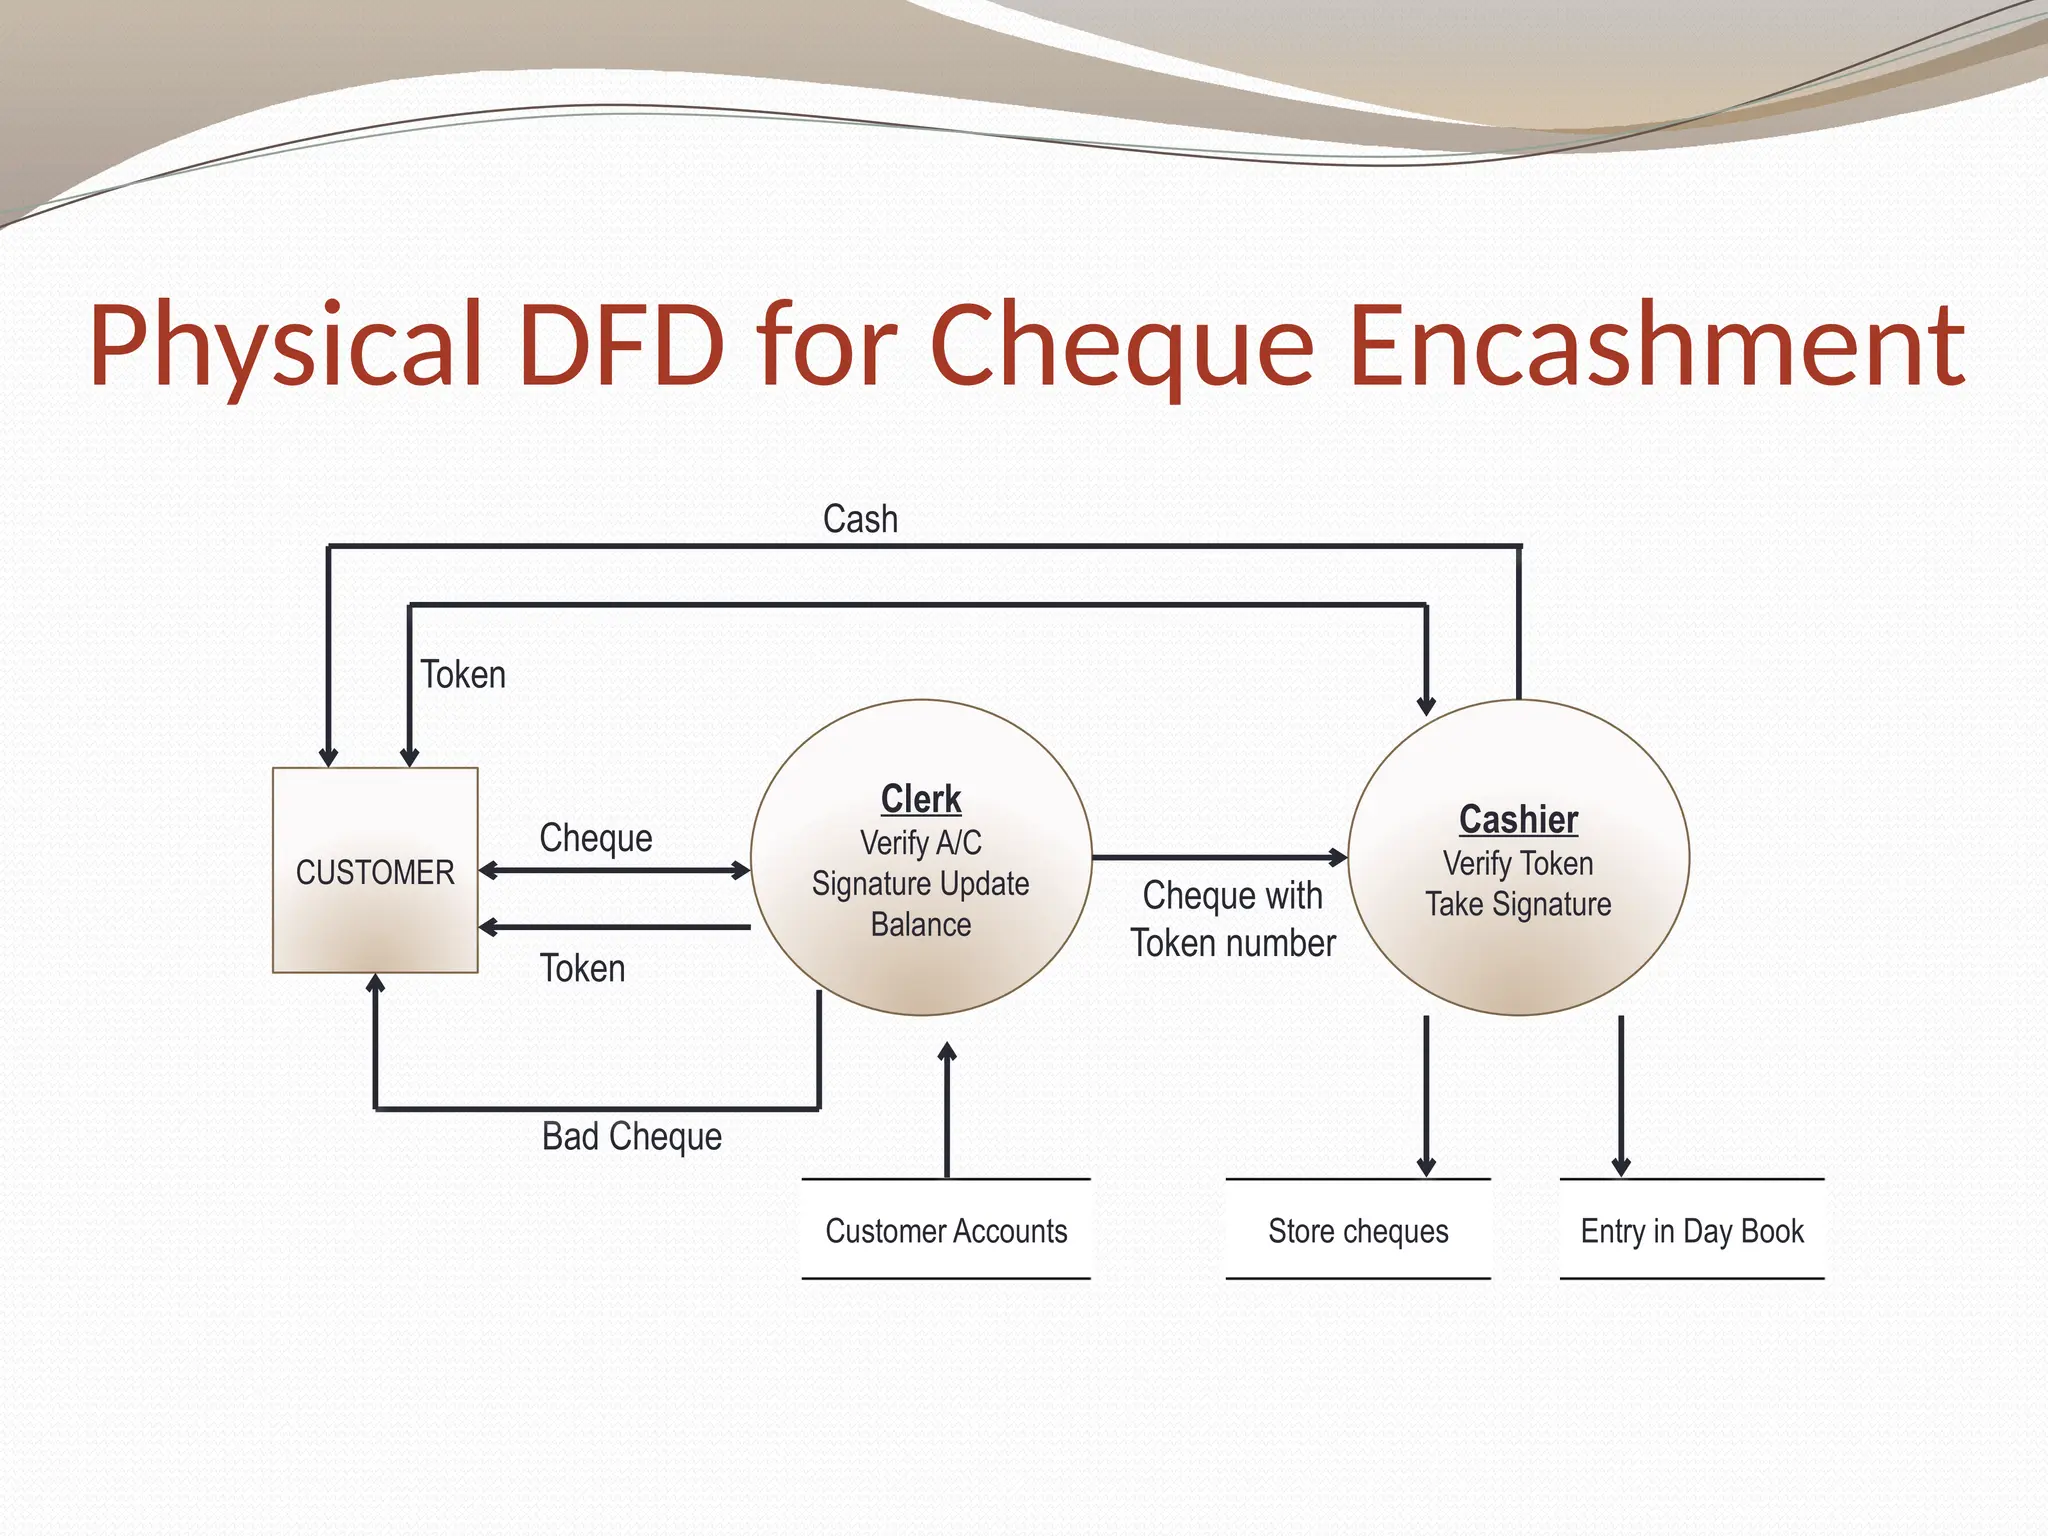
Physical DFD forCheque Encashment
Cash
Clerk
Verify A/C
Signature Update
Balance
Bad Cheque
Store cheques
Customer Accounts
Cheque
Cheque with
Token number
Cashier
Verify Token
Take Signature
Entry in Day Book
CUSTOMER
Token
Token
44.
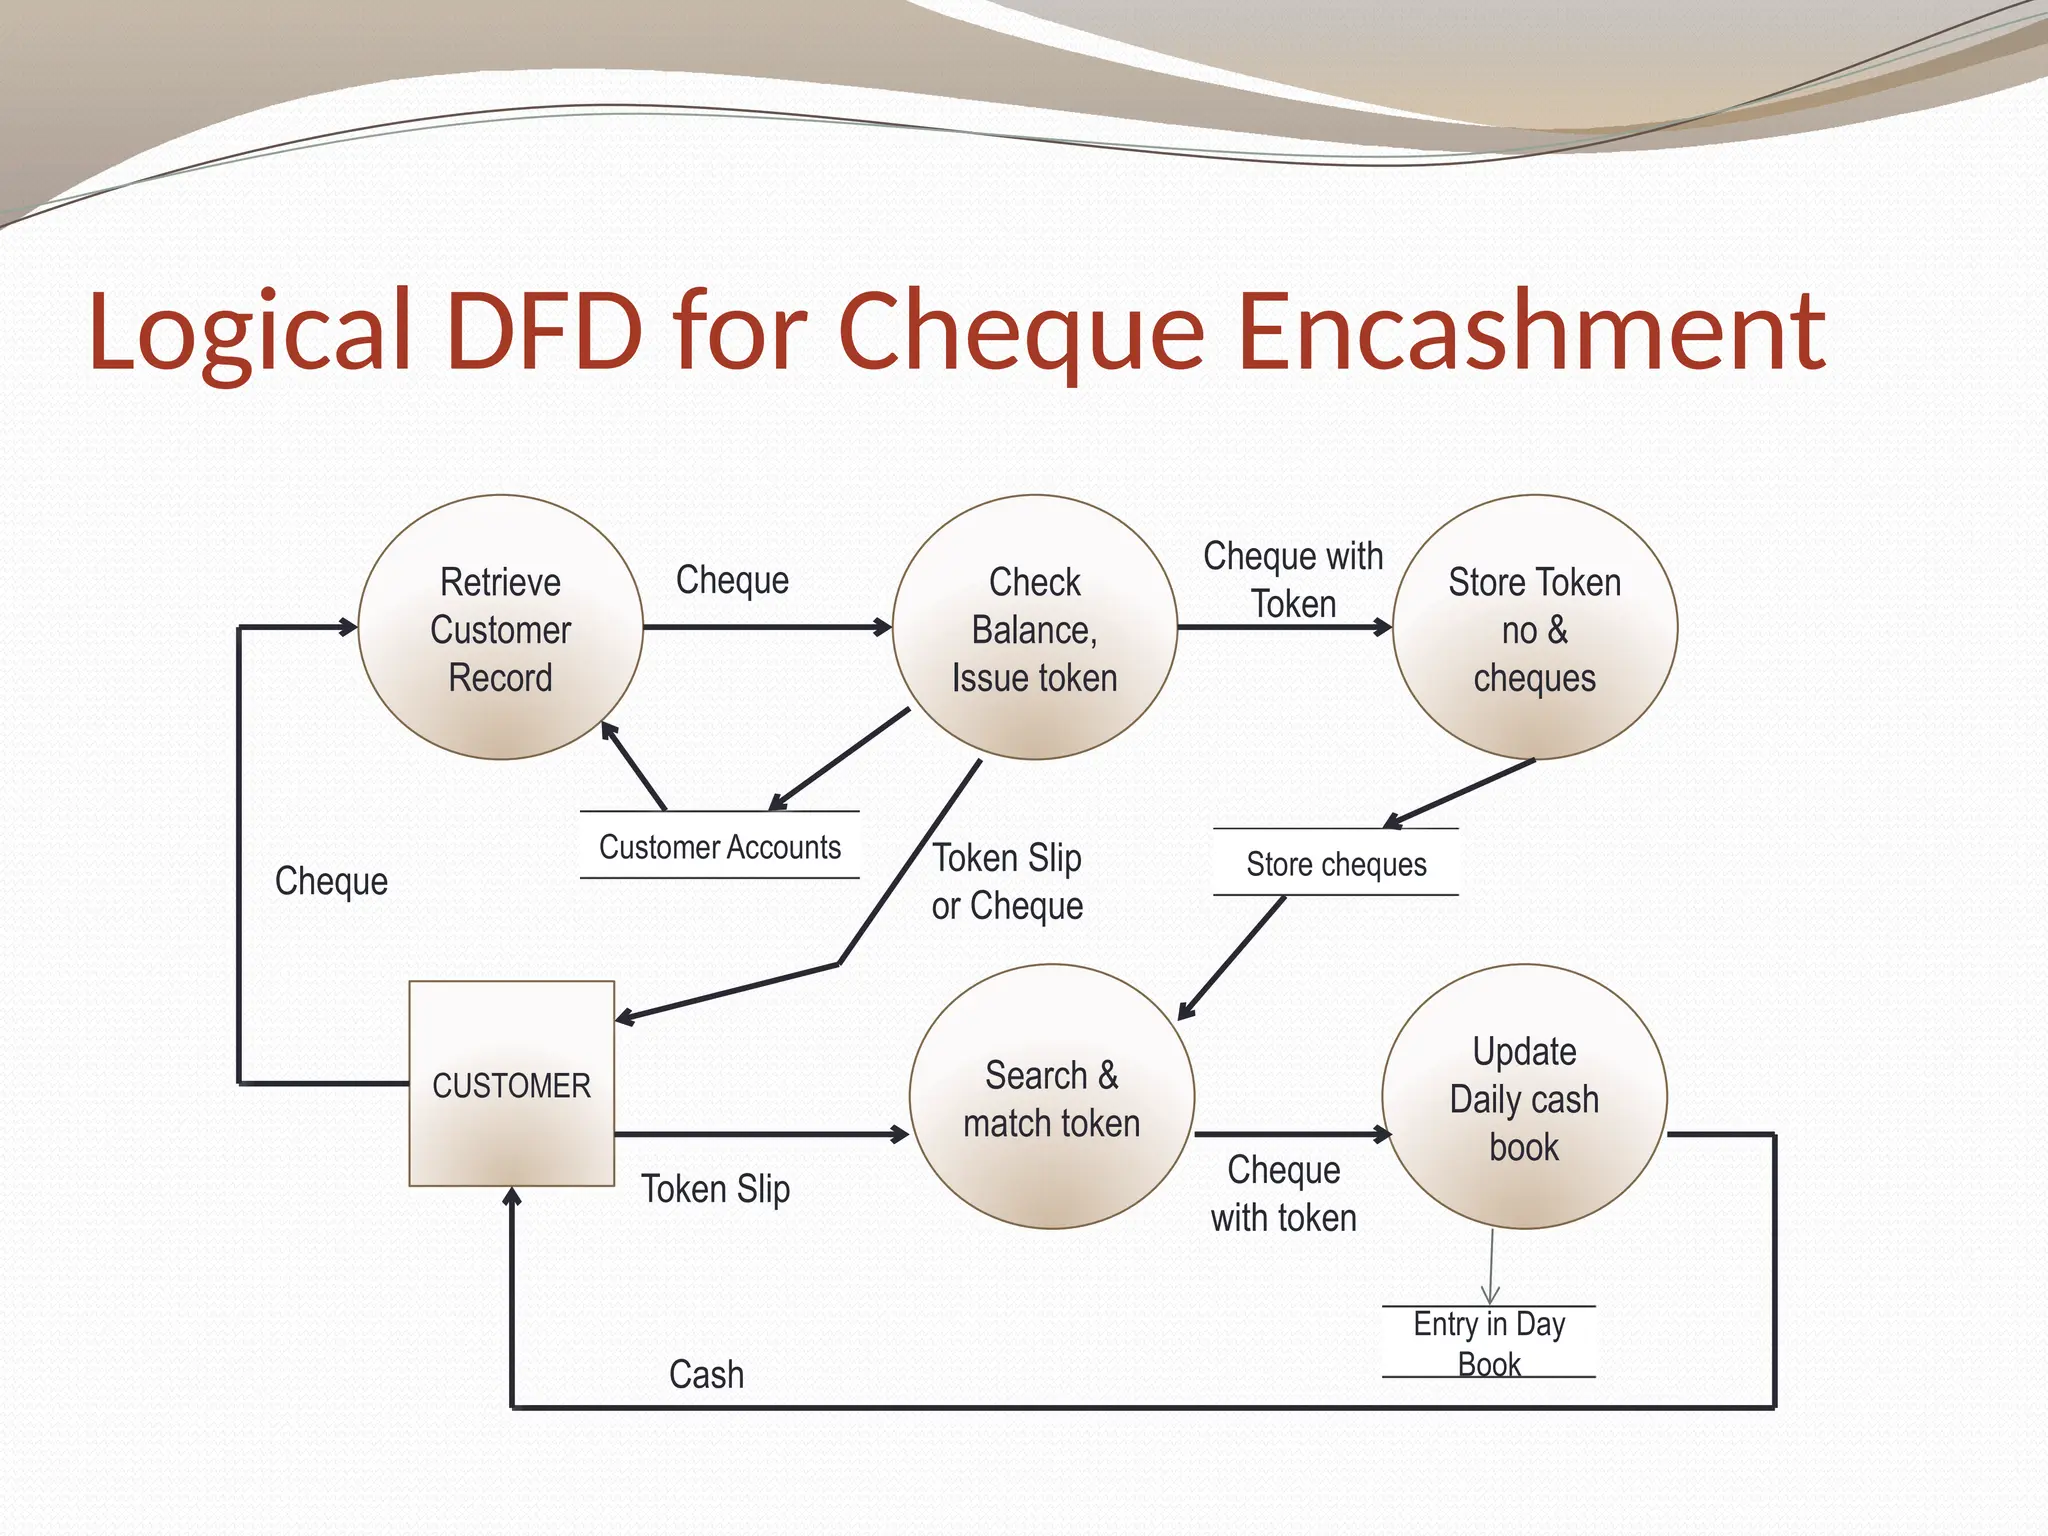
Logical DFD forCheque Encashment
Cash
Retrieve
Customer
Record
Cheque
with token
Store cheques
Customer Accounts
Cheque
Cheque with
Token
Entry in Day
Book
CUSTOMER
Token Slip
Cheque Check
Balance,
Issue token
Store Token
no &
cheques
Search &
match token
Update
Daily cash
book
Token Slip
or Cheque
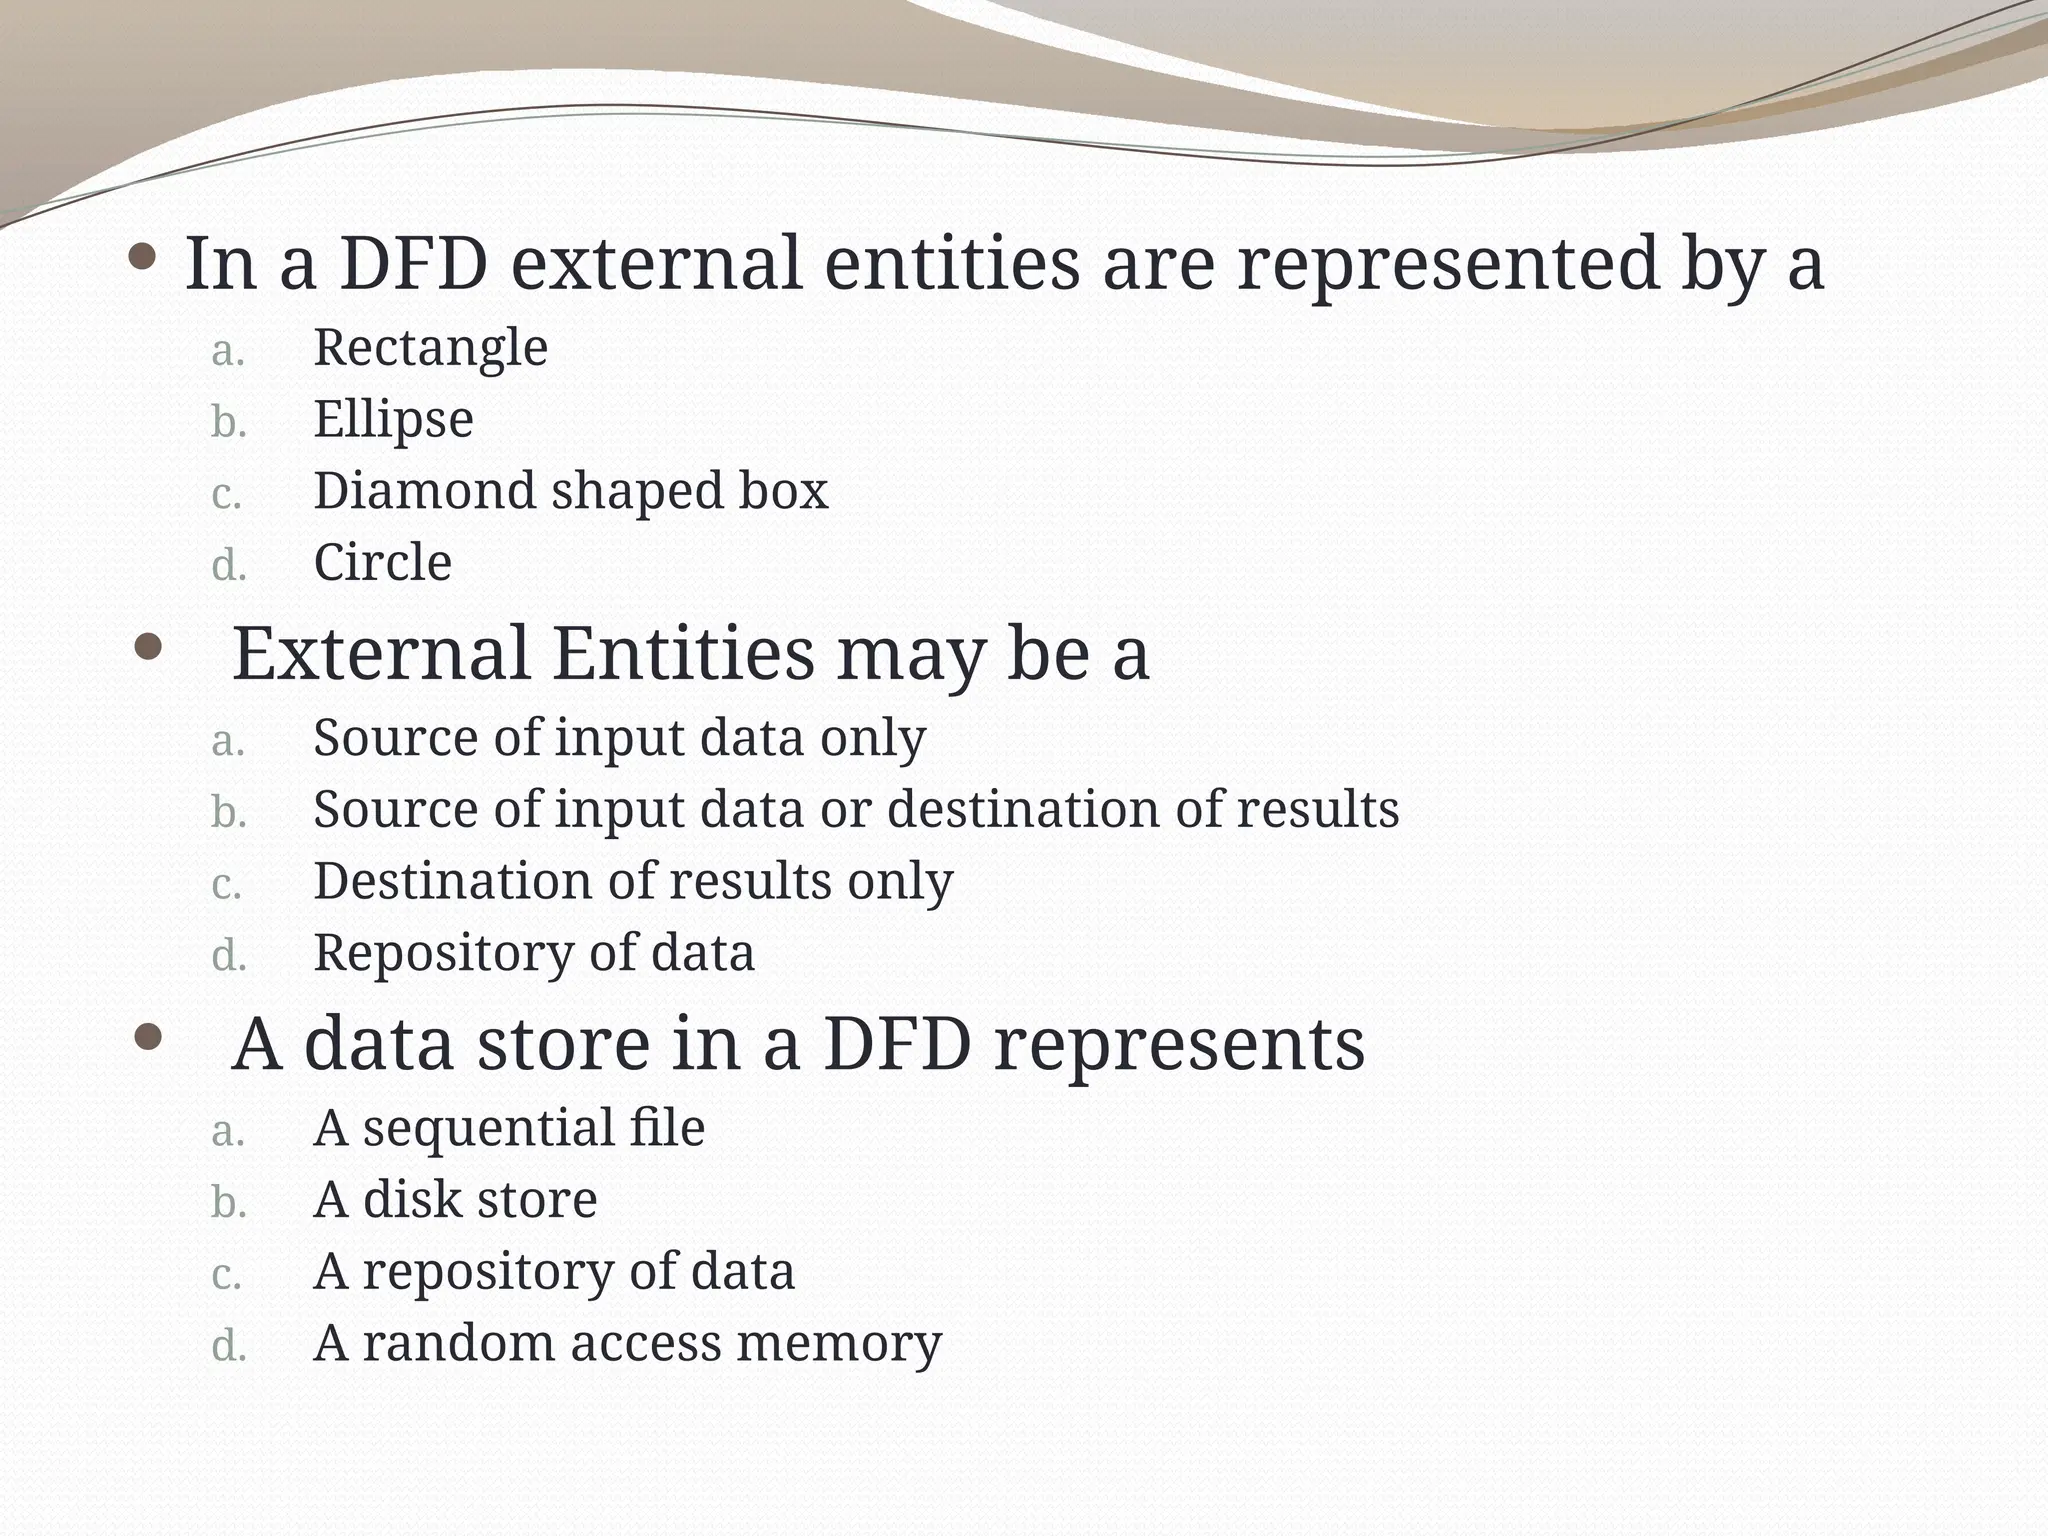
In aDFD external entities are represented by a
a. Rectangle
b. Ellipse
c. Diamond shaped box
d. Circle
External Entities may be a
a. Source of input data only
b. Source of input data or destination of results
c. Destination of results only
d. Repository of data
A data store in a DFD represents
a. A sequential file
b. A disk store
c. A repository of data
d. A random access memory
47.
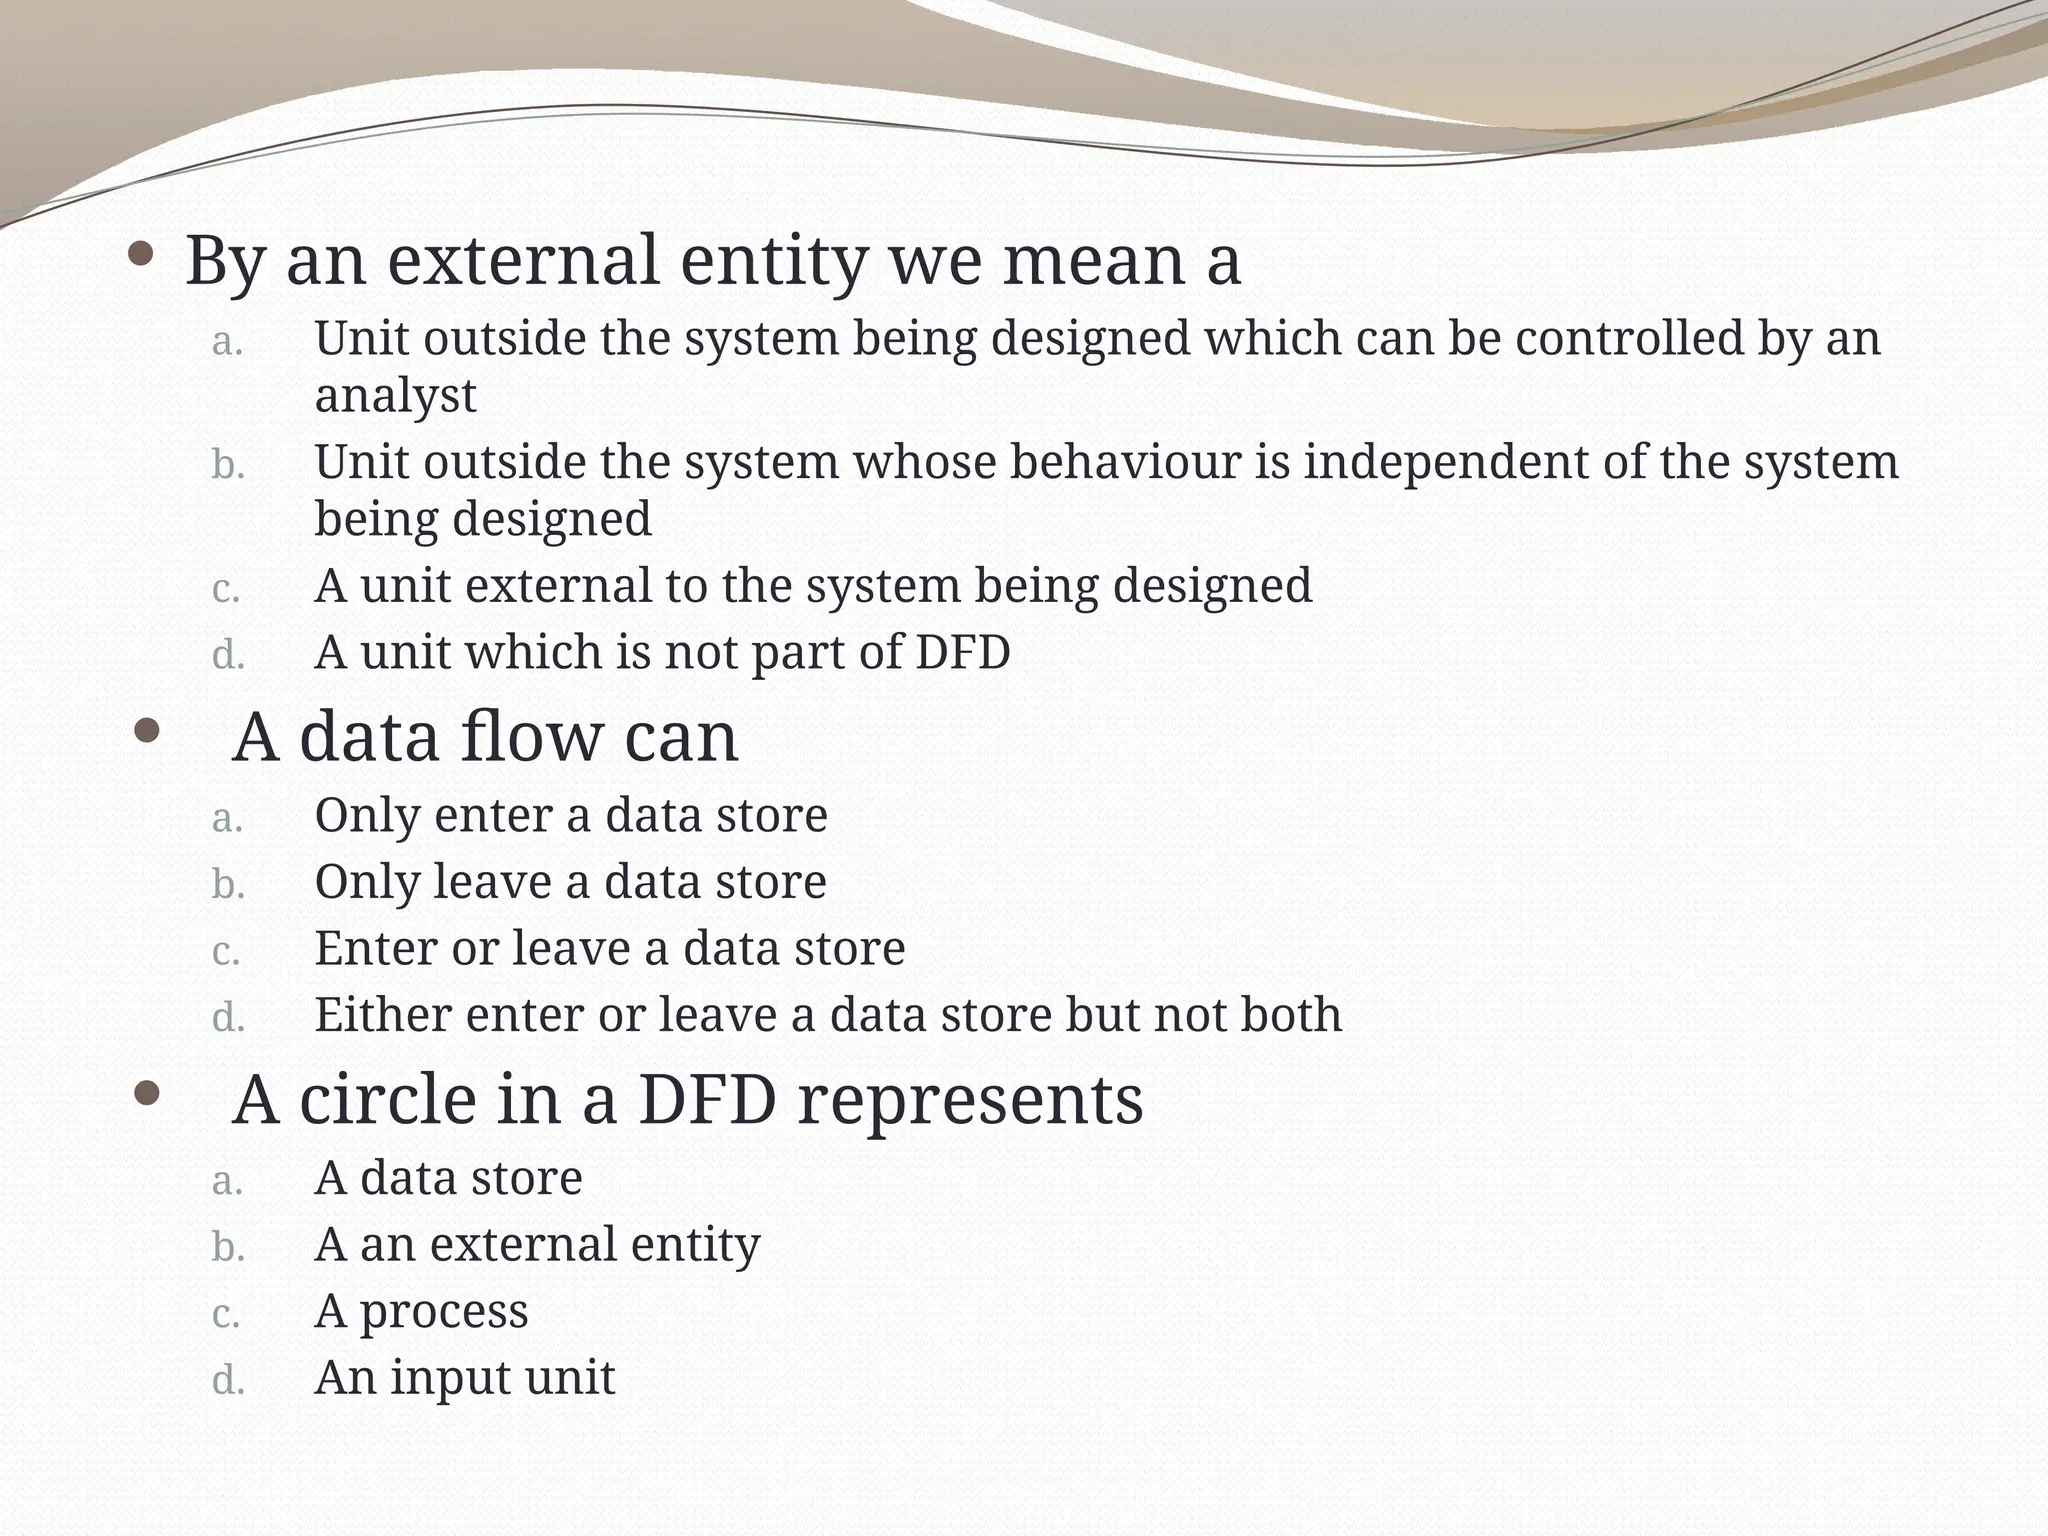
By anexternal entity we mean a
a. Unit outside the system being designed which can be controlled by an
analyst
b. Unit outside the system whose behaviour is independent of the system
being designed
c. A unit external to the system being designed
d. A unit which is not part of DFD
A data flow can
a. Only enter a data store
b. Only leave a data store
c. Enter or leave a data store
d. Either enter or leave a data store but not both
A circle in a DFD represents
a. A data store
b. A an external entity
c. A process
d. An input unit
#11 In DFDs, a process symbol can be referred to as a black box, because the inputs, outputs, and general functions of the process are known, but the underlying details and logic of the process are hidden.
By showing processes as black boxes, an analyst can create DFDs that show how the system functions, but avoid unnecessary detail and clutter.
When the analyst wishes to show additional levels of detail, he or she can zoom in on a process symbol and create a more in-depth DFD that shows the process’s internal workings — which might reveal even more processes, data flows, and data stores.
In this manner, the information system can be modeled as a series of increasingly detailed pictures.
#16 If a DFD is too detailed it will have too many data flows and will be large and difficult to understand
Start from a broad overview. Expand to details – Idea similar to using procedures and linking these with a main program
Each DFD must deal with one aspect of a big system
#25 Three data flow and process combinations that you must avoid:
• Spontaneous generation. The APPLY INSURANCE PREMIUM process, for instance, produces output, but has no input data flow. Because it has no input, the process is called a spontaneous generation process.
• Black hole. The CALCULATE GROSS PAY is called a black hole process, which is a process that has input, but produces no output.
• Gray hole. A gray hole is a process that has at least one input and one output, but the input obviously is insufficient to generate the output shown. For example, a date of birth input is not sufficient to produce a final grade output in the CALCULATE GRADE process.
Spontaneous generation, black holes, and gray holes are impossible logically in a DFD because a process must act on input, shown by an incoming data flow, and produce output, represented by an outgoing data flow.