Download to read offline

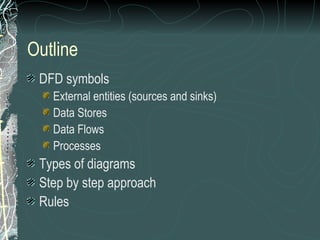
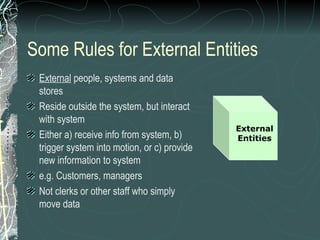
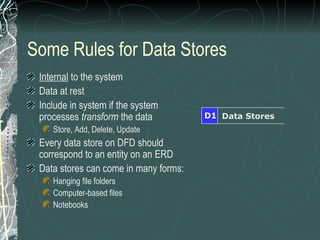
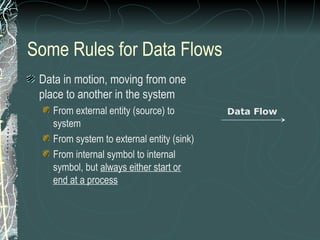
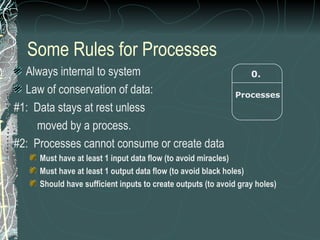
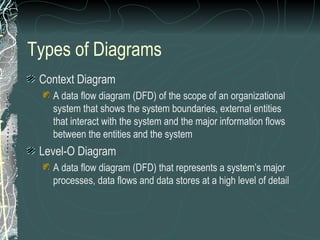


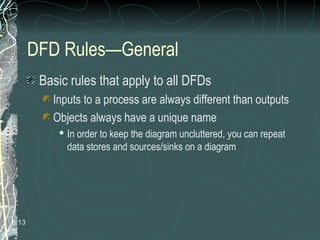
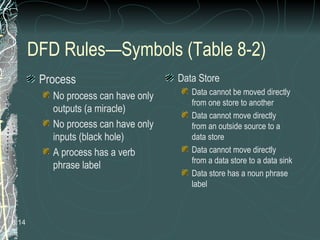
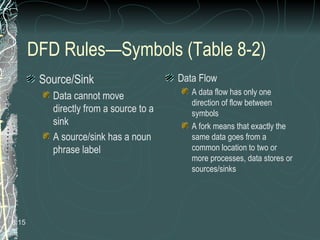
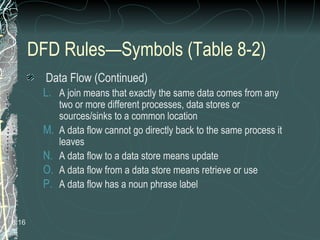
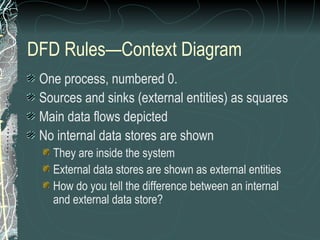


Data flow diagrams (DFDs) are used to represent the flow of data in a system. They consist of symbols including external entities, data stores, processes, and data flows. There are several rules for constructing accurate and useful DFDs: - External entities interact with the system from outside and represent sources or sinks of data, while processes and data stores are internal. - Processes must have at least one input and output, and cannot create or destroy data. Data stores represent data at rest within the system. - Data flows represent data in motion, connecting different symbols, but data cannot flow directly between some symbols like stores and sinks. - DFDs are developed through an iterative process