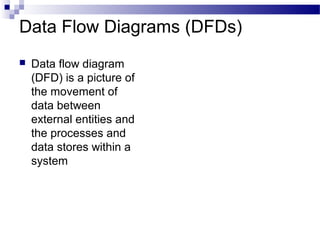
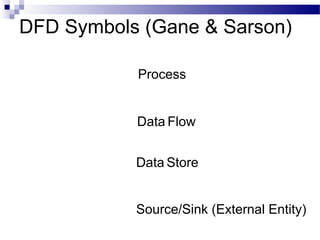
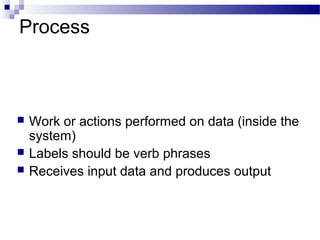
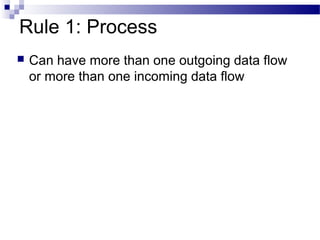
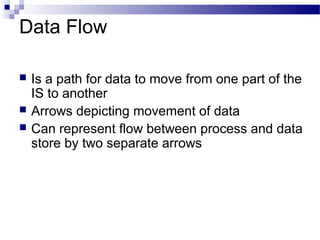
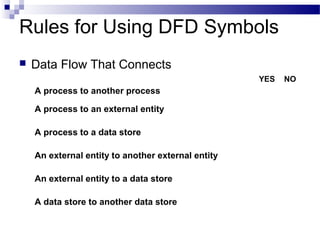
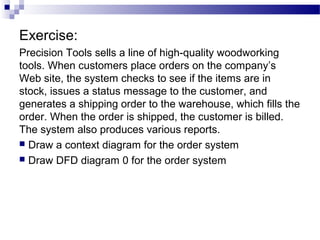
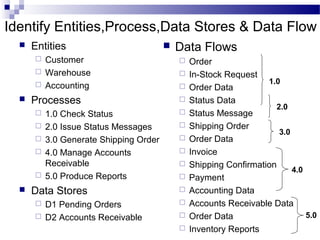
How to :
Data Flow Diagrams
(DFDs)
Data Flow Diagrams (DFDs)
 Data flow diagram
(DFD) is a picture of
the movement of
data between
external entities and
the processes and
data stores within a
system
DFD Symbols (Gane & Sarson)
Process
Data Flow
Data Store
Source/Sink (External Entity)
Process
 Work or actions performed on data (inside the
system)
 Labels should be verb phrases
 Receives input data and produces output
Rule 1: Process
 Can have more than one outgoing data flow
or more than one incoming data flow
Rule 2: Process
 Can connect to any other symbol (including
another process symbol)
Process: Correct/Incorrect?
Data Flow
 Is a path for data to move from one part of the
IS to another
 Arrows depicting movement of data
 Can represent flow between process and data
store by two separate arrows
Data Flow: Correct/Incorrect?
Data Store
 Is used in a DFD to represent data that the
system stores
 Labels should be noun phrases
Rule: Data Store
 Must have at least one incoming and one
outgoing data flow
Data Store: Correct/Incorrect?
Source/Sink (External Entity)
 External entity that is origin or destination of
data (outside the system)
 Is the singular form of a department, outside
organisation, other IS, or person
 Labels should be noun phrases
 Source – Entity that supplies data to the
system
 Sink – Entity that receives data from the
system
Rule: Source/Sink
 Must be connected to a process by a data flow
Source/Sink: Correct/Incorrect?
Rules for Using DFD Symbols
 Data Flow That Connects
YES NO
A process to another process
A process to an external entity
A process to a data store
An external entity to another external entity
An external entity to a data store
A data store to another data store
List the errors of this DFD
Context Diagram
 Top-level view of IS
 Shows the system boundaries, external entities that
interact with the system, and major information flows
between entities and the system.
 Example: Order system that a company uses to
enter orders and apply payments against a
customer’s balance
Context Diagram
of Order System
Level-0 DFD
 Shows the system’s major processes, data flows,
and data stores at a high level of abstraction
 When the Context Diagram is expanded into DFD
level-0, all the connections that flow into and out of
process 0 needs to be retained.
Context Diagram
of Order System
Level-0 DFD of
Order System
Lower-Level Diagrams
 Functional Decomposition
 An iterative process of breaking a system description
down into finer and finer detail
 Uses a series of increasingly detailed DFDs to
describe an IS
 Balancing
 The conservation of inputs and outputs to a data flow
process when that process is decomposed to a lower
level
 Ensures that the input and output data flows of the
parent DFD are maintained on the child DFD
Strategies for Developing DFDs
 Top-down strategy
Create the high-level diagrams (Context
Diagram), then low-level diagrams (Level-0
diagram), and so on
 Bottom-up strategy
Create the low-level diagrams, then higher-
level diagrams
Exercise:
Precision Tools sells a line of high-quality woodworking
tools. When customers place orders on the company’s
Web site, the system checks to see if the items are in
stock, issues a status message to the customer, and
generates a shipping order to the warehouse, which fills the
order. When the order is shipped, the customer is billed.
The system also produces various reports.
 Draw a context diagram for the order system
 Draw DFD diagram 0 for the order system
Identify Entities,Process,Data Stores & Data Flow
 Entities
 Customer
 Warehouse
 Accounting
 Processes
 1.0 Check Status
 2.0 Issue Status Messages
 3.0 Generate Shipping Order
 4.0 Manage Accounts
Receivable
 5.0 Produce Reports
 Data Stores
 D1 Pending Orders
 D2 Accounts Receivable
 Data Flows
 Order
 In-Stock Request
 Order Data
 Status Data
 Status Message
 Shipping Order
 Order Data
 Invoice
 Shipping Confirmation
 Payment
 Accounting Data
 Accounts Receivable Data
 Order Data
 Inventory Reports
1.0
2.0
3.0
4.0
5.0
Context
Diagram of
Order
System
Level-0 of
Order
System

Dfd data flow diagram

  • 1.
    How to : DataFlow Diagrams (DFDs)
  • 2.
    Data Flow Diagrams(DFDs)  Data flow diagram (DFD) is a picture of the movement of data between external entities and the processes and data stores within a system
  • 3.
    DFD Symbols (Gane& Sarson) Process Data Flow Data Store Source/Sink (External Entity)
  • 4.
    Process  Work oractions performed on data (inside the system)  Labels should be verb phrases  Receives input data and produces output
  • 5.
    Rule 1: Process Can have more than one outgoing data flow or more than one incoming data flow
  • 6.
    Rule 2: Process Can connect to any other symbol (including another process symbol)
  • 7.
  • 8.
    Data Flow  Isa path for data to move from one part of the IS to another  Arrows depicting movement of data  Can represent flow between process and data store by two separate arrows
  • 9.
  • 10.
    Data Store  Isused in a DFD to represent data that the system stores  Labels should be noun phrases
  • 11.
    Rule: Data Store Must have at least one incoming and one outgoing data flow
  • 12.
  • 13.
    Source/Sink (External Entity) External entity that is origin or destination of data (outside the system)  Is the singular form of a department, outside organisation, other IS, or person  Labels should be noun phrases  Source – Entity that supplies data to the system  Sink – Entity that receives data from the system
  • 14.
    Rule: Source/Sink  Mustbe connected to a process by a data flow
  • 15.
  • 16.
    Rules for UsingDFD Symbols  Data Flow That Connects YES NO A process to another process A process to an external entity A process to a data store An external entity to another external entity An external entity to a data store A data store to another data store
  • 17.
    List the errorsof this DFD
  • 18.
    Context Diagram  Top-levelview of IS  Shows the system boundaries, external entities that interact with the system, and major information flows between entities and the system.  Example: Order system that a company uses to enter orders and apply payments against a customer’s balance
  • 19.
  • 20.
    Level-0 DFD  Showsthe system’s major processes, data flows, and data stores at a high level of abstraction  When the Context Diagram is expanded into DFD level-0, all the connections that flow into and out of process 0 needs to be retained.
  • 21.
  • 22.
  • 23.
    Lower-Level Diagrams  FunctionalDecomposition  An iterative process of breaking a system description down into finer and finer detail  Uses a series of increasingly detailed DFDs to describe an IS  Balancing  The conservation of inputs and outputs to a data flow process when that process is decomposed to a lower level  Ensures that the input and output data flows of the parent DFD are maintained on the child DFD
  • 24.
    Strategies for DevelopingDFDs  Top-down strategy Create the high-level diagrams (Context Diagram), then low-level diagrams (Level-0 diagram), and so on  Bottom-up strategy Create the low-level diagrams, then higher- level diagrams
  • 25.
    Exercise: Precision Tools sellsa line of high-quality woodworking tools. When customers place orders on the company’s Web site, the system checks to see if the items are in stock, issues a status message to the customer, and generates a shipping order to the warehouse, which fills the order. When the order is shipped, the customer is billed. The system also produces various reports.  Draw a context diagram for the order system  Draw DFD diagram 0 for the order system
  • 26.
    Identify Entities,Process,Data Stores& Data Flow  Entities  Customer  Warehouse  Accounting  Processes  1.0 Check Status  2.0 Issue Status Messages  3.0 Generate Shipping Order  4.0 Manage Accounts Receivable  5.0 Produce Reports  Data Stores  D1 Pending Orders  D2 Accounts Receivable  Data Flows  Order  In-Stock Request  Order Data  Status Data  Status Message  Shipping Order  Order Data  Invoice  Shipping Confirmation  Payment  Accounting Data  Accounts Receivable Data  Order Data  Inventory Reports 1.0 2.0 3.0 4.0 5.0
  • 27.
  • 28.