Downloaded 127 times


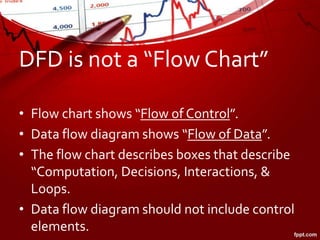

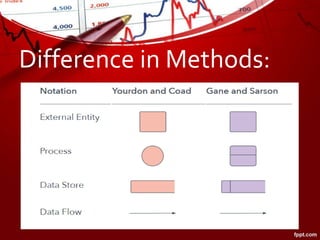
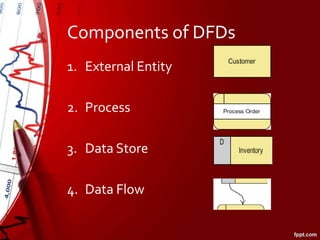

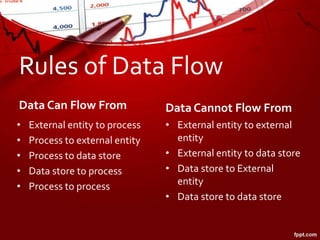


A Data Flow Diagram (DFD) is a graphical representation that illustrates the flow of data in an information system, distinct from flowcharts as it does not include control elements. It has historical significance from the 1970s and is utilized in various applications like software engineering and business analysis, with different types including logical and physical DFDs. DFDs comprise components such as external entities, processes, data stores, and data flows, and while they have advantages in system documentation and communication, they can also be time-consuming to create.


![20260201 [FOSDEM] gomodjail - library sandboxing for Go modules.pdf](https://cdn.slidesharecdn.com/ss_thumbnails/20260201fosdemgomodjail-librarysandboxingforgomodules-260201225659-76609ec4-thumbnail.jpg?width=640&height=640&fit=bounds)


![谷歌留痕技术教程[ 𝙩𝙤𝙥 𝟮𝟯𝟯. 𝙘 𝙤𝙢 ]](https://cdn.slidesharecdn.com/ss_thumbnails/top233-260130173900-2eb784f9-thumbnail.jpg?width=640&height=640&fit=bounds)
