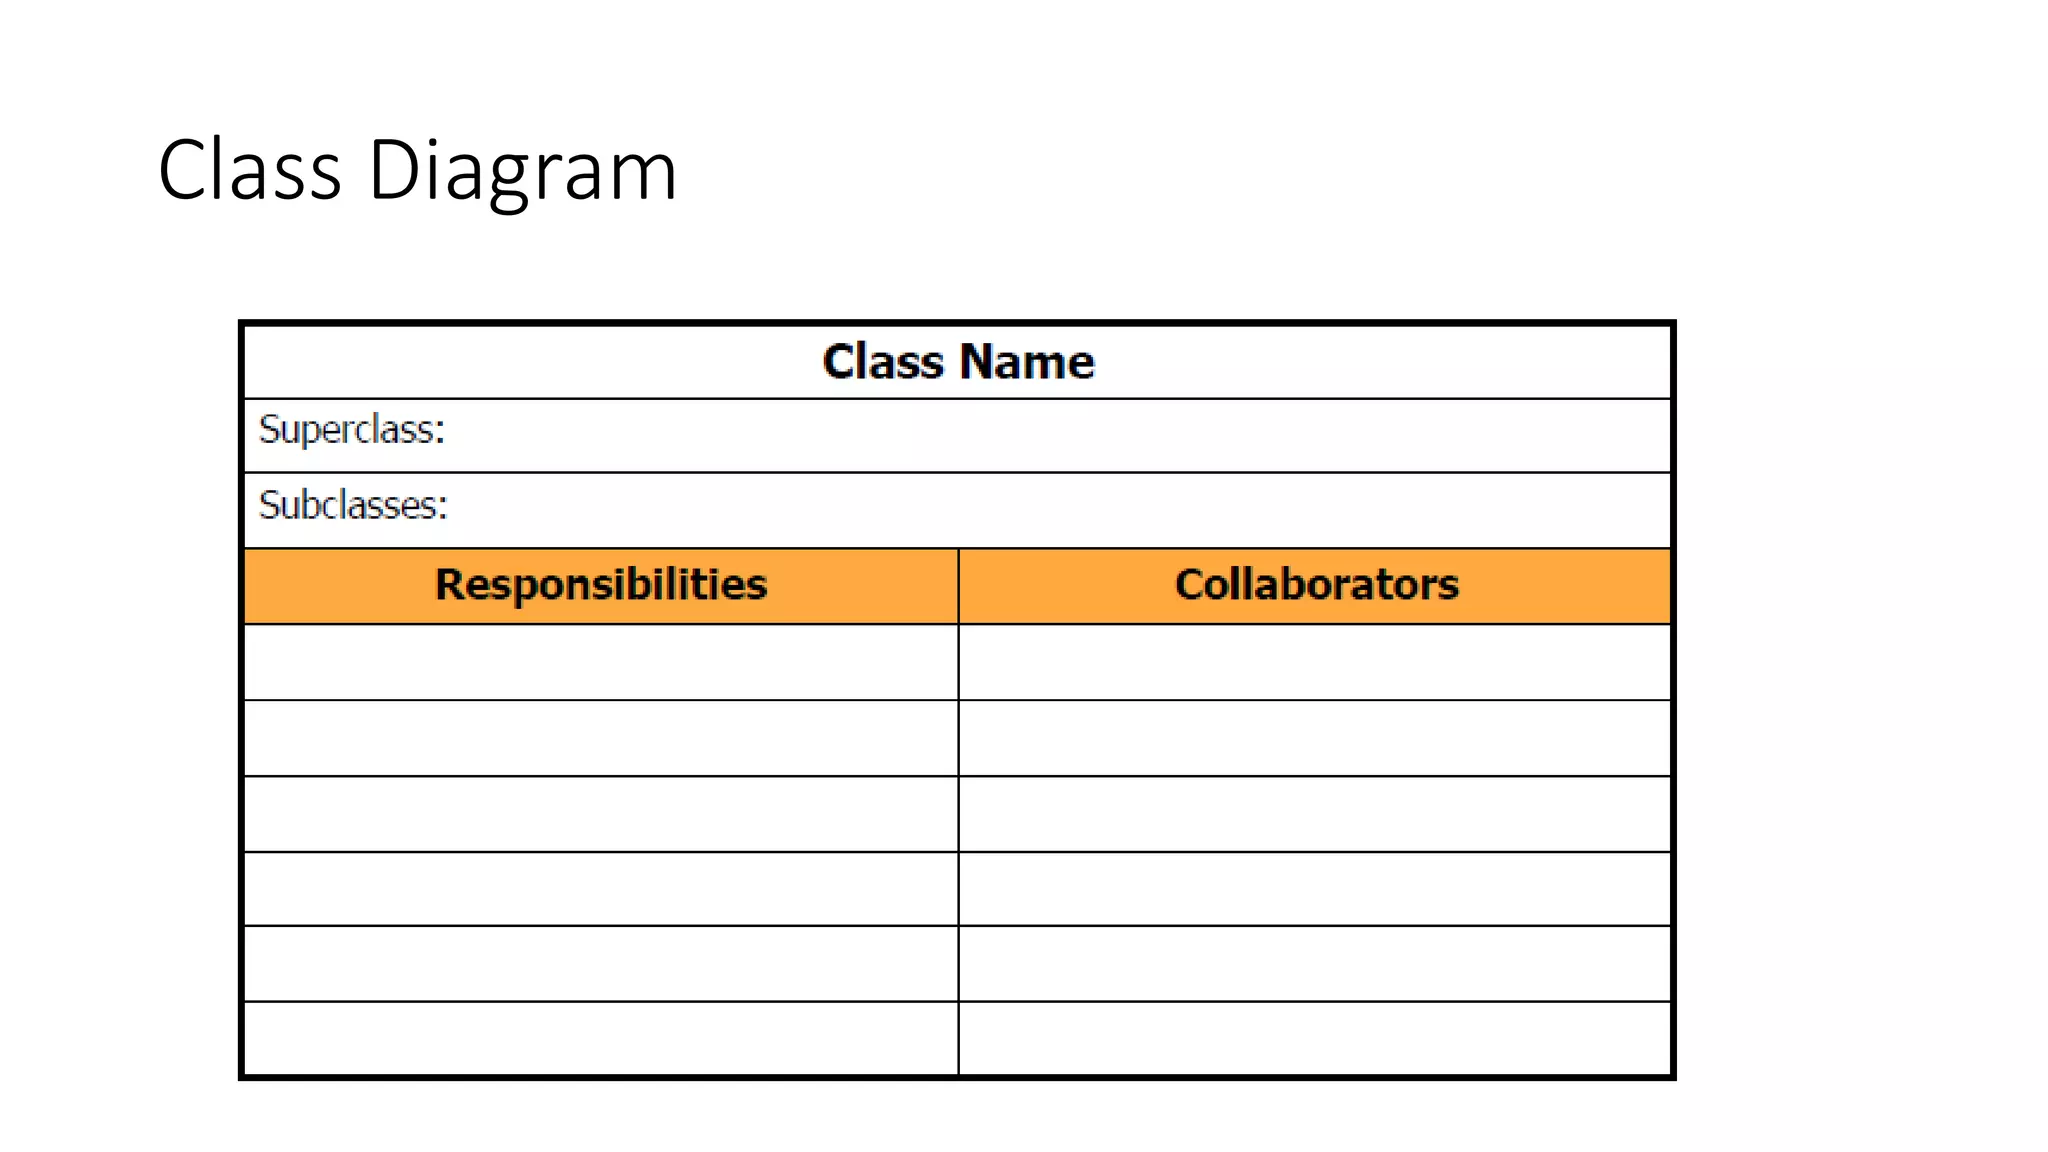
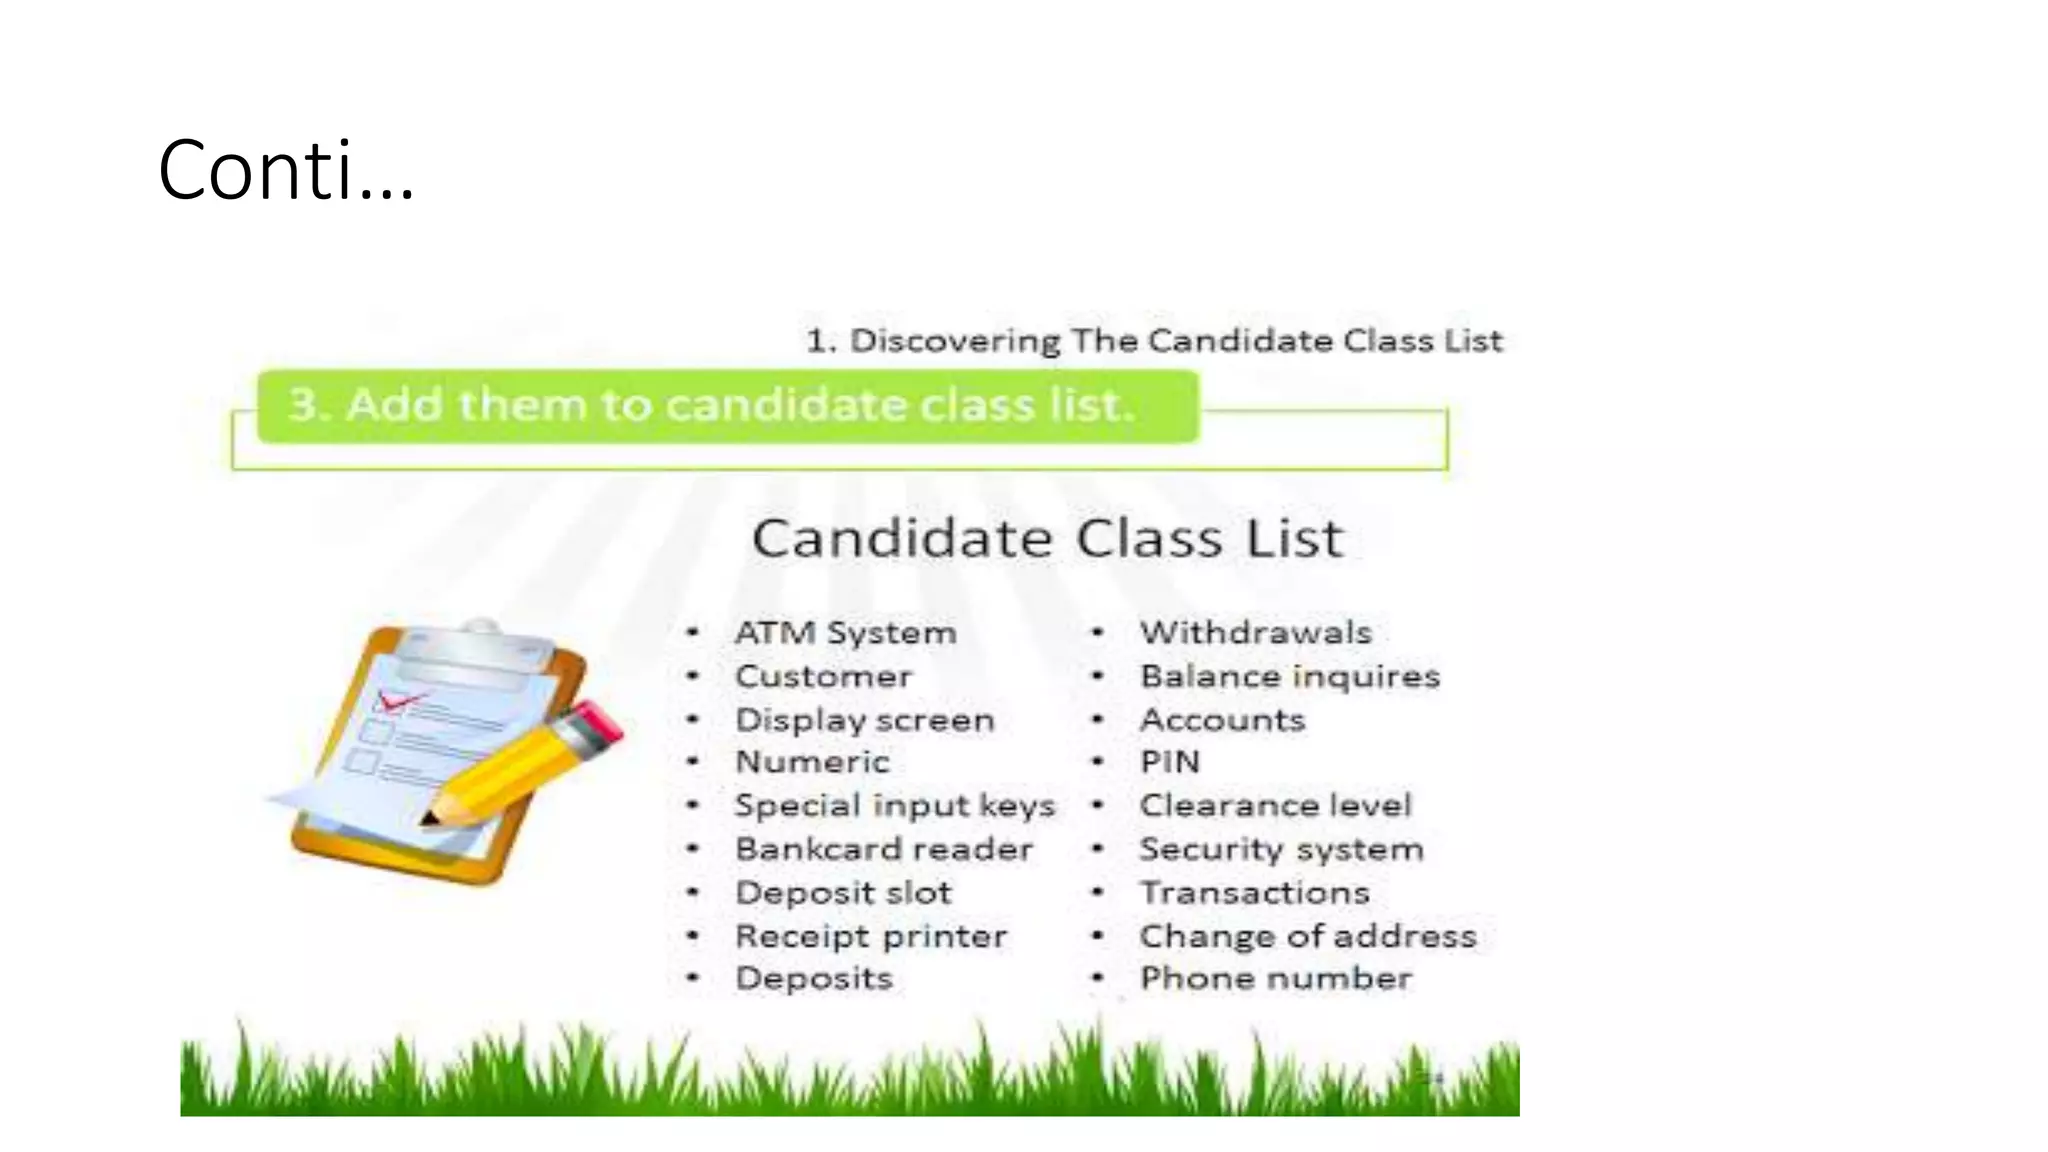
This document discusses data flow diagrams (DFDs) and class-responsibility-collaborator (CRC) modeling. It defines DFDs as graphical representations of data flow in a system. Key components of DFDs are described, including entities, processes, data storage, and data flow. Different levels of DFDs are explained from level 0 (highest abstraction) to lower levels with more detail. CRC modeling is then introduced as a way to identify classes, responsibilities, and collaborators. Classes represent collections of similar objects, responsibilities are things a class knows or does, and collaborators are other classes a given class interacts with.
Data flow Diagram
In this presentation we are going to briefly
Describe what is DFD.
Why Should Use DFD ?
Components of a generic DFD.
Levels of DFD.
DFD with an example (SMS Mela).
the ppt contains the overview about the Data Flow Diagram.it will be the simple powerpoint file and it contains a brief view on elements of the Data Flow Diagram,it also contains the level 0 and level 1 diagrams.
A data flow diagram (DFD) is a graphical representation of the "flow" of data through an information system, modeling its process aspects.
Why DFD technique is so Popular?
Symbols used in DFD
Constructing DFD Models
Data Dictionary
Developing the DFD model of System
Level O DFD or Context Diagram
Level 1 DFD
Strengths of DFD Model
Weaknesses of DFD Model
A graphical tool, useful for communicating with users, managers, and other personnel.
Used to perform structured analysis to determine logical requirements.
Useful for analyzing existing as well as proposed systems.
Focus on the movement of data between external entities and processes, and between processes and data stores.
A relatively simple technique to learn and use.
A data flow diagram (DFD) illustrates how data is processed by a system in terms of inputs and outputs. As its name indicates its focus is on the flow of information, where data comes from, where it goes and how it gets stored.
Legal Issues for Marketing Teams - Part 01 - Muck up the overall impressionVerity White
There are lots of legal and regulatory issues when it comes to advertising and selling goods and services in Australia. Marketing that goes back and forth between marketing, legal, and design several times for approval is wasteful, slow, inefficient and pushes team members to be opposing instead of collaborative
In this eight part series, I will briefly outline key ways that you can ruin your marketing (legally) and also highlight some easy wins you can use to foster positive working relationships between the legal and marketing teams, who often have very different objectives and KPIs.
How business process mapping saved an IT project.Garrett Hunter
How do we help a project in jeopardy of delivering a solution that does not meet customer needs? During this session we will describe how we answered that question by applying business process mapping techniques. The project goal was to automate multiple manual processes that had been developed over time to fulfill marketing orders. The customer had successfully implemented these processes using a collection of desktop spreadsheet and email applications and were asking for help to modernize. We will analyze the initial approach used to gather requirements and how changing to a process centric approach to allowed us to better understand which requirements were missed. We will also review how we incorporated elements of the Business Process Model Notation specification into our overall approach. By using this approach we brought IT and the business together, speaking the same language, and provided a solution that met their needs.
Business process analysis and optimization: A pragmatic approach to business ...Mozammel Hoque
The rapidly changing economic and socio-economic environment has led to think how to keep the business processes continuously optimized in highly uncertain and unexpected markets. This turbulent market situation has been brought two major challenges - Socio-cultural (Behavioral) challenge and Technical challenge (IT). The current industry practice and the academic researchers are trying to get out of this by looking the answer from the technology and business model end: “HOW” to manage the challenges of continuous change concentrating on flexibility and speed, maintainability and scalability, cost. Aftermath of it, there is numerous business process modeling techniques are being proposed by the researchers and the technology industry that well captures both approaches - Quantitative analysis: Objective Approach and Qualitative analysis: Subjective Approach though these approaches have its own drawback. (It is not the purpose of this seminar to enlighten on this drawback.) But, the socio-cultural challenge is ignored though our investigation reveals that Information behavior changes faster than information systems, which has driven us to work on it. Therefore, the aim of this seminar is to demonstrate how socio-cultural factors have significant impact, i.e. WHY IT MATTERS, on the success of business process optimization.
Perencanaan kebutuhan warehouse dibutuhkan untuk mengetahui secara mendetail apa dan bagaimana nantinya Warehouse akan dioperasikan.
Excelogic sebagai konsultan perencanaan warehouse akan membantu perusahaan untuk mendapatkan sebuah solusi "free error" dengan pengalaman di bidang perencanaan warehouse serta jaringan yang dimiliki.
Visit Our Website http://excelogic.info/
Email : admin@excelogic.info
This presentation gives simple but effective techniques for mapping a business process. Process Mapping is a strong initial step in continuous improvement of any business process.
Object oriented analysis_and_design_v2.0Ganapathi M
This is the presentation I have been using to discuss OOAD concepts with the new joiners of the my company. Quick refresher, but will give the paradigm shift for the participants on how OOAD is different in theory & practice.
Palestine last event orientationfvgnh .pptxRaedMohamed3
An EFL lesson about the current events in Palestine. It is intended to be for intermediate students who wish to increase their listening skills through a short lesson in power point.
Introduction to AI for Nonprofits with Tapp NetworkTechSoup
Dive into the world of AI! Experts Jon Hill and Tareq Monaur will guide you through AI's role in enhancing nonprofit websites and basic marketing strategies, making it easy to understand and apply.
The French Revolution, which began in 1789, was a period of radical social and political upheaval in France. It marked the decline of absolute monarchies, the rise of secular and democratic republics, and the eventual rise of Napoleon Bonaparte. This revolutionary period is crucial in understanding the transition from feudalism to modernity in Europe.
For more information, visit-www.vavaclasses.com
A Strategic Approach: GenAI in EducationPeter Windle
Artificial Intelligence (AI) technologies such as Generative AI, Image Generators and Large Language Models have had a dramatic impact on teaching, learning and assessment over the past 18 months. The most immediate threat AI posed was to Academic Integrity with Higher Education Institutes (HEIs) focusing their efforts on combating the use of GenAI in assessment. Guidelines were developed for staff and students, policies put in place too. Innovative educators have forged paths in the use of Generative AI for teaching, learning and assessments leading to pockets of transformation springing up across HEIs, often with little or no top-down guidance, support or direction.
This Gasta posits a strategic approach to integrating AI into HEIs to prepare staff, students and the curriculum for an evolving world and workplace. We will highlight the advantages of working with these technologies beyond the realm of teaching, learning and assessment by considering prompt engineering skills, industry impact, curriculum changes, and the need for staff upskilling. In contrast, not engaging strategically with Generative AI poses risks, including falling behind peers, missed opportunities and failing to ensure our graduates remain employable. The rapid evolution of AI technologies necessitates a proactive and strategic approach if we are to remain relevant.
Read| The latest issue of The Challenger is here! We are thrilled to announce that our school paper has qualified for the NATIONAL SCHOOLS PRESS CONFERENCE (NSPC) 2024. Thank you for your unwavering support and trust. Dive into the stories that made us stand out!
Macroeconomics- Movie Location
This will be used as part of your Personal Professional Portfolio once graded.
Objective:
Prepare a presentation or a paper using research, basic comparative analysis, data organization and application of economic information. You will make an informed assessment of an economic climate outside of the United States to accomplish an entertainment industry objective.
4. We will discuss..
• DFD
• Components of DFD
• Levels of DFD
• Class
• How to identify class and responsibility.
• Subclass
• Superclass
• Object
• Responsibility
• Collaboration
5. Data Flow Diagram
• Data flow diagram is graphical representation of flow of data in an information
system. It is capable of depicting incoming data flow, outgoing data flow and
stored data. The DFD does not mention anything about how data flows through
the system.
• There is a prominent difference between DFD and Flowchart. The flowchart
depicts flow of control in program modules. DFDs depict flow of data in the
system at various levels. DFD does not contain any control.
• Types of DFD
• Data Flow Diagrams are either Logical or Physical.
• Logical DFD - This type of DFD concentrates on the system process, and flow of
data in the system. For example in a Banking software system, how data is moved
between different entities.
• Physical DFD - This type of DFD shows how the data flow is actually implemented
in the system. It is more specific and close to the implementation.
6. DFD Components
• DFD can represent Source, destination, storage and flow of data using
the following set of components.
7. DFD Components
• Entities - Entities are source and destination of information data.
Entities are represented by a rectangles with their respective names.
• Process - Activities and action taken on the data are represented by
Circle or Round-edged rectangles.
• Data Storage - There are two variants of data storage - it can either be
represented as a rectangle with absence of both smaller sides or as
an open-sided rectangle with only one side missing.
• Data Flow - Movement of data is shown by pointed arrows. Data
movement is shown from the base of arrow as its source towards
head of the arrow as destination.
8. Level of DFD
• Level 0 - Highest abstraction level DFD is known as Level 0 DFD, which
depicts the entire information system as one diagram concealing all
the underlying details. Level 0 DFDs are also known as context level
DFDs.
9. Level 1
• The Level 0 DFD is broken down into more specific, Level 1 DFD. Level
1 DFD depicts basic modules in the system and flow of data among
various modules. Level 1 DFD also mentions basic processes and
sources of information.
10. Level 2
• At this level, DFD shows how data flows inside the modules
mentioned in Level 1.
• Higher level DFDs can be transformed into more specific lower level
DFDs with deeper level of understanding unless the desired level of
specification is achieved.
11. Class, Responsibility, and Collaborator(CRC)
• A class represents a collection of similar objects.
• A responsibility is anything that a class knows or does.
• Responsibilities are the attributes and operations that are relevant for
the class.
• A collaborator is another class that is used to get information for, or
performs actions for the class at hand.
• Collaborators are those classes that are required to provide a class
with the information needed to complete a responsibility.
12. CRC Modelling
• A CRC model is really a collection of standard index cards that
represent classes. The cards are divided into three sections. Along the
top of the card you write the name of the class. In the body of the
card you list the class responsibilities on the left and the collaborators
on the right.
14. Classes
• Entity classes, also called model or business classes, are extracted
directly from the statement of the problem.
• Boundary classes are used to create the interface (e.g., interactive
screen or printed reports).
• Controller classes manage a “unit of work” from start to finish.
17. Identify responsibility
• Twice a year the company publishes a catalog of products,
which is mailed to customers and other interested people.
• Customers purchase products by submitting a list of products
with payment to the company. The company fills the order and
ships the products to the customer’s address.
• The order processing software will track the order from the
time it is received until the product is shipped.
• The company will provide quick service. They should be able to
ship a customer’s order by the fastest, most efficient means
possible.
Verb phrases lead to responsibilities..
For Example..
Imagine that you are developing order-processing software for a mail-
order company, a reseller of products purchased from various suppliers.
18. Responsibilities
Publishes a catalog
Is mailed to customers
Purchases products;
submitting
Fills the order
Ships the products; is
shipped
Track the order
Is received
Provides quick service
collaborationsResponsibility
19. Summary
• DFD
• Components of DFD
• LEVELs of DFD
• Class: The blueprint for an object.
• Subclass: A class that inherits from one or more classes.
• Superclass: The class from which another class inherits.
• Object: Something that can do things. An object has state, behavior, and identity.
The structure and behavior of similar objects are defined in their common class.
• Responsibility: Some behavior for which an object is held accountable. A
responsibility denotes the obligation of an object to provide a certain behavior.
• Collaboration: The process whereby several objects cooperate to provide some
higher-level behavior.