
Recommended
More Related Content
What's hot
What's hot (20)
Similar to DFD Guide: Data Flow Diagram and Structure Chart Overview
Similar to DFD Guide: Data Flow Diagram and Structure Chart Overview (20)
More from preetikapri1
More from preetikapri1 (20)
Recently uploaded
Recently uploaded (20)
DFD Guide: Data Flow Diagram and Structure Chart Overview
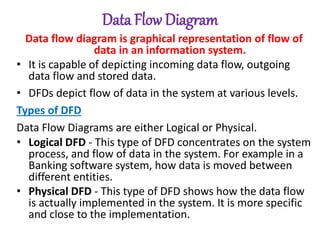
- 1. Data Flow Diagram Data flow diagram is graphical representation of flow of data in an information system. • It is capable of depicting incoming data flow, outgoing data flow and stored data. • DFDs depict flow of data in the system at various levels. Types of DFD Data Flow Diagrams are either Logical or Physical. • Logical DFD - This type of DFD concentrates on the system process, and flow of data in the system. For example in a Banking software system, how data is moved between different entities. • Physical DFD - This type of DFD shows how the data flow is actually implemented in the system. It is more specific and close to the implementation.
- 2. DFD Components DFD can represent Source, destination, storage and flow of data using the following set of components- 1. Entities - Entities are source and destination of information data. Entities are represented by a rectangles with their respective names. 2. Process - Activities and action taken on the data are represented by Circle or Round-edged rectangles. Process
- 3. 3. Data Storage - There are two variants of data storage - it can either be represented as a rectangle with absence of both smaller sides or as an open-sided rectangle with only one side missing. 4. Data Flow - Movement of data is shown by pointed arrows. Data movement is shown from the base of arrow as its source towards head of the arrow as destination.
- 4. Levels of DFD • Level 0 - Highest abstraction level DFD is known as Level 0 DFD, which depicts the entire information system as one diagram concealing all the underlying details. Level 0 DFDs are also known as context level DFDs.
- 5. • Level 1 - The Level 0 DFD is broken down into more specific, Level 1 DFD. Level 1 DFD depicts basic modules in the system and flow of data among various modules. Level 1 DFD also mentions basic processes and sources of information. • Level 2 - At this level, DFD shows how data flows inside the modules mentioned in Level 1.
- 6. Structure Charts Structure chart is a chart derived from Data Flow Diagram. It represents the system in more detail than DFD. • Module - It represents process or subroutine or task. A control module branches to more than one sub-module. Library Modules are re-usable and invoked from any module. • Condition - It is represented by small diamond at the base of module. It depicts that control module can select any of sub- routine based on some condition.
- 7. • Jump - An arrow is shown pointing inside the module to depict that the control will jump in the middle of the sub-module. • Loop - A curved arrow represents loop in the module. All sub- modules covered by loop repeat execution of module.
- 8. • Data flow - A directed arrow with empty circle at the end represents data flow. • Control flow - A directed arrow with filled circle at the end represents control flow.