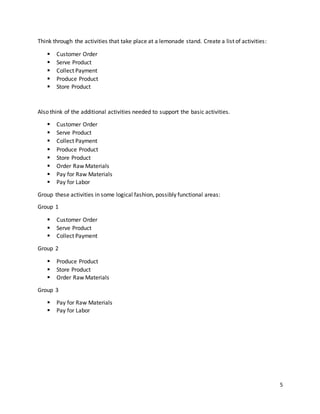
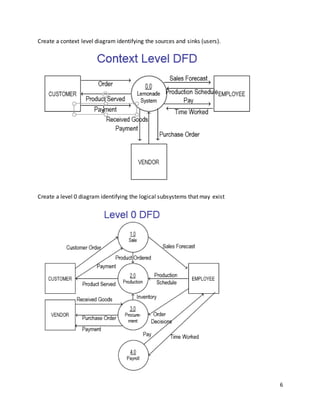
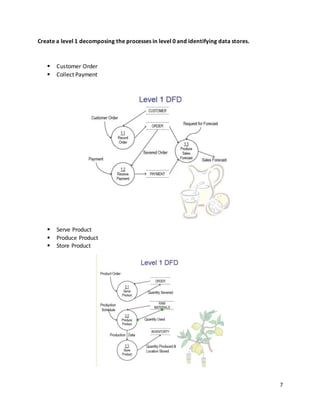
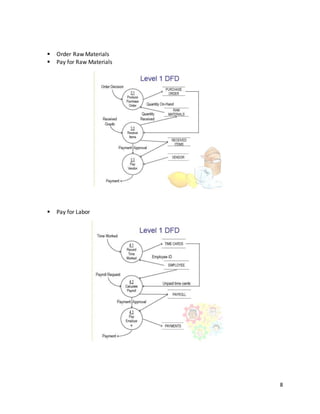
1
SOFTWARE ENGINEERING
DATA FLOW DIAGRAM
Learning outcomes:
 Describe the steps to approach the construction of multi-level DFDs
 Develop context diagrams
 Develop Level 0 DFDs
 Develop Level 1 DFDs
Steps to Construct DFDs:
 Build the context diagram
 Create the level 0 diagram.
 Decompose level 0 processes into level 1 DFDs
 Decompose level 1 processes into level 2 DFDs and decompose further if needed
Creating the context diagram
 Identify ‘user roles’ (external entities)
 Identify the information that each external entity sends to the system and receives from
the system
Creating the level 0 DFD
 Identify the major functions of the system (processes)
 Identify which processes produce the data sent to the external entities and which
processes require the data produced by the external entities
 Identify data flows and data stores and their interaction
 Data flow to data store means ‘update’, data flow from data store means ‘retrieve’
Creating level 1, level 2, etc. DFDs
 Functional decomposition in an iterative process which results in DFDs that give more
details about a process
 The lowest level DFDs are called primitive DFDs
 Describing a process can help to decide whether it is necessary to decompose the
corresponding DFD
 If a process requires to carry out several tasks (logical functions), it is a good candidate
for decomposition
 Ensure the conservation of inputs and outputs (data flows) when decomposing
processes (balancing)
 Ensure completeness, consistency, no timing dependence, iterative development,
creation of primitive DFDs
2
Example No 1
The DFD takes an input-process-output view of a system. That is, data objects flow into the
software, are transformed by processing elements, and resultant data objects flow out of the
software. Data objects are represented by labeled arrows, and transformations are represented
by circles (also called bubbles). The DFD is presented in a hierarchical fashion. That is, the first
data flow model (sometimes called a level 0 DFD or context diagram) represents the systemas a
whole
A level 0 DFD for the security function is shown in Figure. The primary external entities (boxes)
produce information for use by the systemand consume information generated by the system.
The level 0 DFD must now be expanded into a level 1 data flow model. Let us consider the
narrative of the Safehome
During installation, the SafeHome PC is used to program and configure the system. Each sensor
is assigned a number and type, a master password is programmed for arming and disarming the
system, and telephone number(s) are input for dialing when a sensor event occurs.
When asensor event is recognized, the software invokes an audible alarmattached to the system.
After a delay time that is specified by the homeowner during system configuration activities, the
software dials a telephone number of a monitoring service, provides information about the
location, reporting the nature of the event that has been detected. The telephone number will
be redialed every 20 seconds until telephone connection is obtained.
3
The homeowner receives security information via a control panel, the PC, or a browser,
collectively called an interface. The interface displays prompting messages and system status
information on the control panel, the PC, or the browser window.
Level 1 DFD for Safehome
4
Level 2 DFD for Monitor Sensors Process
Example No. 2
Creating Data Flow Diagrams: Lemonade Stand Example
The operations of a simple lemonade stand will be used to demonstrate the creation of
dataflow diagrams. Steps are as follows:
1. Create a list of activities
2. Construct Context Level DFD
(identifies sources and sink)
3. Construct Level 0 DFD
(identifies manageable sub processes )
4. Construct Level 1- n DFD
(identifies actual data flows and data stores )
5
Think through the activities that take place at a lemonade stand. Create a list of activities:
 Customer Order
 Serve Product
 Collect Payment
 Produce Product
 Store Product
Also think of the additional activities needed to support the basic activities.
 Customer Order
 Serve Product
 Collect Payment
 Produce Product
 Store Product
 Order Raw Materials
 Pay for Raw Materials
 Pay for Labor
Group these activities in some logical fashion, possibly functional areas:
Group 1
 Customer Order
 Serve Product
 Collect Payment
Group 2
 Produce Product
 Store Product
 Order Raw Materials
Group 3
 Pay for Raw Materials
 Pay for Labor
6
Create a context level diagram identifying the sources and sinks (users).
Create a level 0 diagram identifying the logical subsystems that may exist
7
Create a level 1 decomposing the processes in level 0 and identifying data stores.
 Customer Order
 Collect Payment
 Serve Product
 Produce Product
 Store Product
8
 Order Raw Materials
 Pay for Raw Materials
 Pay for Labor
9
Example No 3
University Registration System. The system should enable staff of each academic department to
examine the modules offered by their department, add and remove modules, and change the
information about them (e.g. the maximum number of students permitted). It should permit
students to examine currently available modules, add and drop modules to and from their
schedules, and examine the modules for which they are enrolled. Department staff should be
able to print a variety of reports about the modules and the students enrolled in them. The
system should ensure that no student takes too many modules and that students who have any
unpaid fees are not permitted to register (students can verify their fee paying status). Note:
assume that a fees data store is maintained by the university’s financial office and this data store
is accessed by the registration systembut the fees data store is not modified by the registration
system.
Class Task: Draw level 0 and level 1 diagram for the following system
Home Task: Bus Garage Repairs
 Buses come to a garage for repairs.
 A mechanic and helper perform the repair, record the reason for the repair and record
the total cost of all parts used on a Shop Repair Order.
 Information on labor, parts and repair outcome is used for billing by the Accounting
Department, parts monitoring by the inventory management computer systemand a
performance review by the supervisor.

Data flow diagram

  • 1.
    1 SOFTWARE ENGINEERING DATA FLOWDIAGRAM Learning outcomes:  Describe the steps to approach the construction of multi-level DFDs  Develop context diagrams  Develop Level 0 DFDs  Develop Level 1 DFDs Steps to Construct DFDs:  Build the context diagram  Create the level 0 diagram.  Decompose level 0 processes into level 1 DFDs  Decompose level 1 processes into level 2 DFDs and decompose further if needed Creating the context diagram  Identify ‘user roles’ (external entities)  Identify the information that each external entity sends to the system and receives from the system Creating the level 0 DFD  Identify the major functions of the system (processes)  Identify which processes produce the data sent to the external entities and which processes require the data produced by the external entities  Identify data flows and data stores and their interaction  Data flow to data store means ‘update’, data flow from data store means ‘retrieve’ Creating level 1, level 2, etc. DFDs  Functional decomposition in an iterative process which results in DFDs that give more details about a process  The lowest level DFDs are called primitive DFDs  Describing a process can help to decide whether it is necessary to decompose the corresponding DFD  If a process requires to carry out several tasks (logical functions), it is a good candidate for decomposition  Ensure the conservation of inputs and outputs (data flows) when decomposing processes (balancing)  Ensure completeness, consistency, no timing dependence, iterative development, creation of primitive DFDs
  • 2.
    2 Example No 1 TheDFD takes an input-process-output view of a system. That is, data objects flow into the software, are transformed by processing elements, and resultant data objects flow out of the software. Data objects are represented by labeled arrows, and transformations are represented by circles (also called bubbles). The DFD is presented in a hierarchical fashion. That is, the first data flow model (sometimes called a level 0 DFD or context diagram) represents the systemas a whole A level 0 DFD for the security function is shown in Figure. The primary external entities (boxes) produce information for use by the systemand consume information generated by the system. The level 0 DFD must now be expanded into a level 1 data flow model. Let us consider the narrative of the Safehome During installation, the SafeHome PC is used to program and configure the system. Each sensor is assigned a number and type, a master password is programmed for arming and disarming the system, and telephone number(s) are input for dialing when a sensor event occurs. When asensor event is recognized, the software invokes an audible alarmattached to the system. After a delay time that is specified by the homeowner during system configuration activities, the software dials a telephone number of a monitoring service, provides information about the location, reporting the nature of the event that has been detected. The telephone number will be redialed every 20 seconds until telephone connection is obtained.
  • 3.
    3 The homeowner receivessecurity information via a control panel, the PC, or a browser, collectively called an interface. The interface displays prompting messages and system status information on the control panel, the PC, or the browser window. Level 1 DFD for Safehome
  • 4.
    4 Level 2 DFDfor Monitor Sensors Process Example No. 2 Creating Data Flow Diagrams: Lemonade Stand Example The operations of a simple lemonade stand will be used to demonstrate the creation of dataflow diagrams. Steps are as follows: 1. Create a list of activities 2. Construct Context Level DFD (identifies sources and sink) 3. Construct Level 0 DFD (identifies manageable sub processes ) 4. Construct Level 1- n DFD (identifies actual data flows and data stores )
  • 5.
    5 Think through theactivities that take place at a lemonade stand. Create a list of activities:  Customer Order  Serve Product  Collect Payment  Produce Product  Store Product Also think of the additional activities needed to support the basic activities.  Customer Order  Serve Product  Collect Payment  Produce Product  Store Product  Order Raw Materials  Pay for Raw Materials  Pay for Labor Group these activities in some logical fashion, possibly functional areas: Group 1  Customer Order  Serve Product  Collect Payment Group 2  Produce Product  Store Product  Order Raw Materials Group 3  Pay for Raw Materials  Pay for Labor
  • 6.
    6 Create a contextlevel diagram identifying the sources and sinks (users). Create a level 0 diagram identifying the logical subsystems that may exist
  • 7.
    7 Create a level1 decomposing the processes in level 0 and identifying data stores.  Customer Order  Collect Payment  Serve Product  Produce Product  Store Product
  • 8.
    8  Order RawMaterials  Pay for Raw Materials  Pay for Labor
  • 9.
    9 Example No 3 UniversityRegistration System. The system should enable staff of each academic department to examine the modules offered by their department, add and remove modules, and change the information about them (e.g. the maximum number of students permitted). It should permit students to examine currently available modules, add and drop modules to and from their schedules, and examine the modules for which they are enrolled. Department staff should be able to print a variety of reports about the modules and the students enrolled in them. The system should ensure that no student takes too many modules and that students who have any unpaid fees are not permitted to register (students can verify their fee paying status). Note: assume that a fees data store is maintained by the university’s financial office and this data store is accessed by the registration systembut the fees data store is not modified by the registration system. Class Task: Draw level 0 and level 1 diagram for the following system Home Task: Bus Garage Repairs  Buses come to a garage for repairs.  A mechanic and helper perform the repair, record the reason for the repair and record the total cost of all parts used on a Shop Repair Order.  Information on labor, parts and repair outcome is used for billing by the Accounting Department, parts monitoring by the inventory management computer systemand a performance review by the supervisor.