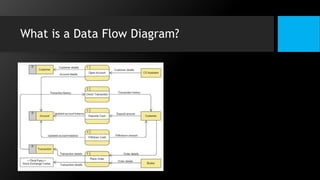
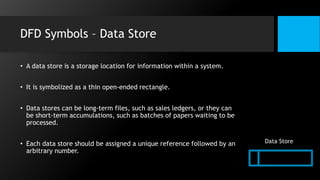
Data flow diagram is used in software development. It shows the flow of data through the system. It has many levels but beyond level 2 complexity increases. It is used in software engineering, Business analysis, agile development & system structures etc. It can provide a detailed representation of a system. Used as a part of system documentation file. It is very easy to understand. It has many advantages but can make the programmers little confuse concerning the system & take long time to create
Connector Corner: Automate dynamic content and events by pushing a buttonDianaGray10
Here is something new! In our next Connector Corner webinar, we will demonstrate how you can use a single workflow to:
Create a campaign using Mailchimp with merge tags/fields
Send an interactive Slack channel message (using buttons)
Have the message received by managers and peers along with a test email for review
But there’s more:
In a second workflow supporting the same use case, you’ll see:
Your campaign sent to target colleagues for approval
If the “Approve” button is clicked, a Jira/Zendesk ticket is created for the marketing design team
But—if the “Reject” button is pushed, colleagues will be alerted via Slack message
Join us to learn more about this new, human-in-the-loop capability, brought to you by Integration Service connectors.
And...
Speakers:
Akshay Agnihotri, Product Manager
Charlie Greenberg, Host
The Art of the Pitch: WordPress Relationships and SalesLaura Byrne
Clients don’t know what they don’t know. What web solutions are right for them? How does WordPress come into the picture? How do you make sure you understand scope and timeline? What do you do if sometime changes?
All these questions and more will be explored as we talk about matching clients’ needs with what your agency offers without pulling teeth or pulling your hair out. Practical tips, and strategies for successful relationship building that leads to closing the deal.
GDG Cloud Southlake #33: Boule & Rebala: Effective AppSec in SDLC using Deplo...James Anderson
Effective Application Security in Software Delivery lifecycle using Deployment Firewall and DBOM
The modern software delivery process (or the CI/CD process) includes many tools, distributed teams, open-source code, and cloud platforms. Constant focus on speed to release software to market, along with the traditional slow and manual security checks has caused gaps in continuous security as an important piece in the software supply chain. Today organizations feel more susceptible to external and internal cyber threats due to the vast attack surface in their applications supply chain and the lack of end-to-end governance and risk management.
The software team must secure its software delivery process to avoid vulnerability and security breaches. This needs to be achieved with existing tool chains and without extensive rework of the delivery processes. This talk will present strategies and techniques for providing visibility into the true risk of the existing vulnerabilities, preventing the introduction of security issues in the software, resolving vulnerabilities in production environments quickly, and capturing the deployment bill of materials (DBOM).
Speakers:
Bob Boule
Robert Boule is a technology enthusiast with PASSION for technology and making things work along with a knack for helping others understand how things work. He comes with around 20 years of solution engineering experience in application security, software continuous delivery, and SaaS platforms. He is known for his dynamic presentations in CI/CD and application security integrated in software delivery lifecycle.
Gopinath Rebala
Gopinath Rebala is the CTO of OpsMx, where he has overall responsibility for the machine learning and data processing architectures for Secure Software Delivery. Gopi also has a strong connection with our customers, leading design and architecture for strategic implementations. Gopi is a frequent speaker and well-known leader in continuous delivery and integrating security into software delivery.
Essentials of Automations: Optimizing FME Workflows with ParametersSafe Software
Are you looking to streamline your workflows and boost your projects’ efficiency? Do you find yourself searching for ways to add flexibility and control over your FME workflows? If so, you’re in the right place.
Join us for an insightful dive into the world of FME parameters, a critical element in optimizing workflow efficiency. This webinar marks the beginning of our three-part “Essentials of Automation” series. This first webinar is designed to equip you with the knowledge and skills to utilize parameters effectively: enhancing the flexibility, maintainability, and user control of your FME projects.
Here’s what you’ll gain:
- Essentials of FME Parameters: Understand the pivotal role of parameters, including Reader/Writer, Transformer, User, and FME Flow categories. Discover how they are the key to unlocking automation and optimization within your workflows.
- Practical Applications in FME Form: Delve into key user parameter types including choice, connections, and file URLs. Allow users to control how a workflow runs, making your workflows more reusable. Learn to import values and deliver the best user experience for your workflows while enhancing accuracy.
- Optimization Strategies in FME Flow: Explore the creation and strategic deployment of parameters in FME Flow, including the use of deployment and geometry parameters, to maximize workflow efficiency.
- Pro Tips for Success: Gain insights on parameterizing connections and leveraging new features like Conditional Visibility for clarity and simplicity.
We’ll wrap up with a glimpse into future webinars, followed by a Q&A session to address your specific questions surrounding this topic.
Don’t miss this opportunity to elevate your FME expertise and drive your projects to new heights of efficiency.
Kubernetes & AI - Beauty and the Beast !?! @KCD Istanbul 2024Tobias Schneck
As AI technology is pushing into IT I was wondering myself, as an “infrastructure container kubernetes guy”, how get this fancy AI technology get managed from an infrastructure operational view? Is it possible to apply our lovely cloud native principals as well? What benefit’s both technologies could bring to each other?
Let me take this questions and provide you a short journey through existing deployment models and use cases for AI software. On practical examples, we discuss what cloud/on-premise strategy we may need for applying it to our own infrastructure to get it to work from an enterprise perspective. I want to give an overview about infrastructure requirements and technologies, what could be beneficial or limiting your AI use cases in an enterprise environment. An interactive Demo will give you some insides, what approaches I got already working for real.
UiPath Test Automation using UiPath Test Suite series, part 4DianaGray10
Welcome to UiPath Test Automation using UiPath Test Suite series part 4. In this session, we will cover Test Manager overview along with SAP heatmap.
The UiPath Test Manager overview with SAP heatmap webinar offers a concise yet comprehensive exploration of the role of a Test Manager within SAP environments, coupled with the utilization of heatmaps for effective testing strategies.
Participants will gain insights into the responsibilities, challenges, and best practices associated with test management in SAP projects. Additionally, the webinar delves into the significance of heatmaps as a visual aid for identifying testing priorities, areas of risk, and resource allocation within SAP landscapes. Through this session, attendees can expect to enhance their understanding of test management principles while learning practical approaches to optimize testing processes in SAP environments using heatmap visualization techniques
What will you get from this session?
1. Insights into SAP testing best practices
2. Heatmap utilization for testing
3. Optimization of testing processes
4. Demo
Topics covered:
Execution from the test manager
Orchestrator execution result
Defect reporting
SAP heatmap example with demo
Speaker:
Deepak Rai, Automation Practice Lead, Boundaryless Group and UiPath MVP
LF Energy Webinar: Electrical Grid Modelling and Simulation Through PowSyBl -...DanBrown980551
Do you want to learn how to model and simulate an electrical network from scratch in under an hour?
Then welcome to this PowSyBl workshop, hosted by Rte, the French Transmission System Operator (TSO)!
During the webinar, you will discover the PowSyBl ecosystem as well as handle and study an electrical network through an interactive Python notebook.
PowSyBl is an open source project hosted by LF Energy, which offers a comprehensive set of features for electrical grid modelling and simulation. Among other advanced features, PowSyBl provides:
- A fully editable and extendable library for grid component modelling;
- Visualization tools to display your network;
- Grid simulation tools, such as power flows, security analyses (with or without remedial actions) and sensitivity analyses;
The framework is mostly written in Java, with a Python binding so that Python developers can access PowSyBl functionalities as well.
What you will learn during the webinar:
- For beginners: discover PowSyBl's functionalities through a quick general presentation and the notebook, without needing any expert coding skills;
- For advanced developers: master the skills to efficiently apply PowSyBl functionalities to your real-world scenarios.
Key Trends Shaping the Future of Infrastructure.pdfCheryl Hung
Keynote at DIGIT West Expo, Glasgow on 29 May 2024.
Cheryl Hung, ochery.com
Sr Director, Infrastructure Ecosystem, Arm.
The key trends across hardware, cloud and open-source; exploring how these areas are likely to mature and develop over the short and long-term, and then considering how organisations can position themselves to adapt and thrive.
Generating a custom Ruby SDK for your web service or Rails API using Smithyg2nightmarescribd
Have you ever wanted a Ruby client API to communicate with your web service? Smithy is a protocol-agnostic language for defining services and SDKs. Smithy Ruby is an implementation of Smithy that generates a Ruby SDK using a Smithy model. In this talk, we will explore Smithy and Smithy Ruby to learn how to generate custom feature-rich SDKs that can communicate with any web service, such as a Rails JSON API.
Transcript: Selling digital books in 2024: Insights from industry leaders - T...BookNet Canada
The publishing industry has been selling digital audiobooks and ebooks for over a decade and has found its groove. What’s changed? What has stayed the same? Where do we go from here? Join a group of leading sales peers from across the industry for a conversation about the lessons learned since the popularization of digital books, best practices, digital book supply chain management, and more.
Link to video recording: https://bnctechforum.ca/sessions/selling-digital-books-in-2024-insights-from-industry-leaders/
Presented by BookNet Canada on May 28, 2024, with support from the Department of Canadian Heritage.
3. What is a Data Flow Diagram?
• A data-flow diagram (DFD) is a graphical depiction of how data moves through
an information system.
• DFDs may also be used to visualize data processing (structured design).
• Data Flow Diagrams are used as a method of expressing a system at any degree
of detail using a visual network of symbols that depicts data flows, data
storage, data processes, and data sources/destinations.
• The goal of data flow diagrams is to serve as a semantic link between users and
system engineers.
4. What is a Data Flow Diagram?
The schematics are as follows:
• Graphical, eliminating thousands of words
• Logical representations, modeling WHAT a system does, rather than physical
models showing HOW it does it
• Hierarchical, showing systems at any level of detail
• Jargon-less, allowing user understanding and reviewing.
5. What is a Data Flow Diagram?
• The purpose of data flow diagramming is to create a model of a system that
everyone can understand.
• The diagrams serve as the foundation for structured systems analysis.
• Other structured systems analysis tools, such as data structure diagrams, data
dictionaries, and procedure-representing approaches such as decision tables,
decision trees, and structured English, supplement data flow diagrams.
7. DFD Symbols – External Entity
• An external entity is a source or destination of a data
flow that is not within the scope of the investigation.
• It represents sources of data to the system or
destinations of data from the system.
• A business process diagram only depicts entities that
generate or receive data.
• A square with a meaningful and unique identity is
utilized as the symbol.
External Entity
8. DFD Symbols – External Entity
• It is customary for all the information represented within a system to have come
from and/or been passed on to an external source or receiver.
• These external entities can be replicated on a diagram to prevent data flow lines
from crossing.
• A stripe is painted across the left-hand corner when they are repeated.
• Adding a lowercase letter to each entity on the diagram is a smart method to
distinguish them.
9. DFD Symbols – Process
• A process demonstrates the translation or manipulation of data flows inside a system.
• The process symbol represents an activity that transforms or manipulates the data.
• The emblem is a rectangular box with three descriptive elements.
• The first thing that displays is an identifying number in the upper left-hand corner.
• This is assigned at the top level randomly and serves as a unique reference.
10. DFD Symbols – Process
• Second, a location displays to the right of the identifier and explains where
the process occurs in the system. This might be a department or a piece of
hardware.
• Finally, a descriptive title is added in the box's center. This should be a
straightforward imperative statement with a specified verb, such as
‘maintain customer records' or 'find driver.'
Process
11. DFD Symbols – Process
• When identifying processes, avoid glossing over them without fully comprehending their
significance.
• The inclusion of ambiguous phrases in the descriptive title box, such as 'process' or 'update,'
is an indication that this has occurred.
• The most important thing to remember is that the description must make sense to the
person who will be utilizing the diagram.
12. DFD Symbols – Process
• Data Flow double headed arrows can be used (to show two-way flows) on all but bottom
level diagrams.
• Furthermore, like most other symbols, a data flow at a certain level of a diagram can be
dissected into several data flows at lower levels.
• Data Storage Facilities each store should be assigned a letter followed by an arbitrary
number.
13. DFD Symbols – Data Flow
• A data flow diagram depicts the movement of information from its
origin to its destination. It represents the movement of data through
the diagram.
• A data flow is depicted as a line with arrowheads indicating the flow
direction.
• Information is always flowing to or from a process and can be written,
spoken, or electronic.
• Each data flow can be identified by the processes or data storage at
its beginning and end, as well as by a description of its contents.
Data Flow
14. DFD Symbols – Data Store
• A data store is a storage location for information within a system.
• It is symbolized as a thin open-ended rectangle.
• Data stores can be long-term files, such as sales ledgers, or they can
be short-term accumulations, such as batches of papers waiting to be
processed.
• Each data store should be assigned a unique reference followed by an
arbitrary number.
Data Store
15. DFD Symbols – Resource Flow
• A resource flow depicts the movement of any physical material from its origin to
its destination.
• As a result, they are sometimes referred to as physical flows.
• A meaningful name should be given to the actual material in issue.
• Resource flows are often limited to early, high-level diagrams and are employed
when a depiction of the actual movement of materials is thought to be
significant to the study.
16. DFD Procedure
The procedure for producing a DFD is as follows:
1. Identify and list external entities that provide inputs to/receive outputs from the system.
2. Identify and list external entity inputs and outputs
3. Draw a context diagram with the system in the middle and other entities transmitting and
receiving data flows
4. Identify the business functions that fall within the scope of the system
5. Discover the data links that exist between business functions
17. DFD Procedure
The procedure for producing a DFD is as follows:
6. Certify receipt of data supplied via personal contact and vice versa
7. Monitor and record what occurs to each data flow that enters the system (data transfer,
data storage, data transformation/processing).
8. Try to link any diagram elements into a preliminary draft
9. Ensure that all data flows have a source and a destination.
10. Ensure that data originating from a data storage is entered
18. DFD Procedure
The procedure for producing a DFD is as follows:
11. Redraw to simplify, ponder and question result
12. Review with "informed“ perspective
13. Repeat above steps as needed
19. DFD - Things to Keep In Mind
Setting system boundaries is a critical decision:
• External entities contribute to establishing the location of the border.
• An interface system can be represented as a separate entity.
• To ensure system control, the external entity's input may need to be dictated.
Customers, for example, may be required to submit purchases or refund requests
including specified information, which may need the use of a system to assist in the
completion of a form.
20. DFD - Things to Keep In Mind
Setting system boundaries is a critical decision:
• The use of output by management, such as reports, may necessitate some consensus
on strategies to be implemented, which may imply that the entity becomes part of
the system rather than external to it.
• When in doubt, incorporate the external entity as a process within the system and
then assess with those involved.
21. DFD - Things to Keep In Mind
Label your procedures precisely and colorfully:
• A procedure with the output "Report" and the label "Produce Report" informs a
reviewer virtually little.
• If you're having problems categorizing anything on the diagram, it's probably because
you don't understand it well enough.
• Choose your names with consideration.
22. DFD - Things to Keep In Mind
Think logically rather than physically:
• Ignore things like medium, color, typeface, layout, packaging, timing, sequencing, and
so on.
• Consider "what" rather than "how."
• Something logical can be physically accomplished in more than one manner.
• Including "when," "where," and "how" indicates that you are getting physical.
23. DFD - Things to Keep In Mind
Consider data flow rather than control flow:
• Data flows are data routes.
• Consider what data is required to complete a procedure or update a data storage.
• A data flow diagram is not a flowchart and should not include loops or control
transfers.
• Consider the data flows, methods, and storage required to move a data structure
through a system.
24. DFD - Things to Keep In Mind
First and foremost, consider what occurs to a "good" transaction:
• Because they are so focused on the branches of the trees, people tend to lose sight of
the forest.
Confusion will not persuade reviewers:
• A good data flow diagram will be so easy to understand that others will wonder what
took you so long.
Data store-to-data-store, external entity-to-external-entity, and external entity-to-data-store
connections are seldom appropriate:
• Data flows with an arrowhead on each end generate labeling confusion.
• They should not be used.
25. DFD - Things to Keep In Mind
Do not try to put everything you know on the DFD:
• The diagram should serve as index and outline.
• The index/outline will be "fleshed out" in the data dictionary, data structure
diagrams, and procedure specification techniques.
27. Problem Solving
• A problem-solving strategy is a plan of action used to solve a problem.
• Different strategies are coupled with various action plans.
• Trial and error, for example, is a well-known approach:
• "If at first you don't succeed, try, try again," as the old saying goes, explains
trial and error.
• In terms of your faulty printer, check the ink levels first, and if that doesn't
work, make sure the paper tray isn't jammed.
• Perhaps the printer isn't linked to your laptop.
• When using trial and error, you would keep trying different solutions until you
found one that worked.
• Although trial and error is not one of the most time-efficient tactics, it is
widely employed.
28. Algorithms for Problem Solving
• An algorithm is a problem-solving method that provides step-by-step instructions for
achieving a desired result.
• Consider an algorithm to be a recipe with highly explicit instructions that results in a
well put together dish
• Every time they are conducted, they provide the same desired result.
29. Algorithms for Problem Solving
• Algorithms are widely employed in our daily lives, particularly in computer science.
• When you conduct an Internet search, search engines such as Google utilize algorithms
to determine which entries will display first in your list of results.
• Facebook also uses algorithms to determine which posts appear on your newsfeed.
31. Characteristics of A Good Algorithm
Characteristics of a good algorithm include:
• Specified Input
• Specified Output
• Definitiveness
• Effectiveness
• Finiteness
32. Specified Input
• Input is data entered to be transformed during computation in order to produce the
output.
• You should consider input as the data needed to begin to get the desired result
• Input precision requires that you know what kind of data, how much and what form
the data should be
33. Specified Output
• The output is data resulting from a completed process
• It is the data resulting from the computation (your intended result)
• An algorithm should have 1 or more well-defined outputs, and should match the
desired output.
• Often, the name of the algorithm gives you an idea of the output. For example,
“Algorithm to compute batting average” lets us know that the output would be the
batting average.
• Output precision requires that you know what kind of data, how much and the form
the output should be in (or even if there will be any output)
34. Definite
• Algorithms must be specific in identifying or specifying every step and the order
the steps should be taken in
• Definiteness of an algorithm means specifying the sequence of operations for
converting input to output
• Details of each step should be specified as well. For example, error handling
35. Effective
• For an algorithm to be effective, the steps required to get the desired output
must be doable.
• For an algorithm to be effective, it means that all those steps that are required
to get to output must be feasible with the available resources.
• It should not contain any unnecessary and redundant steps which could make an
algorithm ineffective.
36. Finite
• The algorithm must eventually come to an end
• Stopping may mean that you get the expected output, or you get a response
indicating that no solution can be achieved
• Finiteness is not usually an issue for non-computer algorithms
• Computer algorithms often repeat instructions with different data and as such
finiteness is a potential issue
37. Other Characteristics of Algorithms
Algorithms should:
• Be general and applicable to several cases
• Use resources efficiently (quick speed and use minimal RAM/Disk space)
• Be understandable so the operations are clear to readers
• Be clear and precise despite the language used:
• Natural languages are ambiguous (words or phrases may have many meanings)
• Programming languages are formal languages with clear, unambiguous rules
39. English-Like Algorithms (Narrative)
• An algorithm can be written in a variety of ways.
• It can be written in basic English, although this style has several disadvantages.
• Natural language can be ambiguous and hence lacks the quality of being definite.
• Each step of an algorithm should be explicit and have only one meaning.
• English-like algorithms are not thought to be suitable for the majority of activities.
43. Pseudocode
• Pseudocode is an informal way of programming description that does not require any strict
programming language syntax or underlying technology.
• Pseudocode has an advantage of being easily converted into any programming language.
• This way of writing algorithm is most acceptable and most widely used.
• In order to write a pseudocode, one must be familiar with the conventions of writing it.
44. Pseudocode – Format
• Single line comments start with //
• Multi-line comments occur between /* and */
• Blocks are represented using brackets. Blocks can be used to represent
compound statements or the procedures:
{ statements }
• Statements are delimited by semicolon.
45. Pseudocode – Format
• Assignment statements indicates that the result of evaluation of the expression
will be stored in the variable.
< variable > = < expression >
• The boolean expression 'x > y' returns true if x is greater than y, else returns false.
• The boolean expression 'x < y' returns true if x is less than y, else returns false.
• The boolean expression 'x <= y' returns true if x is less than or equal to y, else
returns false.
46. Pseudocode – Format
• The boolean expression 'x >= y' returns true if x is greater than or equal to y, else returns false.
• The boolean expression 'x != y' returns true if x is not equal to y, else returns false.
• The boolean expression 'x == y' returns true if x is equal to y, else returns false.
• The boolean expression 'x AND y' returns true if both conditions are true, else returns false.
• The boolean expression 'x OR y' returns true if any of the conditions is true, else returns false.
• The boolean expression 'NOT y' returns true if the result of x evaluates to false, else returns false.
47. Pseudocode – Format
• if< condition >then< statement >
• This condition is an enhancement of the above 'if' statement. It can also handle the case
where the condition isn't satisfied.
if< condition >then< statement1 >else< statement2 >
48. Pseudocode – Format
• switch case (C or C++)
case { :< condition 1 >: < statement 1 > ..... ..... ..... :< condition n >: <
statement n > :default: < statement n+1 > }
• while loop
while< condition >do { statements }
• do-while loop
repeat statements until< condition >
49. Pseudocode – Format
• for loop
for variable = value1 to value2 { statements }
• input instruction
Read
• Output instruction
Print
50. Pseudocode – Format
• The name of the algorithm is < name > and the arguments are stored in the < parameter list >
Algorithm< name > (< parameter list >)