This document provides an overview of capnography including:
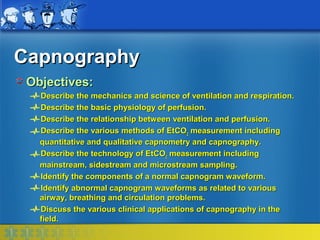
1) The objectives of describing ventilation, perfusion, and their relationship as assessed by capnography.
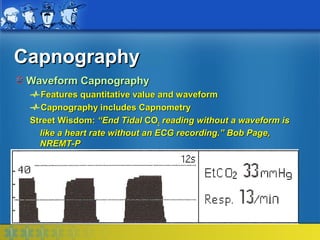
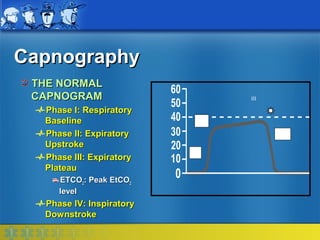
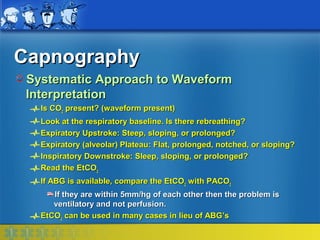
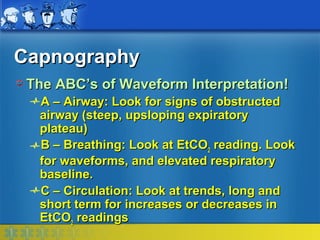
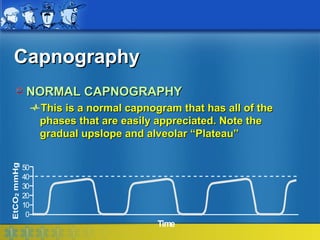
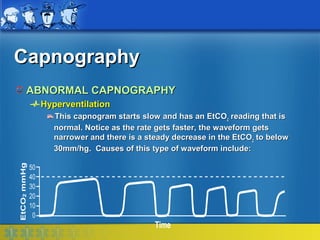
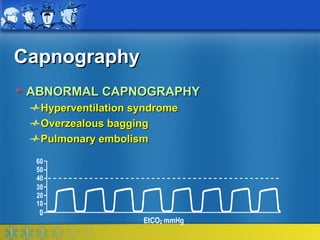
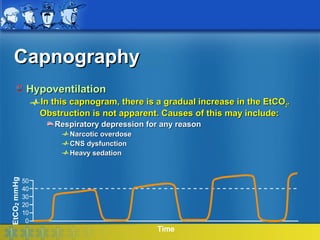
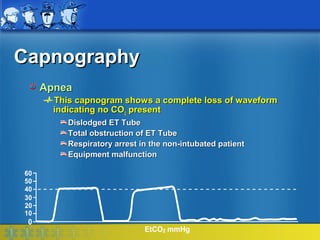
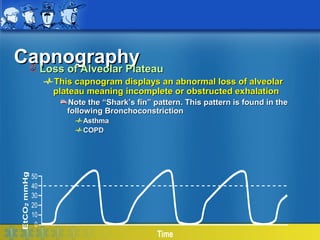
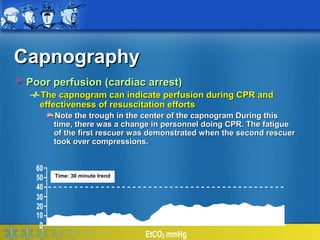
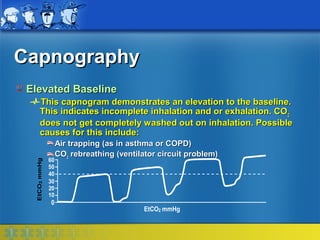
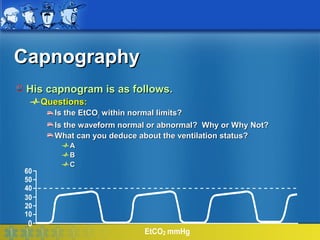
2) A description of the normal capnogram waveform and factors that can cause abnormal waveforms related to airway, breathing, and circulation problems.
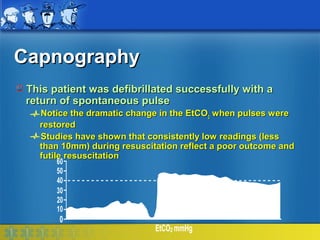
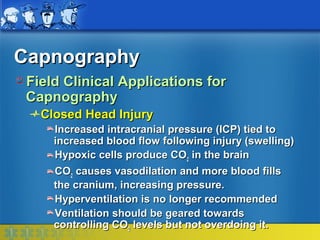
3) Clinical applications of capnography including confirming endotracheal tube placement, assessing ventilation status, and predicting outcomes of cardiac arrest resuscitation.