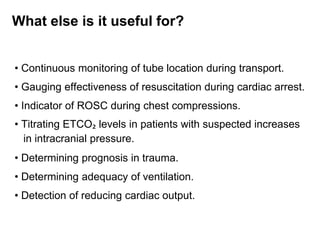
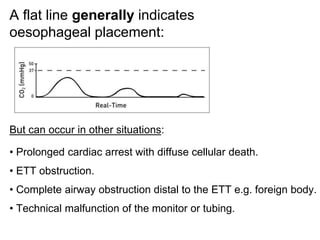
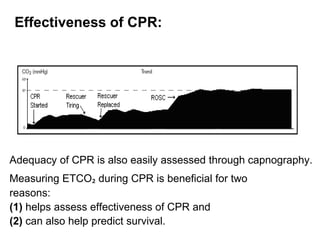
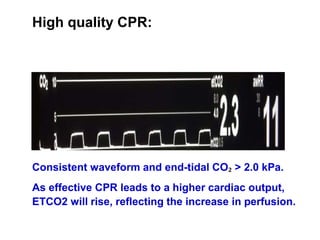
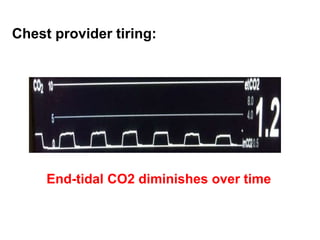
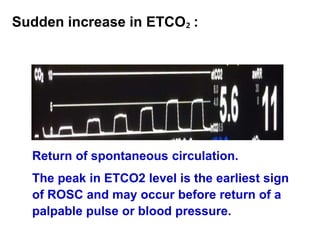
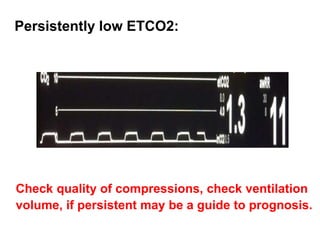
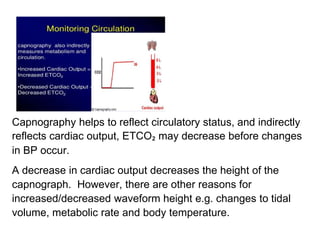
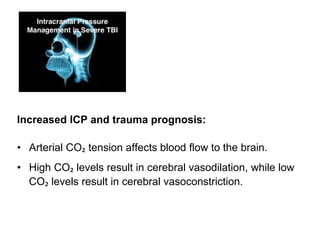
2. Introduction:
• The term capnography refers to the noninvasive
measurement of the partial pressure of carbon dioxide
(CO2) in an exhaled breath expressed as the CO2
concentration over time.
• Changes in the shape of the capnogram are diagnostic
of disease conditions, while changes in end-tidal CO2
(EtCO2), the maximum concentration at the end of each
tidal breath, can be used to assess disease severity and
response to treatment.
3. Why use capnography?
• Capnography is the most reliable indicator that an
endotracheal tube is placed in the trachea after intubation.
• Oxygenation and ventilation are distinct physiologic
functions that must be assessed in both intubated and
spontaneously breathing patients.
• Pulse oximetry provides nearly instantaneous feedback
about oxygenation.
• Capnography provides instantaneous information about
ventilation – how effectively CO₂ is transported through
the vascular system and metabolism – how effectively
CO₂ is being produced by cellular metabolism.
4. Principles:
• Carbon dioxide is produced in the tissues.
• Transported from tissues in blood to the lungs.
• Ventilation excretes CO₂ through the lungs.
• Beam of infrared light passes through CO₂ in
Sensor
• High CO₂ levels absorb more light
5. Measurement of ETCO₂ therefore
requires:
• Venous return – CO₂ from tissues to heart.
• Pulmonary blood flow – CO₂ from heart to lungs.
• Ventilation – effective movement of gas in and out of the
lungs.
6. Types of ETCO₂ Analyser
• Mainstream
– Placed in line with
circuit
– Rapid response
time
– Bulky and heavy
– Heated to 39’C to
avoid vapour
– No loss of gas
• Side stream
– Tube directs gas
from circuit to
analyser
– Slower response
– Lightweight
– Requires HMEF
to prevent
condensation
– Sampled gas is
lost
7. Normal capnogram:
4 phases:
Phase 1 – dead space ventilation
A-B represents start of exhalation.
Phase 2 – ascending phase B-C
represents the rapid rise in CO₂
concentration as the CO₂ from the
alveoli reaches the upper airway.
Phase 3 – alveolar plateau C-D
represents the CO₂ conc. reaching
a uniform level in the entire breath
stream from alveolus to nose.
Phase 4 – D-E represents the
inspiratory cycle.
8.
9. What else is it useful for?
• Continuous monitoring of tube location during transport.
• Gauging effectiveness of resuscitation during cardiac arrest.
• Indicator of ROSC during chest compressions.
• Titrating ETCO₂ levels in patients with suspected increases
in intracranial pressure.
• Determining prognosis in trauma.
• Determining adequacy of ventilation.
• Detection of reducing cardiac output.
10. A flat line generally indicates
oesophageal placement:
But can occur in other situations:
• Prolonged cardiac arrest with diffuse cellular death.
• ETT obstruction.
• Complete airway obstruction distal to the ETT e.g. foreign body.
• Technical malfunction of the monitor or tubing.
11. Effectiveness of CPR:
Adequacy of CPR is also easily assessed through capnography.
Measuring ETCO₂ during CPR is beneficial for two
reasons:
(1) helps assess effectiveness of CPR and
(2) can also help predict survival.
12. High quality CPR:
Consistent waveform and end-tidal CO₂ > 2.0 kPa.
As effective CPR leads to a higher cardiac output,
ETCO2 will rise, reflecting the increase in perfusion.
14. Sudden increase in ETCO₂ :
Return of spontaneous circulation.
The peak in ETCO2 level is the earliest sign
of ROSC and may occur before return of a
palpable pulse or blood pressure.
15. Persistently low ETCO2:
Check quality of compressions, check ventilation
volume, if persistent may be a guide to prognosis.
16. Capnography helps to reflect circulatory status, and indirectly
reflects cardiac output, ETCO₂ may decrease before changes
in BP occur.
A decrease in cardiac output decreases the height of the
capnograph. However, there are other reasons for
increased/decreased waveform height e.g. changes to tidal
volume, metabolic rate and body temperature.
17. Increased ICP and trauma prognosis:
• Arterial CO₂ tension affects blood flow to the brain.
• High CO₂ levels result in cerebral vasodilation, while low
CO₂ levels result in cerebral vasoconstriction.
18. • Sustained hypoventilation defined as PaCO₂ levels
≥ 6.6kPa results in increased cerebral blood flow and
increased ICP, which can harm brain-injured patients.
• Sustained hyperventilation – defined as PaCO₂ levels
≤ 4.0kPa is also detrimental and is associated with worse
neurologic outcome in severely brain-injured patients.
• Consequently, ventilation rates to achieve eucapnia are
recommended.
Increased ICP and trauma prognosis:
19. Increasing ETCO2 level:
Possible causes:
Decrease in respiratory rate, decrease in tidal
volume, increase in metabolic rate, rapid rise in
body temperature.
21. Rebreathing – elevation of the baseline
indicates rebreathing and may show
increase in ETCO2:
Possible causes:
Insufficient expiratory time, faulty expiratory valve on
ventilator, inadequate inspiratory flow.
22. Loss of alveolar plateau:
This capnogram displays an abnormal loss of alveolar
plateau meaning incomplete or obstructed exhalation.
Note the “Shark’s fin” pattern. Evaluation of asthma
treatment is another use for ETCO2.
Analysing the waveform after bronchodilator therapy has been
administered helps evaluate treatment effectiveness.
23. Obstruction in breathing circuit
or airway:
Possible causes:
Obstruction in the expiratory limb of the breathing circuit,
presence of foreign body in the upper airway, partially kinked
or occluded artificial airway, bronchospasm.
Change in slope of
the ascending limb
of the capnogram
24. Muscle relaxants:
Characteristics:
Depth of the cleft is inversely proportional to the degree
of drug activity, position is fairly constant on the same
patient but not necessarily present with every breath.
Curare clefts appear
when the action of
the muscle relaxants
begin to subside
and spontaneous
ventilation returns.
25. Either no CO2 is sensed or only small transient
waveforms are present.