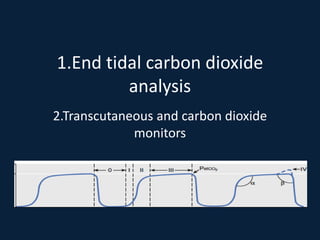
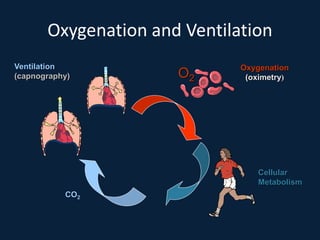
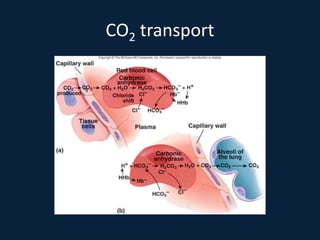
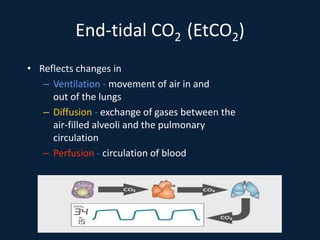
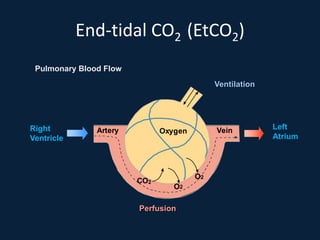
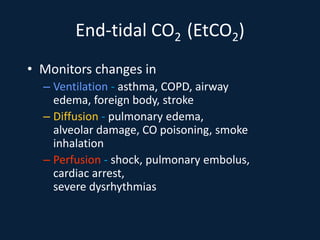
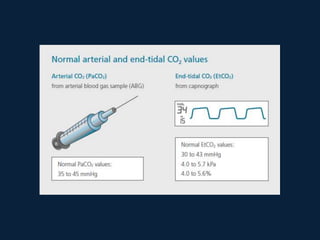
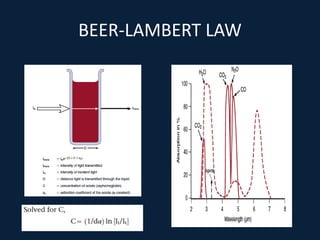
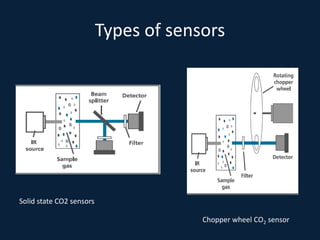
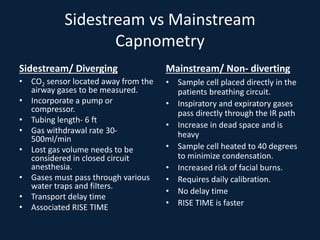
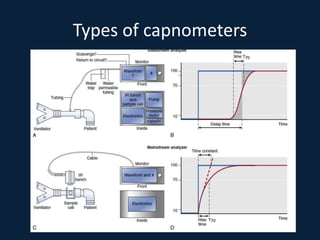
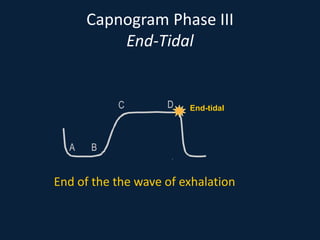
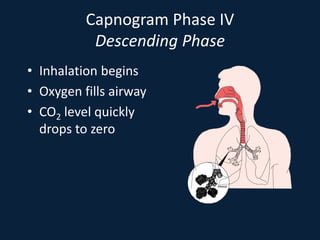
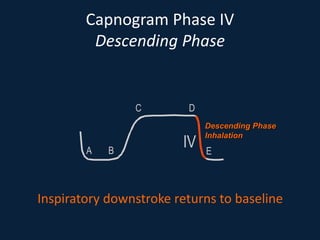
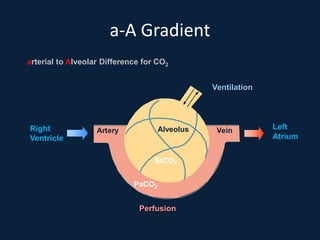
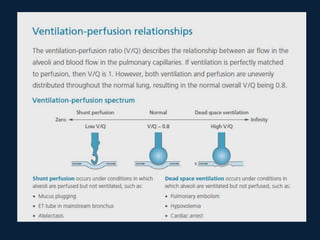
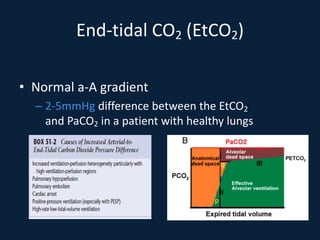
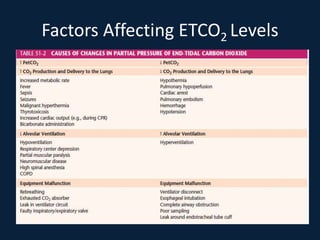
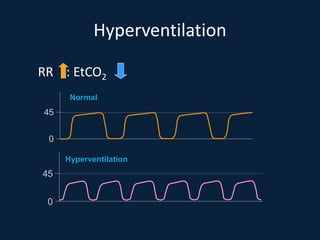
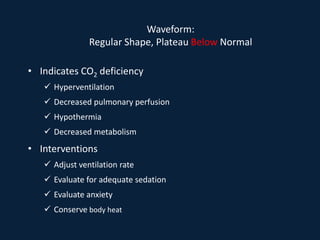
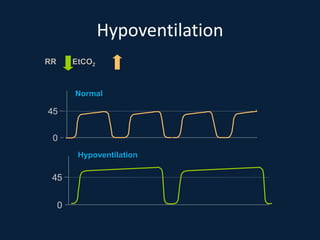
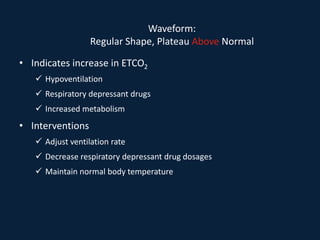
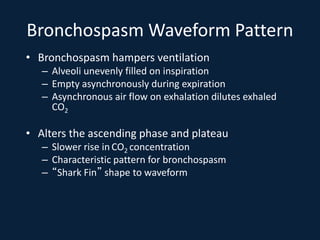
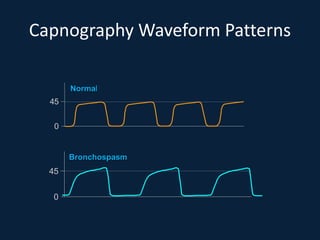
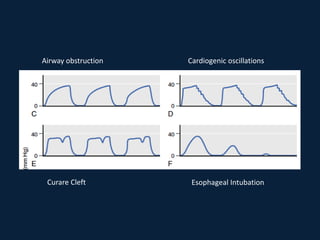
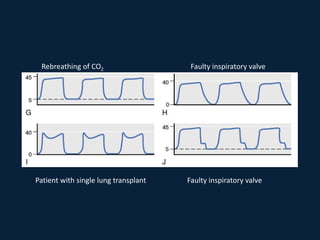
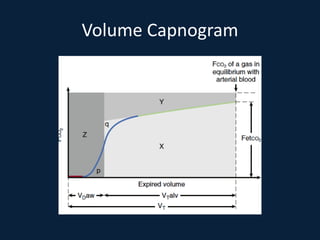
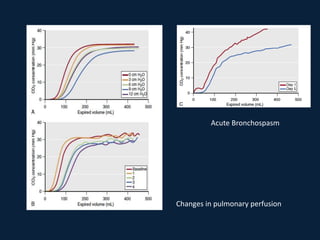
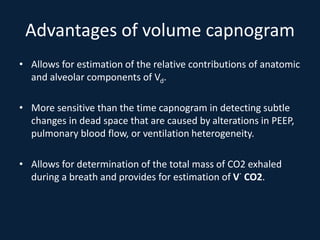
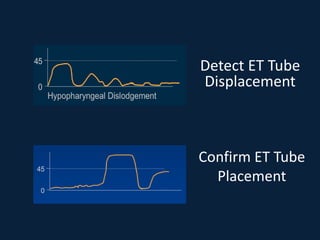
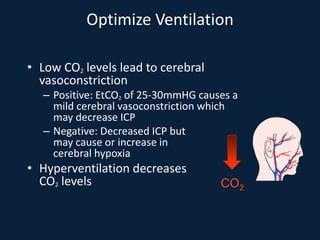
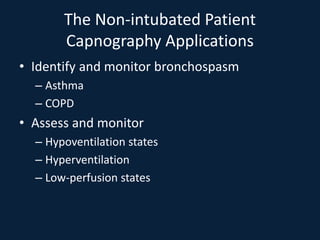
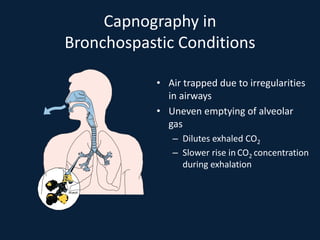
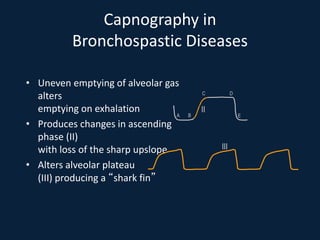
1.End tidal carbon dioxide
analysis
2.Transcutaneous and carbon dioxide
monitors
Introduction
• Capnometry refers to the measurement and
quantification of inhaled or exhaled CO2
concentrations at the airway opening.
• Capnography, however, refers not only to the
method of CO2 measurement, but also to its
graphic display as a function of time or
volume.
PHYSIOLOGY OF CAPNOMETRY
Oxygenation and Ventilation
Oxygenation
(oximetry)
Cellular
Metabolism
Ventilation
(capnography)
CO2
O2
Oxygenation and Ventilation
• Oxygenation
– Oxygen for metabolism
– SpO2 measures
% of O2 in RBC
– Reflects change in
oxygenation within
5 minutes
• Ventilation
– Carbon dioxide
from metabolism
– EtCO2 measures
exhaled CO2 at
point of exit
– Reflects change in
ventilation within
10 seconds
CO2 transport
End-tidal CO2 (EtCO2)
• Reflects changes in
– Ventilation - movement of air in and
out of the lungs
– Diffusion - exchange of gases between the
air-filled alveoli and the pulmonary
circulation
– Perfusion - circulation of blood
End-tidal CO2 (EtCO2)
r r Oxygen
O
2
CO2
O
2
Vein
A te y
Ventilation
Perfusion
Pulmonary Blood Flow
Right
Ventricle
Left
Atrium
End-tidal CO2 (EtCO2)
• Monitors changes in
– Ventilation - asthma, COPD, airway
edema, foreign body, stroke
– Diffusion - pulmonary edema,
alveolar damage, CO poisoning, smoke
inhalation
– Perfusion - shock, pulmonary embolus,
cardiac arrest,
severe dysrhythmias
PRINCIPLES OF CAPNOGRAPHY
BEER-LAMBERT LAW
Types of sensors
Solid state CO2 sensors
Chopper wheel CO2 sensor
Sidestream vs Mainstream
Capnometry
Sidestream/ Diverging
• CO2 sensor located away from the
airway gases to be measured.
• Incorporate a pump or
compressor.
• Tubing length- 6 ft
• Gas withdrawal rate 30-
500ml/min
• Lost gas volume needs to be
considered in closed circuit
anesthesia.
• Gases must pass through various
water traps and filters.
• Transport delay time
• Associated RISE TIME
Mainstream/ Non- diverting
• Sample cell placed directly in the
patients breathing circuit.
• Inspiratory and expiratory gases
pass directly through the IR path
• Increase in dead space and is
heavy
• Sample cell heated to 40 degrees
to minimize condensation.
• Increased risk of facial burns.
• Requires daily calibration.
• No delay time
• RISE TIME is faster
Types of capnometers
CAPNOGRAPHY WAVEFORMS
Interpretation of TIME
Capnographic Waveform
• Normal waveform of one respiratory cycle
• Similar to ECG
– Height shows amount of CO2
– Length depicts time
Capnographic Waveform
• Waveforms on screen and printout
may differ in duration
– On-screen capnography waveform is condensed to
provide adequate information the in 4-second
view.
Capnographic Waveform
• Capnograph detects only CO2
from ventilation
• No CO2 present during inspiration
– Baseline is normally zero
A B
C D
E
Baseline
Capnogram Phase I
Dead Space Ventilation
• Beginning of exhalation
• No CO2 present
• Air from trachea,
posterior pharynx,
mouth and nose
– No gas exchange
occurs there
– Called “dead space”
Deadspace
Capnogram Phase I
Baseline
Beginning of exhalation
A
B
I Baseline
Capnogram Phase II
Ascending Phase
• CO2 from the alveoli begins to
reach the upper airway and
mix with the dead space air
– Causes a rapid rise in the
amount of CO2
• CO2 now present and detected
in exhaled air
Alveoli
Capnogram Phase II
Ascending Phase
CO2 present and increasing in exhaled air
II
A B
C
Ascending Phase
Early Exhalation
Capnogram Phase III
Alveolar Plateau
• CO2 rich alveolar gas
now constitutes the
majority of the
exhaled air
• Uniform concentration
of CO2 from alveoli to
nose/mouth
Capnogram Phase III
Alveolar Plateau
CO2 exhalation wave plateaus
A B
C D
III
Alveolar Plateau
Capnogram Phase III
End-Tidal
• End of exhalation contains the highest
concentration of CO2
– The “end-tidal CO2”
– The number seen on your monitor
• Normal EtCO2 is 35-45mmHg
Capnogram Phase III
End-Tidal
End of the the wave of exhalation
A B
C D End-tidal
Capnogram Phase IV
Descending Phase
• Inhalation begins
• Oxygen fills airway
• CO2 level quickly
drops to zero
Alveoli
Capnogram Phase IV
Descending Phase
Inspiratory downstroke returns to baseline
A B
C D
E
IV
Descending Phase
Inhalation
Capnography Waveform
Normal range is 35-45mm Hg (5% vol)
Normal Waveform
45
0
a-A Gradient
r r Alveolus
PaCO2
Vein
A te y
Ventilation
Perfusion
arterial to Alveolar Difference for CO2
Right
Ventricle
Left
Atrium
EtCO2
End-tidal CO2 (EtCO2)
• Normal a-A gradient
– 2-5mmHg difference between the EtCO2
and PaCO2 in a patient with healthy lungs
Factors Affecting ETCO2 Levels
45
0
Hyperventilation
RR : EtCO2
45
0
Normal
Hyperventilation
Waveform:
Regular Shape, Plateau Below Normal
• Indicates CO2 deficiency
 Hyperventilation
 Decreased pulmonary perfusion
 Hypothermia
 Decreased metabolism
• Interventions
 Adjust ventilation rate
 Evaluate for adequate sedation
 Evaluate anxiety
 Conserve body heat
Hypoventilation
45
0
45
0
RR : EtCO2
Normal
Hypoventilation
Waveform:
Regular Shape, Plateau Above Normal
• Indicates increase in ETCO2
 Hypoventilation
 Respiratory depressant drugs
 Increased metabolism
• Interventions
 Adjust ventilation rate
 Decrease respiratory depressant drug dosages
 Maintain normal body temperature
Bronchospasm Waveform Pattern
• Bronchospasm hampers ventilation
– Alveoli unevenly filled on inspiration
– Empty asynchronously during expiration
– Asynchronous air flow on exhalation dilutes exhaled
CO2
• Alters the ascending phase and plateau
– Slower rise in CO2 concentration
– Characteristic pattern for bronchospasm
– “Shark Fin” shape to waveform
Capnography Waveform Patterns
45
0
Normal
Bronchospasm
45
0
Capnography Waveform Patterns
45
0
Hypoventilation
Normal
45
0
45
0
Bronchospasm
Hyperventilation
45
0
Airway obstruction Cardiogenic oscillations
Curare Cleft Esophageal Intubation
Rebreathing of CO2 Faulty inspiratory valve
Patient with single lung transplant Faulty inspiratory valve
Ruptured/ Leaking ET tube cuff Leak in side stream sample line
Expiratory valve stuck open
Electrical Noise
VOLUME CAPNOGRAM
Volume Capnogram
Acute Bronchospasm
Changes in pulmonary perfusion
Advantages of volume capnogram
• Allows for estimation of the relative contributions of anatomic
and alveolar components of Vd.
• More sensitive than the time capnogram in detecting subtle
changes in dead space that are caused by alterations in PEEP,
pulmonary blood flow, or ventilation heterogeneity.
• Allows for determination of the total mass of CO2 exhaled
during a breath and provides for estimation of V˙ CO2.
USES OF CAPNOGRAPHY
Detect ET Tube
Displacement
Confirm ET Tube
Placement
Capnography in
Cardiopulmonary Resuscitation
• Assess chest compressions
• Early detection of ROSC
• Objective data for decision to cease resuscitation
• Use feedback from EtCO2 to depth/rate/force of chest
compressions during CPR.
In Laparoscopic Surgeries
1.Non invasive monitor of PaCO2 and can be used to adjust ventilation.
2.Detection of accidental intravascular CO2 insufflation.
3.Helps to detect complications of CO2 insufflation like pneumothorax.
Optimize Ventilation
• Use capnography to titrate EtCO2 levels
in patients sensitive to fluctuations
• Patients with suspected increased intracranial
pressure (ICP)
– Head trauma
– Stroke
– Brain tumors
– Brain infections
Optimize Ventilation
• High CO2 levels induce
cerebral vasodilatation
– Positive: Increases CBF to
counter cerebral hypoxia
– Negative: Increased CBF,
increases ICP and may increase
brain edema
• Hypoventilation retains CO2
which increases levels
CO2
Optimize Ventilation
• Low CO2 levels lead to cerebral
vasoconstriction
– Positive: EtCO2 of 25-30mmHG causes a
mild cerebral vasoconstriction which
may decrease ICP
– Negative: Decreased ICP but
may cause or increase in
cerebral hypoxia
• Hyperventilation decreases
CO2 levels CO2
The Non-intubated Patient
Capnography Applications
• Identify and monitor bronchospasm
– Asthma
– COPD
• Assess and monitor
– Hypoventilation states
– Hyperventilation
– Low-perfusion states
Capnography in
Bronchospastic Conditions
• Air trapped due to irregularities
in airways
• Uneven emptying of alveolar
gas
– Dilutes exhaled CO2
– Slower rise in CO2 concentration
during exhalation
Alveoli
Capnography in
Bronchospastic Diseases
• Uneven emptying of alveolar gas
alters
emptying on exhalation
• Produces changes in ascending
phase (II)
with loss of the sharp upslope
• Alters alveolar plateau
(III) producing a “shark fin”
A B
C D
E
II
III
Capnography in Bronchospastic Conditions
AsthmaCase
Initial
After therapy
Capnography in Bronchospastic Conditions
Pathology of COPD
• Progressive
• Partially reversible
• Airways obstructed
– Hyperplasia of mucous glands &
smooth muscle
– Excess mucous production
– Some hyper-responsiveness
Capnography in Bronchospastic Conditions
Capnography in COPD
• Arterial CO2 in COPD
– PaCO2 increases as disease progresses
– Requires frequent arterial punctures for ABGs
• Correlating capnograph to patient status
– Ascending phase and plateau are altered by
uneven emptying of gases
Capnography in
Hypoventilation States
• Altered mental status
– Sedation
– Alcohol intoxication
– Drug Ingestion
– Stroke
– CNS infections
– Head injury
• Abnormal breathing
• CO2 retention
– EtCO2 >50mmHg
Capnography Applications
on Non-intubated Patients
• New applications now being reported
– Pulmonary emboli
– CHF
– DKA
r r O xy g e n
O 2
V e in
A te y
PULMONARY EMBOLUS
TRANSCUTANEOUS AND CARBON
DIOXIDE MONITORS
• Transcutaneous measurements of PO2 (Ptco2) and Pco2
(Ptcco2) are monitoring methods that aim to provide
noninvasive estimates of arterial O2 and CO2, or at least
trends associated with these variables.
• Transcutaneous monitoring can be applied when expired
gas sampling is limited.
• The measurements are based on the diffusion of O2 and
CO2 through the skin.
• Used successfully in neonates and infants
• Applied when expired gas sampling is limited
• Measurements are based on the diffusion of CO2
and O2 through the skin.
• Warming is used to facilitate gas diffusion.
• Such an increase in temperature promotes
increased O2 and CO2 partial pressure at skin
surface.
• Ptco2 is usually lower than PaO2, and Ptcco2 is
higher than Paco2.
• A transducer using a pH electrode to measure
the Pco2 (Stow-Severinghaus electrode) is
used.
• A change in pH is proportional to the
logarithm of the Pco2 change. For CO2
monitors
• A temperature correction factor is used to
estimate Paco2 from Ptcco2.
Uses of Ptcco2
1. Assess the efficacy of mechanical ventilation
in respiratory failure.
2. Laparoscopic surgery with prolonged
pneumoperitoneum.
3. Deep sedation for ambulatory hysteroscopy
in healthy patient.
4. Weaning from mechanical ventilation after
off pump CABG.
Uses of Ptco2
• Detect hyperoxia in neonates
• Adults:
1. Wound management
2. peripheral vascular disease
3. hyperbaric medicine.
Limitations
• Poor cutaneous blood flow
• Frequent calibration
• Slow response time
• Skin burns with prolonged application
References
• Understanding anesthesia equipment, 5th
edition Dorsch and Dorsch
• Miller’s Anesthesia 8th edition
• Care fusion capnography handbook
• www.capnography.org
THANK YOU
THE END

endtidalco2-150217064408-conversion-gate01.pdf

  • 1.
    1.End tidal carbondioxide analysis 2.Transcutaneous and carbon dioxide monitors
  • 2.
    Introduction • Capnometry refersto the measurement and quantification of inhaled or exhaled CO2 concentrations at the airway opening. • Capnography, however, refers not only to the method of CO2 measurement, but also to its graphic display as a function of time or volume.
  • 3.
  • 4.
  • 5.
    Oxygenation and Ventilation •Oxygenation – Oxygen for metabolism – SpO2 measures % of O2 in RBC – Reflects change in oxygenation within 5 minutes • Ventilation – Carbon dioxide from metabolism – EtCO2 measures exhaled CO2 at point of exit – Reflects change in ventilation within 10 seconds
  • 6.
  • 7.
    End-tidal CO2 (EtCO2) •Reflects changes in – Ventilation - movement of air in and out of the lungs – Diffusion - exchange of gases between the air-filled alveoli and the pulmonary circulation – Perfusion - circulation of blood
  • 8.
    End-tidal CO2 (EtCO2) rr Oxygen O 2 CO2 O 2 Vein A te y Ventilation Perfusion Pulmonary Blood Flow Right Ventricle Left Atrium
  • 9.
    End-tidal CO2 (EtCO2) •Monitors changes in – Ventilation - asthma, COPD, airway edema, foreign body, stroke – Diffusion - pulmonary edema, alveolar damage, CO poisoning, smoke inhalation – Perfusion - shock, pulmonary embolus, cardiac arrest, severe dysrhythmias
  • 11.
  • 12.
  • 13.
    Types of sensors Solidstate CO2 sensors Chopper wheel CO2 sensor
  • 14.
    Sidestream vs Mainstream Capnometry Sidestream/Diverging • CO2 sensor located away from the airway gases to be measured. • Incorporate a pump or compressor. • Tubing length- 6 ft • Gas withdrawal rate 30- 500ml/min • Lost gas volume needs to be considered in closed circuit anesthesia. • Gases must pass through various water traps and filters. • Transport delay time • Associated RISE TIME Mainstream/ Non- diverting • Sample cell placed directly in the patients breathing circuit. • Inspiratory and expiratory gases pass directly through the IR path • Increase in dead space and is heavy • Sample cell heated to 40 degrees to minimize condensation. • Increased risk of facial burns. • Requires daily calibration. • No delay time • RISE TIME is faster
  • 15.
  • 16.
  • 17.
    Capnographic Waveform • Normalwaveform of one respiratory cycle • Similar to ECG – Height shows amount of CO2 – Length depicts time
  • 18.
    Capnographic Waveform • Waveformson screen and printout may differ in duration – On-screen capnography waveform is condensed to provide adequate information the in 4-second view.
  • 19.
    Capnographic Waveform • Capnographdetects only CO2 from ventilation • No CO2 present during inspiration – Baseline is normally zero A B C D E Baseline
  • 20.
    Capnogram Phase I DeadSpace Ventilation • Beginning of exhalation • No CO2 present • Air from trachea, posterior pharynx, mouth and nose – No gas exchange occurs there – Called “dead space”
  • 21.
  • 22.
    Capnogram Phase I Baseline Beginningof exhalation A B I Baseline
  • 23.
    Capnogram Phase II AscendingPhase • CO2 from the alveoli begins to reach the upper airway and mix with the dead space air – Causes a rapid rise in the amount of CO2 • CO2 now present and detected in exhaled air Alveoli
  • 24.
    Capnogram Phase II AscendingPhase CO2 present and increasing in exhaled air II A B C Ascending Phase Early Exhalation
  • 25.
    Capnogram Phase III AlveolarPlateau • CO2 rich alveolar gas now constitutes the majority of the exhaled air • Uniform concentration of CO2 from alveoli to nose/mouth
  • 26.
    Capnogram Phase III AlveolarPlateau CO2 exhalation wave plateaus A B C D III Alveolar Plateau
  • 27.
    Capnogram Phase III End-Tidal •End of exhalation contains the highest concentration of CO2 – The “end-tidal CO2” – The number seen on your monitor • Normal EtCO2 is 35-45mmHg
  • 28.
    Capnogram Phase III End-Tidal Endof the the wave of exhalation A B C D End-tidal
  • 29.
    Capnogram Phase IV DescendingPhase • Inhalation begins • Oxygen fills airway • CO2 level quickly drops to zero Alveoli
  • 30.
    Capnogram Phase IV DescendingPhase Inspiratory downstroke returns to baseline A B C D E IV Descending Phase Inhalation
  • 31.
    Capnography Waveform Normal rangeis 35-45mm Hg (5% vol) Normal Waveform 45 0
  • 32.
    a-A Gradient r rAlveolus PaCO2 Vein A te y Ventilation Perfusion arterial to Alveolar Difference for CO2 Right Ventricle Left Atrium EtCO2
  • 35.
    End-tidal CO2 (EtCO2) •Normal a-A gradient – 2-5mmHg difference between the EtCO2 and PaCO2 in a patient with healthy lungs
  • 36.
  • 37.
  • 38.
    Waveform: Regular Shape, PlateauBelow Normal • Indicates CO2 deficiency  Hyperventilation  Decreased pulmonary perfusion  Hypothermia  Decreased metabolism • Interventions  Adjust ventilation rate  Evaluate for adequate sedation  Evaluate anxiety  Conserve body heat
  • 39.
  • 40.
    Waveform: Regular Shape, PlateauAbove Normal • Indicates increase in ETCO2  Hypoventilation  Respiratory depressant drugs  Increased metabolism • Interventions  Adjust ventilation rate  Decrease respiratory depressant drug dosages  Maintain normal body temperature
  • 41.
    Bronchospasm Waveform Pattern •Bronchospasm hampers ventilation – Alveoli unevenly filled on inspiration – Empty asynchronously during expiration – Asynchronous air flow on exhalation dilutes exhaled CO2 • Alters the ascending phase and plateau – Slower rise in CO2 concentration – Characteristic pattern for bronchospasm – “Shark Fin” shape to waveform
  • 42.
  • 43.
  • 44.
    Airway obstruction Cardiogenicoscillations Curare Cleft Esophageal Intubation
  • 45.
    Rebreathing of CO2Faulty inspiratory valve Patient with single lung transplant Faulty inspiratory valve
  • 46.
    Ruptured/ Leaking ETtube cuff Leak in side stream sample line Expiratory valve stuck open Electrical Noise
  • 50.
  • 51.
  • 52.
    Acute Bronchospasm Changes inpulmonary perfusion
  • 53.
    Advantages of volumecapnogram • Allows for estimation of the relative contributions of anatomic and alveolar components of Vd. • More sensitive than the time capnogram in detecting subtle changes in dead space that are caused by alterations in PEEP, pulmonary blood flow, or ventilation heterogeneity. • Allows for determination of the total mass of CO2 exhaled during a breath and provides for estimation of V˙ CO2.
  • 54.
  • 55.
  • 56.
    Capnography in Cardiopulmonary Resuscitation •Assess chest compressions • Early detection of ROSC • Objective data for decision to cease resuscitation • Use feedback from EtCO2 to depth/rate/force of chest compressions during CPR.
  • 57.
    In Laparoscopic Surgeries 1.Noninvasive monitor of PaCO2 and can be used to adjust ventilation. 2.Detection of accidental intravascular CO2 insufflation. 3.Helps to detect complications of CO2 insufflation like pneumothorax.
  • 58.
    Optimize Ventilation • Usecapnography to titrate EtCO2 levels in patients sensitive to fluctuations • Patients with suspected increased intracranial pressure (ICP) – Head trauma – Stroke – Brain tumors – Brain infections
  • 59.
    Optimize Ventilation • HighCO2 levels induce cerebral vasodilatation – Positive: Increases CBF to counter cerebral hypoxia – Negative: Increased CBF, increases ICP and may increase brain edema • Hypoventilation retains CO2 which increases levels CO2
  • 60.
    Optimize Ventilation • LowCO2 levels lead to cerebral vasoconstriction – Positive: EtCO2 of 25-30mmHG causes a mild cerebral vasoconstriction which may decrease ICP – Negative: Decreased ICP but may cause or increase in cerebral hypoxia • Hyperventilation decreases CO2 levels CO2
  • 61.
    The Non-intubated Patient CapnographyApplications • Identify and monitor bronchospasm – Asthma – COPD • Assess and monitor – Hypoventilation states – Hyperventilation – Low-perfusion states
  • 62.
    Capnography in Bronchospastic Conditions •Air trapped due to irregularities in airways • Uneven emptying of alveolar gas – Dilutes exhaled CO2 – Slower rise in CO2 concentration during exhalation Alveoli
  • 63.
    Capnography in Bronchospastic Diseases •Uneven emptying of alveolar gas alters emptying on exhalation • Produces changes in ascending phase (II) with loss of the sharp upslope • Alters alveolar plateau (III) producing a “shark fin” A B C D E II III
  • 64.
    Capnography in BronchospasticConditions AsthmaCase Initial After therapy
  • 65.
    Capnography in BronchospasticConditions Pathology of COPD • Progressive • Partially reversible • Airways obstructed – Hyperplasia of mucous glands & smooth muscle – Excess mucous production – Some hyper-responsiveness
  • 66.
    Capnography in BronchospasticConditions Capnography in COPD • Arterial CO2 in COPD – PaCO2 increases as disease progresses – Requires frequent arterial punctures for ABGs • Correlating capnograph to patient status – Ascending phase and plateau are altered by uneven emptying of gases
  • 67.
    Capnography in Hypoventilation States •Altered mental status – Sedation – Alcohol intoxication – Drug Ingestion – Stroke – CNS infections – Head injury • Abnormal breathing • CO2 retention – EtCO2 >50mmHg
  • 68.
    Capnography Applications on Non-intubatedPatients • New applications now being reported – Pulmonary emboli – CHF – DKA r r O xy g e n O 2 V e in A te y
  • 69.
  • 70.
  • 71.
    • Transcutaneous measurementsof PO2 (Ptco2) and Pco2 (Ptcco2) are monitoring methods that aim to provide noninvasive estimates of arterial O2 and CO2, or at least trends associated with these variables. • Transcutaneous monitoring can be applied when expired gas sampling is limited. • The measurements are based on the diffusion of O2 and CO2 through the skin. • Used successfully in neonates and infants
  • 72.
    • Applied whenexpired gas sampling is limited • Measurements are based on the diffusion of CO2 and O2 through the skin. • Warming is used to facilitate gas diffusion. • Such an increase in temperature promotes increased O2 and CO2 partial pressure at skin surface. • Ptco2 is usually lower than PaO2, and Ptcco2 is higher than Paco2.
  • 73.
    • A transducerusing a pH electrode to measure the Pco2 (Stow-Severinghaus electrode) is used. • A change in pH is proportional to the logarithm of the Pco2 change. For CO2 monitors • A temperature correction factor is used to estimate Paco2 from Ptcco2.
  • 75.
    Uses of Ptcco2 1.Assess the efficacy of mechanical ventilation in respiratory failure. 2. Laparoscopic surgery with prolonged pneumoperitoneum. 3. Deep sedation for ambulatory hysteroscopy in healthy patient. 4. Weaning from mechanical ventilation after off pump CABG.
  • 76.
    Uses of Ptco2 •Detect hyperoxia in neonates • Adults: 1. Wound management 2. peripheral vascular disease 3. hyperbaric medicine.
  • 77.
    Limitations • Poor cutaneousblood flow • Frequent calibration • Slow response time • Skin burns with prolonged application
  • 78.
    References • Understanding anesthesiaequipment, 5th edition Dorsch and Dorsch • Miller’s Anesthesia 8th edition • Care fusion capnography handbook • www.capnography.org
  • 79.