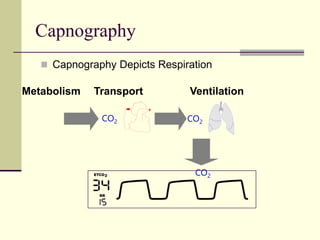
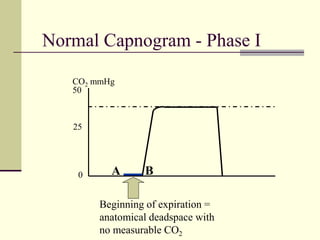
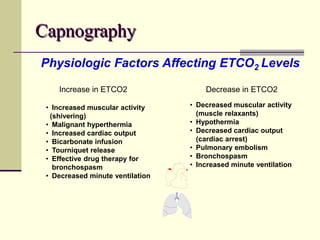
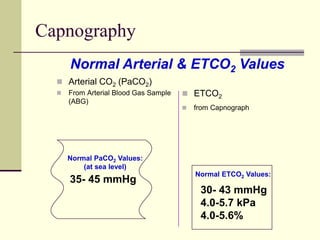
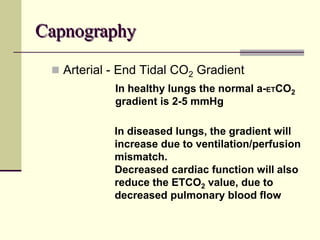
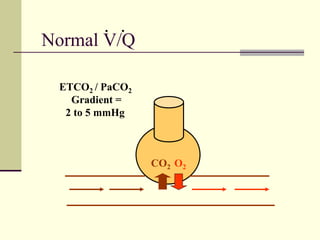
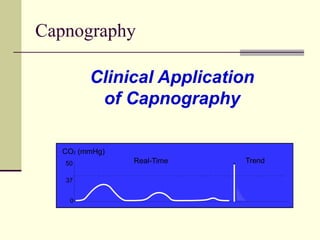
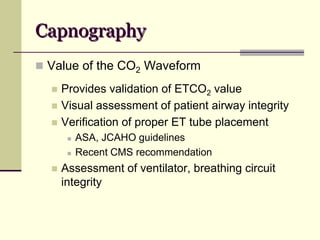
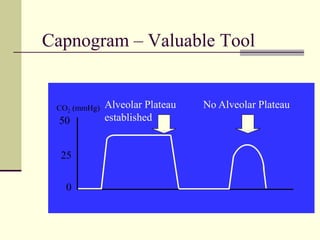
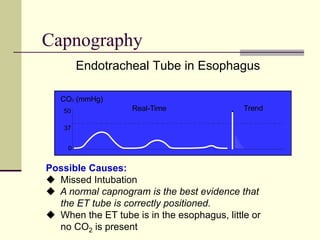
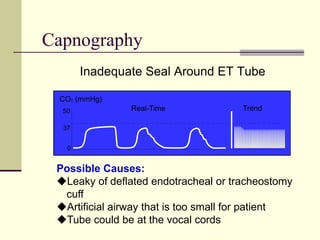
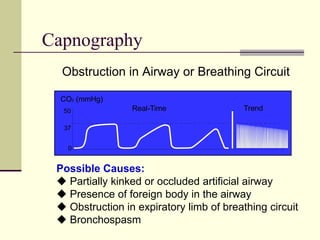
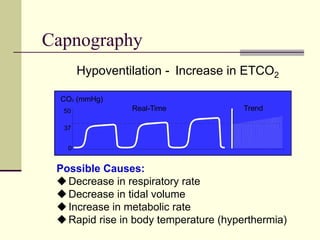
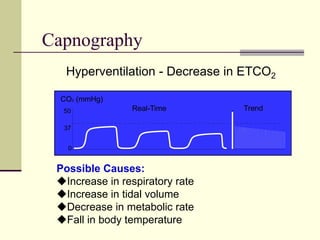
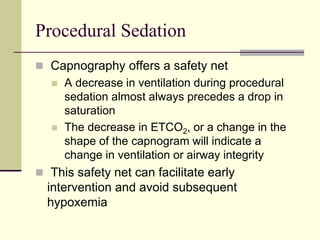
Noninvasive CO2 Monitoring
Technology & Clinical
Applications
Lonnie Martinez
Director of Respiratory Care
Swedish Medical Center
Objectives
 Definitions and
Parameters
 Descriptors and
Overview
 Interpretation –
Especially Waveform
 Bedside Application
 Conscious Sedation
CO (mmHg)
2
0
37
50 Real-Time Trend
Capnography
 Respiration - The Big Picture
1 Cellular Metabolism of food into
energy - O2 consumption & CO2
Production
Transport of O2 & CO2 between cells
and pulmonary capillaries, &
diffusion from/into alveoli.
Ventilation between alveoli &
atmosphere
2
3
Monitoring CO2
Elimination => Patient
response to changes in
Circulation
Diffusion
Ventilation
Metabolism
(CO2 Production)
Ventilation
CO2 Elimination
(VCO2)
Transport
PaCO2
MTV
 Capnography Depicts Respiration
Capnography
Metabolism Transport Ventilation
CO2 CO2
CO2
ETCO2
RR
Capnography
Technical Aspects
of Capnography
Capnography
 Capnography vs. Capnometry
Capnography
• Measurement &
display of ETCO2 and
the (CO2 waveform)
 Measured by a
capnograph
Capnometry
 Measurement &
display of the ETCO2
value (no waveform)
 Measured by a
capnometer
ETCO2
RR
ETCO2
RR
Capnography
 Mainstream
Technology
 Sensor placed in
ventilator circuit
 Measurement made at
the patient’s airway
 Fast response time
 No water traps or tubing
needed - hassle free
 Non-intubated patient
may use Capno Masks
Sensor
Capnography
 Sidestream Technology  Sensor located away from
the airway
 Gas moved to sensor by
pump inside the monitor
 Use with cannula or adapt
for ventilator airway
 Water traps, filters, or
dehumidification tubing may
be required
Capnography
 Quantitative vs. Qualitative ETCO2
Quantitative ETCO2
 Provides actual
numeric value
 Found in
capnographs and
capnometers
Qualitative ETCO2
 Only provides range
of values
 Colorimetric CO2
detectors
ETCO2
RR
mmHg
ETCO2
0-10
11-20
21-30
31-40
over 40
0-4
5-20
>20
Normal Capnogram - Phase I
50
0
25
CO2 mmHg
Beginning of expiration =
anatomical deadspace with
no measurable CO2
A B
Anatomical Dead Space
 Anatomical Dead Space
 Internal volume of the
upper airways
• Nose
• Pharynx
• Trachea
• Bronchi
Anatomical Deadspace
Conducting Airway - No Gas Exchange
Normal Capnogram - Phase II
50
0
25
CO2 mmHg
Mixed CO2, rapid rise in
CO2 concentration
B
C
Phase II - Transitional Gas
CO2
mmHg
Exhaled Volume
Normal Capnogram - Phase III
50
0
25
CO2 mmHg
Time
Alveolar Plateau, all exhaled
gas took part in gas exchange
End Tidal
CO2 value
C D
Normal Capnogram - Phase IV
50
0
25
CO2 mmHg
Inspiration starts,
CO2 drops off rapidly
E
D
Capnography
• Increased muscular activity
(shivering)
• Malignant hyperthermia
• Increased cardiac output
• Bicarbonate infusion
• Tourniquet release
• Effective drug therapy for
bronchospasm
• Decreased minute ventilation
• Decreased muscular activity
(muscle relaxants)
• Hypothermia
• Decreased cardiac output
(cardiac arrest)
• Pulmonary embolism
• Bronchospasm
• Increased minute ventilation
Physiologic Factors Affecting ETCO2 Levels
Increase in ETCO2 Decrease in ETCO2
Capnography
 Arterial CO2 (PaCO2)
 From Arterial Blood Gas Sample
(ABG)
 ETCO2
 from Capnograph
Normal Arterial & ETCO2 Values
Normal PaCO2 Values:
(at sea level)
35- 45 mmHg
Normal ETCO2 Values:
30- 43 mmHg
4.0-5.7 kPa
4.0-5.6%
Understanding why ETCO2 doesn’t match the ABG is
important, if you don’t understand why it doesn’t
match, it erodes confidence in all of the values!!!
You may throw the baby out with the bath water!!
Capnography
 Arterial - End Tidal CO2 Gradient
In healthy lungs the normal a-ETCO2
gradient is 2-5 mmHg
In diseased lungs, the gradient will
increase due to ventilation/perfusion
mismatch.
Decreased cardiac function will also
reduce the ETCO2 value, due to
decreased pulmonary blood flow
Capnography
 Deadspace
 Ventilated areas which do not participate in
gas exchange
Anatomic Deadspace
(airways leading to the
alveoli
Total Deadspace
Alveolar Deadspace
(ventilated areas in the
lungs)
Mechanical Deadspace
(artificial airways
including ventilator
circuits)
+ +
Normal V/Q
CO2 O2
ETCO2 / PaCO2
Gradient =
2 to 5 mmHg
. .
Shunt Perfusion – Low V/Q
No exchange of O2 or CO2
ETCO2 / PaCO2
Gradient =
4 to 10 mmHg
. .
Dead Space Ventilation
High V/Q
Perfusion is the problem
No exchange of O2 or CO2 occurs
ETCO2 / PaCO2
Gradient is large
May exceed 60 torr
Ventilation is
not the problem!
. .
Dead Space Ventilation
0 0
0
0
0
0
0
PaCO2 = 53 mmHg
ETCO2 = 33 mmHg
53
53
53
Alveoli that do not
take part in gas
exchange will still
have no CO2 –
Therefore they will
dilute the CO2 from the
alveoli that were
perfused
The result is a widened ETCO2 to PaCO2 Gradient
Capnography
Clinical Application
of Capnography
CO (mmHg)
2
0
37
50 Real-Time Trend
Capnography
 Value of the CO2 Waveform
 Provides validation of ETCO2 value
 Visual assessment of patient airway integrity
 Verification of proper ET tube placement
 ASA, JCAHO guidelines
 Recent CMS recommendation
 Assessment of ventilator, breathing circuit
integrity
Capnogram – Valuable Tool
CO2 (mmHg)
0
25
50
Alveolar Plateau
established
No Alveolar Plateau
Abnormal
CO2 Waveforms
Capnography
Endotracheal Tube in Esophagus
Possible Causes:
 Missed Intubation
 A normal capnogram is the best evidence that
the ET tube is correctly positioned.
 When the ET tube is in the esophagus, little or
no CO2 is present
CO (mmHg)
2
0
37
50 Real-Time Trend
Capnography
Inadequate Seal Around ET Tube
Possible Causes:
Leaky of deflated endotracheal or tracheostomy
cuff
Artificial airway that is too small for patient
Tube could be at the vocal cords
CO (mmHg)
2
0
37
50 Real-Time Trend
Capnography
Obstruction in Airway or Breathing Circuit
Possible Causes:
 Partially kinked or occluded artificial airway
 Presence of foreign body in the airway
 Obstruction in expiratory limb of breathing circuit
 Bronchospasm
CO (mmHg)
2
0
37
50 Real-Time Trend
CO2
Exhaled Volume
Day 1
Day 5
Patient with Asthma
Capnography
Hypoventilation - Increase in ETCO2
Possible Causes:
Decrease in respiratory rate
Decrease in tidal volume
Increase in metabolic rate
Rapid rise in body temperature (hyperthermia)
CO (mmHg)
2
0
37
50 Real-Time Trend
Capnography
Hyperventilation - Decrease in ETCO2
Possible Causes:
Increase in respiratory rate
Increase in tidal volume
Decrease in metabolic rate
Fall in body temperature
CO (mmHg)
2
0
37
50 Real-Time Trend
• Based on simple O2
delivery style mask
• Allows measurement
of EtCO2 and delivery
of O2 on non-
intubated patients
• Effective Capnogram
to verify data
• Excellent Choice for
Conscious Sedation
CAPNO2 Mask O2 Delivery/CO2 Mainstream
Mask
Cannula O2 Delivery/ CO2 Sidestream
Procedural Sedation
 Capnography is the logical device to monitor
ventilation during procedural sedation
 Why?
 Airway problems are primary causes of
morbidity associated with sedation/analgesia
 Drug induced respiratory depression
 Airway obstruction
Procedural Sedation with O2
 Capnography is a valuable monitoring tool to
to detect respiratory events that could
culminate in hypoxia
 Why?
 Patients in the ED are often on supplemental
oxygen
 Increased FIO2 may mask the decrease in
ventilation early on if you are only observing
pulse oximetry
Procedural Sedation
 Capnography offers a safety net
 A decrease in ventilation during procedural
sedation almost always precedes a drop in
saturation
 The decrease in ETCO2, or a change in the
shape of the capnogram will indicate a
change in ventilation or airway integrity
 This safety net can facilitate early
intervention and avoid subsequent
hypoxemia
CPR
A cool story…Ventilator Dyssynchrony
Conclusion
 Improved Patient Monitoring
 It’s not just about the Number
 Waveform Interpretation
 Helps with Differential DX
 Clinical Application

EtCO2_-_Lonnie_Martinez (1).ppt

  • 1.
    Noninvasive CO2 Monitoring Technology& Clinical Applications Lonnie Martinez Director of Respiratory Care Swedish Medical Center
  • 2.
    Objectives  Definitions and Parameters Descriptors and Overview  Interpretation – Especially Waveform  Bedside Application  Conscious Sedation CO (mmHg) 2 0 37 50 Real-Time Trend
  • 3.
    Capnography  Respiration -The Big Picture 1 Cellular Metabolism of food into energy - O2 consumption & CO2 Production Transport of O2 & CO2 between cells and pulmonary capillaries, & diffusion from/into alveoli. Ventilation between alveoli & atmosphere 2 3
  • 4.
    Monitoring CO2 Elimination =>Patient response to changes in Circulation Diffusion Ventilation Metabolism (CO2 Production) Ventilation CO2 Elimination (VCO2) Transport PaCO2 MTV
  • 5.
     Capnography DepictsRespiration Capnography Metabolism Transport Ventilation CO2 CO2 CO2 ETCO2 RR
  • 6.
  • 7.
    Capnography  Capnography vs.Capnometry Capnography • Measurement & display of ETCO2 and the (CO2 waveform)  Measured by a capnograph Capnometry  Measurement & display of the ETCO2 value (no waveform)  Measured by a capnometer ETCO2 RR ETCO2 RR
  • 8.
    Capnography  Mainstream Technology  Sensorplaced in ventilator circuit  Measurement made at the patient’s airway  Fast response time  No water traps or tubing needed - hassle free  Non-intubated patient may use Capno Masks Sensor
  • 9.
    Capnography  Sidestream Technology Sensor located away from the airway  Gas moved to sensor by pump inside the monitor  Use with cannula or adapt for ventilator airway  Water traps, filters, or dehumidification tubing may be required
  • 10.
    Capnography  Quantitative vs.Qualitative ETCO2 Quantitative ETCO2  Provides actual numeric value  Found in capnographs and capnometers Qualitative ETCO2  Only provides range of values  Colorimetric CO2 detectors ETCO2 RR mmHg ETCO2 0-10 11-20 21-30 31-40 over 40 0-4 5-20 >20
  • 11.
    Normal Capnogram -Phase I 50 0 25 CO2 mmHg Beginning of expiration = anatomical deadspace with no measurable CO2 A B
  • 12.
    Anatomical Dead Space Anatomical Dead Space  Internal volume of the upper airways • Nose • Pharynx • Trachea • Bronchi Anatomical Deadspace Conducting Airway - No Gas Exchange
  • 13.
    Normal Capnogram -Phase II 50 0 25 CO2 mmHg Mixed CO2, rapid rise in CO2 concentration B C
  • 14.
    Phase II -Transitional Gas CO2 mmHg Exhaled Volume
  • 15.
    Normal Capnogram -Phase III 50 0 25 CO2 mmHg Time Alveolar Plateau, all exhaled gas took part in gas exchange End Tidal CO2 value C D
  • 16.
    Normal Capnogram -Phase IV 50 0 25 CO2 mmHg Inspiration starts, CO2 drops off rapidly E D
  • 17.
    Capnography • Increased muscularactivity (shivering) • Malignant hyperthermia • Increased cardiac output • Bicarbonate infusion • Tourniquet release • Effective drug therapy for bronchospasm • Decreased minute ventilation • Decreased muscular activity (muscle relaxants) • Hypothermia • Decreased cardiac output (cardiac arrest) • Pulmonary embolism • Bronchospasm • Increased minute ventilation Physiologic Factors Affecting ETCO2 Levels Increase in ETCO2 Decrease in ETCO2
  • 18.
    Capnography  Arterial CO2(PaCO2)  From Arterial Blood Gas Sample (ABG)  ETCO2  from Capnograph Normal Arterial & ETCO2 Values Normal PaCO2 Values: (at sea level) 35- 45 mmHg Normal ETCO2 Values: 30- 43 mmHg 4.0-5.7 kPa 4.0-5.6%
  • 19.
    Understanding why ETCO2doesn’t match the ABG is important, if you don’t understand why it doesn’t match, it erodes confidence in all of the values!!! You may throw the baby out with the bath water!!
  • 20.
    Capnography  Arterial -End Tidal CO2 Gradient In healthy lungs the normal a-ETCO2 gradient is 2-5 mmHg In diseased lungs, the gradient will increase due to ventilation/perfusion mismatch. Decreased cardiac function will also reduce the ETCO2 value, due to decreased pulmonary blood flow
  • 21.
    Capnography  Deadspace  Ventilatedareas which do not participate in gas exchange Anatomic Deadspace (airways leading to the alveoli Total Deadspace Alveolar Deadspace (ventilated areas in the lungs) Mechanical Deadspace (artificial airways including ventilator circuits) + +
  • 22.
    Normal V/Q CO2 O2 ETCO2/ PaCO2 Gradient = 2 to 5 mmHg . .
  • 23.
    Shunt Perfusion –Low V/Q No exchange of O2 or CO2 ETCO2 / PaCO2 Gradient = 4 to 10 mmHg . .
  • 24.
    Dead Space Ventilation HighV/Q Perfusion is the problem No exchange of O2 or CO2 occurs ETCO2 / PaCO2 Gradient is large May exceed 60 torr Ventilation is not the problem! . .
  • 25.
    Dead Space Ventilation 00 0 0 0 0 0 PaCO2 = 53 mmHg ETCO2 = 33 mmHg 53 53 53 Alveoli that do not take part in gas exchange will still have no CO2 – Therefore they will dilute the CO2 from the alveoli that were perfused The result is a widened ETCO2 to PaCO2 Gradient
  • 26.
  • 27.
    Capnography  Value ofthe CO2 Waveform  Provides validation of ETCO2 value  Visual assessment of patient airway integrity  Verification of proper ET tube placement  ASA, JCAHO guidelines  Recent CMS recommendation  Assessment of ventilator, breathing circuit integrity
  • 28.
    Capnogram – ValuableTool CO2 (mmHg) 0 25 50 Alveolar Plateau established No Alveolar Plateau
  • 29.
  • 30.
    Capnography Endotracheal Tube inEsophagus Possible Causes:  Missed Intubation  A normal capnogram is the best evidence that the ET tube is correctly positioned.  When the ET tube is in the esophagus, little or no CO2 is present CO (mmHg) 2 0 37 50 Real-Time Trend
  • 31.
    Capnography Inadequate Seal AroundET Tube Possible Causes: Leaky of deflated endotracheal or tracheostomy cuff Artificial airway that is too small for patient Tube could be at the vocal cords CO (mmHg) 2 0 37 50 Real-Time Trend
  • 32.
    Capnography Obstruction in Airwayor Breathing Circuit Possible Causes:  Partially kinked or occluded artificial airway  Presence of foreign body in the airway  Obstruction in expiratory limb of breathing circuit  Bronchospasm CO (mmHg) 2 0 37 50 Real-Time Trend
  • 33.
    CO2 Exhaled Volume Day 1 Day5 Patient with Asthma
  • 34.
    Capnography Hypoventilation - Increasein ETCO2 Possible Causes: Decrease in respiratory rate Decrease in tidal volume Increase in metabolic rate Rapid rise in body temperature (hyperthermia) CO (mmHg) 2 0 37 50 Real-Time Trend
  • 35.
    Capnography Hyperventilation - Decreasein ETCO2 Possible Causes: Increase in respiratory rate Increase in tidal volume Decrease in metabolic rate Fall in body temperature CO (mmHg) 2 0 37 50 Real-Time Trend
  • 36.
    • Based onsimple O2 delivery style mask • Allows measurement of EtCO2 and delivery of O2 on non- intubated patients • Effective Capnogram to verify data • Excellent Choice for Conscious Sedation CAPNO2 Mask O2 Delivery/CO2 Mainstream Mask
  • 37.
    Cannula O2 Delivery/CO2 Sidestream
  • 38.
    Procedural Sedation  Capnographyis the logical device to monitor ventilation during procedural sedation  Why?  Airway problems are primary causes of morbidity associated with sedation/analgesia  Drug induced respiratory depression  Airway obstruction
  • 39.
    Procedural Sedation withO2  Capnography is a valuable monitoring tool to to detect respiratory events that could culminate in hypoxia  Why?  Patients in the ED are often on supplemental oxygen  Increased FIO2 may mask the decrease in ventilation early on if you are only observing pulse oximetry
  • 40.
    Procedural Sedation  Capnographyoffers a safety net  A decrease in ventilation during procedural sedation almost always precedes a drop in saturation  The decrease in ETCO2, or a change in the shape of the capnogram will indicate a change in ventilation or airway integrity  This safety net can facilitate early intervention and avoid subsequent hypoxemia
  • 41.
  • 42.
  • 43.
    Conclusion  Improved PatientMonitoring  It’s not just about the Number  Waveform Interpretation  Helps with Differential DX  Clinical Application