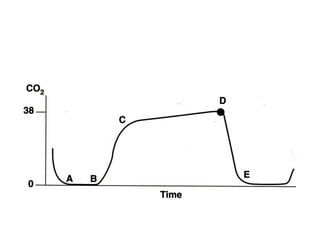
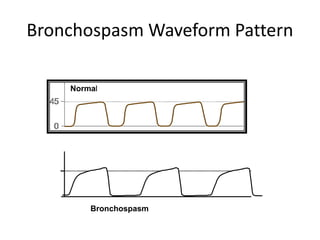
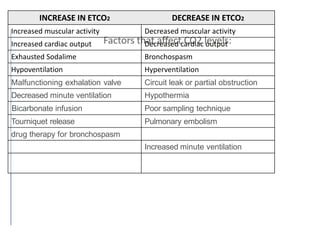
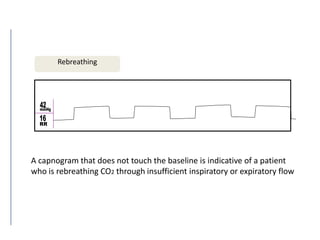
Capnography
Abere T. (Msc In Anesthesia)
Learning Objectives
by the end of this section the students able to
• Differentiate between oxygenation
and ventilation
• Define end-tidal CO2
• Identify phases of a normal capnogram
• Recognize patterns abnormal capnogram
Physiologic aspects and the need for capnography
Respiration
The respiratory process consists of three main events:
1. Cellular metabolism of food into energy—O2 consumption and CO2
production.
2. Transport of O2 and CO2 between cells and pulmonary capillaries, and
diffusion from/into alveoli.
3. Ventilation between alveoli and atmosphere
INTRODUCTION
introduction
introduction
• Oxygenation: The process of getting oxygen
into the body and to the tissues for
metabolism, is monitored with pulseoximetry.
• Ventilation: the process of eliminating CO2
from the body, is monitored with
capnography.
Capnography
 Continuous measurement of patient’s inhaled and exhaled
[CO2]
 Waveform display more informative than the value
 Useful for evaluation of
– Esophageal intubation
– Disconnect in breathing circuit
– Rebreathing of CO2
– Cardiac arrest
– Malignant Hyperthermia / Thyroid storm
– Hypotension
– PE
 ETCO2 underestimates PaCO2 due to deadspace ventilation
Capnography- Continuous analysis and recording of
Carbon Dioxide concentrations in respiratory gases.(
I.E. waveforms and numbers)
Capnograph a device that measures CO2 and displays a waveform.
Partial pressure (mmHg) or volume (% vol) of CO2 in
the airway at the end of exhalation
Breath-to-breath measurement provides
information within seconds
-CO2 dilates the cerebral blood vessels
increasing ICP by increasing the volume
of blood in the intracranial vault
Titrating CO2 levels to 30-35 mmHg
range in head injured patient can help
relieve the untoward effects of raised ICP
 CO₂ plays a role in metabolic, cardiovascular
and respiratory systems.
 Monitoring CO₂ concentration gives
indication of subtle pathological
disturbances of metabolic, cardiovascular
and respiratory systems.
Normal arterial and end-tidal CO2
values
Arterial CO2 (PaCO2) sample (ABG)
 PaCO2values: 35 to 45 mmHg
End-tidal CO2 (EtCO2)From capnograh
values: 30 to 43 mmHg
4.0 to 5.7 kPa
4.0 to 5.6%
Mixed venous blood gas PeCO2
Normal range: 46-48mmHg
Generally; ETCO2 < PACO2 < PaCO2
Arterial to end-tidal CO2 gradient
the difference b/n aCO2(from ABG) and ACO2(EtCO2
2 to 5 mmHg.
This difference is termed the PaCO2—PEtCO2 gradient
or the a—ADCO2 and can be increased by:
COPD (causing incomplete alveolar emptying)
ARDS(causing V/Q mismatch)
A leak in the sampling system or around the ET tube
The format for reported end-
tidal CO2 can be classified as
1. Quantitative (an actual numeric value) OR
usually can be displayed in units of mmHg, % or kPa
2. Qualitative (low, medium, high):
usually present as a bar graph,
while colorimetric devices are
presented in a percentage range
grouped by color
Capnography (cont)
How does it work?
CO2 : 2 dissimilar atoms absorbs infrared radiation
with wavelength of 4.3 mm
Infrared lamp = stable source
IR absorption number of CO2 molecules in chamber
Remaining infrared radiation falls on thermopile detector
which produces heat
→ converted to an electrical output to produce a waveform
Converted to real time waveform (note delay due to sampling
time)
Components
1. sampling chamber
A main-stream version
positioned within the patient’s gas stream
B. side-stream version
Connected to the distal end of the breathing system
2. A photodetector
measures light reaching it from a light source after
passing through two chambers.
One acts as a reference whereas the other one is the
sampling chamber
Components
side-stream or main-stream analysers
SpO₂ and EtCO₂
• Oxygen Saturation
• Reflects Oxygenation
• SpO2 changes lag when
patient is hypoventilating or
apneic
• Should be used with
Capnography
• Carbon Dioxide
• Reflects Ventilation
• Hypoventilation/Apnea
detected immediately
• Should be used with pulse
Oximetry
Pulse Oximetry Capnography
Why Use Capnography?
Verify and document ET tube placement
Immediately detect changes in ET tube position
Assess effectiveness of chest compressions
Earliest indication of ROSC
Indicator of probability of successful resuscitation
Optimally adjust manual ventilations in patients
sensitive to changes in CO2
Ventilation- Rate and gas exchange
Minute ventilation- Total volume of gas entering
lungs per minute
Alveolar Ventilation- Volume of gas that reaches
the alveoli
Dead Space Ventilation- Volume of gas that does
not reach the respiratory portions ( 150 ml)
The Capnography
• Monitors changes in
Ventilation - asthma, COPD, airway edema,
foreign body, stroke
Diffusion - pulmonary edema, alveolar damage,
CO poisoning, smoke inhalation
Perfusion - shock, pulmonary embolus, cardiac
arrest, severe dysrhythmias
Capnography
Capnogram Waveform
Phase Termed Variables Gas from
phase I A→B Baseline A = completion of inspiration Large airways
Oropharynx
nasopharynx
B = beginning of expiration
phase II B→C Expiratory
upstroke
C = slowing of exhaled flow Intermediate airways mixes with
phase I air
phase III C→D Alveolar plateau D = end expiration = ETCO2 Mixed gas displaced by alveolar
gas
phase IV D→E Inspiratory
downstroke
E= end inspiration Inspiratory gas has little CO2
Capnographic Waveform
Capnography detects only CO2
from ventilation
No CO2 present during inspiration
Baseline is normally zero
A B
C D
E
Baseline
There is no carbon dioxide at the beginning of
exhalation. The air is from the trachea, mouth
and nose.
This upper airway area is often called “dead
space” because there is no gas exchange in
the upper airway.
An extension of the airway such as an ET tube,
expands the “dead space”.
Gas flow
Capnogram Phase I
Baseline
Beginning of exhalation
A
B
IBaseline
Capnogram Phase one
 the ending of inhalation and the beginning
of exhalation.
This baseline is normally at zero and shows
the amount of carbon dioxide in the dead
space.
Capnogram Phase II (Ascending Phase)
carbon dioxide from the alveoli begins to
reach the upper airway and mix with the
dead space air.
This causes a rapid rise in the amount of CO2
that is now detected in exhaled air.
Capnogram Phase II
Ascending Phase
A B
Ascending Phase
Early Exhalation
II
C
Capnogram Phase III (Alveolar Plateau)
 The carbon dioxide from the alveoli has reached
the airway exit. The exhaled air is now rich in CO2.
In normal ventilation of health lungs, the
concentration of CO2 in the air is uniform.
the alveolar plateau is flat with a slight upward tilt
this shows uniform concentration of carbon
dioxide in the pulmonary system.
Phase III cont..
The end of phase three is also the end of
exhalation.
 Termination of the breath cycle contains the
highest concentration of CO2 and is labeled the
“end-tidal CO2”.
This is the number seen on the monitor.
Normal EtCO2 is 35-45mmHg.
Capnogram Phase IV(Descending Phase)
Shows the beginning of the next inhalation.
 Oxygen fills the airway and the carbon dioxide
level quickly drops to the baseline.
Capnography Waveform
Normal range is 35-45mm Hg.
Normal Waveform
45
0
Possible causes to Decreasing EtCO2 level
Increase in respiratory rate (hyperventilation)
 Increase in tidal volume (hyperventilation)
 Decrease in metabolic rate
 Fall in body temperature
Rebreathing
Obstruction in breathing circuit or airway
Possible causes to increases EtCO2
Decrease in respiratory rate (hypoventilation)
 Decrease in tidal volume (hypoventilation)
Increase in metabolic rate
 Rapid rise in body temperature (malignant
hyperthermia)
How would your capnogram change if you
intentionally started to breathe at a rate of 40?
Frequency
Duration
Height
Shape
1. Rate: increased frequency of waveforms
2. Duration: the waveform cycle shortens
3. Amount: the peak or height of the plateau will
lower as the CO2 is blown off
4. The shape of the waveform should remain in the
normal box-like pattern.
45
0
Hyperventilation
RR : EtCO2
455
0
Normal
Hyperventilation
In the normal metabolic state
hyperventilation is seen as the increase RR
leads to a depletion of CO2 in the exhaled air
When would a rapid RR not show a decline in
EtCO2?
• Metabolic states in which there is
hyperventilation and high production of
carbon dioxide such as fever, DKA, etc.
EtCO2
would a slow RR not show an increase in EtCO2?
• In Slow metabolic states in which there is a lower
production of carbon dioxide such as severe
hypothermia.
 ETCO2 underestimates PaCO2 due to deadspace ventilation
Hypoventilation
RR : EtCO2
Normal
Hypoventilation
• When would a slow RR not show an increase in
EtCO2?
• In Slow metabolic states in which there is a lower
production of carbon dioxide such as severe
hypothermia.
Bronchospasm Waveform Pattern
45
0
Normal
Bronchospasm
Bronchospasm
In an asthma attack, the alveoli are unevenly filled
on inspiration and empty asynchronously during
expiration.
The waveform often referred to as the “shark fin”.
Shark Fin
Asthmatic Waveforms
COPD patients have a difficult time exhaling gases
This is represented on the capnogram by a shark fin appearance
Factors that affect CO2 levels:
INCREASE IN ETCO2 DECREASE IN ETCO2
Increased muscular activity Decreased muscular activity
Increased cardiac output Decreased cardiac output
Exhausted Sodalime Bronchospasm
Hypoventilation Hyperventilation
Malfunctioning exhalation valve Circuit leak or partial obstruction
Decreased minute ventilation Hypothermia
Bicarbonate infusion Poor sampling technique
Tourniquet release Pulmonary embolism
drug therapy for bronchospasm
Increased minute ventilation
A capnogram that does not touch the baseline is
indicative of a patient who is rebreathing CO2
through insufficient inspiratory or expiratory flow.
Rebreathing
A capnogram that does not touch the baseline is indicative of a patient
who is rebreathing CO2 through insufficient inspiratory or expiratory flow
What does this wave show?
Abnormalities
• Sudden  in ETCO₂ to 0
 Dislodged tube
 Vent malfunction
 ET obstruction
• Sudden  in ETCO ₂
 Partial obstruction
 Air leak
• Exponential  in ETCO ₂
 Severe hyperventilation
 Cardiopulmonary event
Abnormalities
• Gradual 
– Hyperventilation
– Decreasing temp
– Gradual  in volume
• Sudden increase in
ETCO₂
– Release of limb
• Gradual increase
– Fever
– Hypoventilation
• Increased baseline
– Rebreathing
– Exhausted CO2
absorber
•What is a Curare Cleft?
#1
• Normal capnogram
 controlled ventilati
#5
• Bronchospasm
#7
• Esophageal intubation
#9
• Rebreathing
#10
• Flat line/Disconnection
Low EtCO₂
• Indicates CO2 deficiency
 Hyperventilation
 Decreased pulmonary perfusion
 Hypothermia
 Decreased metabolism
• Interventions
Adjust ventilation rate
Evaluate for adequate sedation
Evaluate anxiety
Conserve body heat
High EtCO₂
• Indicates increase in ETCO2
 Hypoventilation
 Respiratory depressant drugs
 Increased metabolism
 Fever, pain, shivering
• Interventions
 Adjust ventilation rate
 Decrease respiratory depressant drug dosages
 Assess pain management
 Conserve body heat
Recap
Phase I Inspiration ends and exhalation begins, dead
space air is eliminated first, no CO2 is present.
Phase II Alveolar air begins to mix with dead space air,
a sharp upstroke is produced.
Phase III Alveolar air predominates and the CO2 level
plateaus as the exhalation continues.
 The EtCO2 is noted at the end of exhalation
 Normal range is 35-45mmHg (5% vol)
Phase IV Inspiration occurs, CO2 level quickly
returns to baseline.
Normal baseline is at zero.
The pattern repeats with each breath.
DEFINETION
• Hypoxia is O2 deficiency at the tissue level.
• A pathological condition in which the whole body
as a whole or a region of the body is deprived of
adequate oxygen supply.
• It is the decrease below normal levels of oxygen in
inspired gases, arterial blood, or tissues, without
reaching anoxia.
CAUSES OF HYPOXIA
High altitude.
Low hemoglobin level.
Decreased oxygen supply to an area.
Low oxygen carrying capacity.
Poor tissue perfusion.
Impaired ventilation.
Decreased diffusion of oxygen.
TYPES
1. Hypoxic hypoxia
2. Anemic hypoxia
3. Stagnant hypoxia
4. Histotoxic hypoxia.
Hypoxic hypoxia
SYNONYMS
Hypoxemic hypoxia OR Arterial hypoxia
 DEFINITION: Hypoxic hypoxia is a result of
insufficient oxygen available to the lungs or
decreased oxygen tension
CHARACTERI STICS
Low arterial pO2 .
Low arterial O2 content.
Low arterial % O2 saturation of hemoglobin.
Low A-V pO2 difference
Major causes of Hypoxic hypoxia
1. Low oxygen tension in inspired air.
2. Respiratory disorders associated with
decreased pulmonary ventilation.
3. Respiratory disorders associated with
inadequate oxygenation of blood in lungs.
4. Cardiac disorders
CAUSE
Low oxygen tension in inspired air
High altitude.
Breathing in closed space.
Breathing gas mixture containing low pO2
CAUSE
Respiratory disorders associated with decreased
pulmonary ventilation.
Asthma.
Brain tumor.
Sleep apnoea.
Pneumothorax.
Bulbar poliomyelitis
CAUSE
Respiratory disorders associated with
inadequate oxygenation of blood in lungs.
Emphysema.
Fibrosis.
Pulmonary hemorrhage.
Pneumonia.
Bronchiolar obstruction.
Bronchiectasis.
CAUSE
Cardiac disorders.
Congestive heart failure.
Low cardiac output
Hypoxic hypoxia is characterized by reduced
oxygen tension in arterial blood while all the
other features are normal.
• Hypoxia in which arterial pO2 is normal but
the amount of haemoglobin available to carry
oxygen is reduced.
Anemic hypoxia
• CAUSE
Decreased no. of RBCs
Decreased haemoglobin content in blood
Formation of altered haemoglobin
Combination of haemoglobin with gases other than
O2 and CO2
• Anemic hypoxia is characterized by low
oxygen carrying capacity of blood while the
other features remain normal.
• Stagnant /Ischaemic
hypoxia
• Hypoxia in which the blood flow to the tissues
is so low or slow that adequate oxygen is not
delivered to them despite a normal arterial pO2.
• Congestive cardiacfailure.
• Hemorrhage.
• Surgical stroke.
• Vasospasm.
• Thrombosis.
• Embolism.
• Stagnant hypoxia is characterized by
decreased velocity of blood flow while the
other features remain normal.
o Hypoxia in which the amount of oxygen
delivered to the tissues is adequate , but
because of the action of a toxic agent the
tissue cells cannot make use of the oxygen
supplied to them.
o Cyanide poisoning:
Cyanide destroys the cellular oxidative
enzymes completely paralyzing the
cytochrome oxidase system.
TYPES OF
HYPOXIAS
ARTERIALpO2
HEMOGLOBIN
COUNT
RATE OF
BLOOD FLOW
TO TISSUES
Hypoxic
hypoxia
Decreases Normal Normal
Anemic
hypoxia
Normal Decreases Normal
Stagnant
hypoxia
Normal Normal Decreases
Histotoxic
hypoxia
Normal Normal Normal
TYPES OF
HYPOXIAS
CAUSES
• Hypoxic hypoxia
•Anemic hypoxia
Stagnant hypoxia
Histotoxic hypoxia
• Decreases inspired pO2;
decreased pulmonary
ventilation ; defective V/P ratio
• Total Hb content decreases due
to anemia;
• haemorrhage; presence of
abnormal Hb
• Circulatory failure;
haemorrhage; heart failure
• Cyanide poisoning
TYPES OF
HYPOXIA
ARTERIALpO2
ARTERIALO2
CONTENT
ARTERIAL % -
O2 SATURATION
OF
HEMOGLOBIN
Hypoxic
hypoxia
Decreased Decreases Decreases
Anemic
hypoxia
Normal Markedly
reduced
Decreases
Stagnant
hypoxia
Normal Normal Normal
Histotoxic
hypoxia
Normal Normal Normal
TYPES OF
HYPOXIA
A-V PO2
DIFFERENCE
CYANOSIS STIMULATION
OF
PERIPHERAL
CHEMORECEP
TORS
Hypoxic
hypoxia
Decreases Present Present
Anemic
hypoxia
Normal Absent Absent
Stagnant
hypoxia
More than
normal
Present Present
Histotoxic
hypoxia
Less than
normal
Absent Present
• Anemic hypoxia is characterized by low
oxygen carrying capacity of blood while the
other features remain normal.
• Ischaemic hypoxia.
• Hypoxia in which the blood flow to the tissues
is so low or slow that adequate oxygen is not
delivered to them despite a normal arterial pO2.
• Congestive cardiacfailure.
• Hemorrhage.
• Surgical stroke.
• Vasospasm.
• Thrombosis.
• Embolism.
• Stagnant hypoxia is characterized by
decreased velocity of blood flow while the
other features remain normal.
o Hypoxia in which the amount of oxygen
delivered to the tissues is adequate , but
because of the action of a toxic agent the
tissue cells cannot make use of the oxygen
supplied to them.
o Cyanide poisoning:
Cyanide destroys the cellular oxidative
enzymes completely paralyzing the
cytochrome oxidase system.
TYPES OF
HYPOXIAS
ARTERIALpO2
HEMOGLOBIN
COUNT
RATE OF
BLOOD FLOW
TO TISSUES
Hypoxic
hypoxia
Decreases Normal Normal
Anemic
hypoxia
Normal Decreases Normal
Stagnant
hypoxia
Normal Normal Decreases
Histotoxic
hypoxia
Normal Normal Normal
TYPES OF
HYPOXIAS
CAUSES
• Hypoxic hypoxia
•Anemic hypoxia Stagnant
hypoxia Histotoxic hypoxia
• Decreases inspired
pO2; decreased
pulmonary
ventilation ;
defective V/P ratio
• Total Hb content
decreases due to
anemia;
• haemorrhage;
TYPES OF
HYPOXIA
ARTERIALpO2
ARTERIALO2
CONTENT
ARTERIAL % -
O2 SATURATION
OF
HEMOGLOBIN
Hypoxic
hypoxia
Decreased Decreases Decreases
Anemic
hypoxia
Normal Markedly
reduced
Decreases
Stagnant
hypoxia
Normal Normal Normal
Histotoxic
hypoxia
Normal Normal Normal
TYPES OF
HYPOXIA
A-V PO2
DIFFERENCE
CYANOSIS STIMULATION
OF
PERIPHERAL
CHEMORECEP
TORS
Hypoxic
hypoxia
Decreases Present Present
Anemic
hypoxia
Normal Absent Absent
Stagnant
hypoxia
More than
normal
Present Present
Histotoxic
hypoxia
Less than
normal
Absent Present
Stagnant /Ischaemic hypoxia
• DEFINITION
Hypoxia in which the blood flow to the tissues is
so low or slow that adequate oxygen is not
delivered to them despite a normal arterial pO2

Capnography

  • 1.
  • 2.
    Learning Objectives by theend of this section the students able to • Differentiate between oxygenation and ventilation • Define end-tidal CO2 • Identify phases of a normal capnogram • Recognize patterns abnormal capnogram
  • 3.
    Physiologic aspects andthe need for capnography Respiration The respiratory process consists of three main events: 1. Cellular metabolism of food into energy—O2 consumption and CO2 production. 2. Transport of O2 and CO2 between cells and pulmonary capillaries, and diffusion from/into alveoli. 3. Ventilation between alveoli and atmosphere INTRODUCTION
  • 4.
  • 5.
    introduction • Oxygenation: Theprocess of getting oxygen into the body and to the tissues for metabolism, is monitored with pulseoximetry. • Ventilation: the process of eliminating CO2 from the body, is monitored with capnography.
  • 6.
    Capnography  Continuous measurementof patient’s inhaled and exhaled [CO2]  Waveform display more informative than the value  Useful for evaluation of – Esophageal intubation – Disconnect in breathing circuit – Rebreathing of CO2 – Cardiac arrest – Malignant Hyperthermia / Thyroid storm – Hypotension – PE  ETCO2 underestimates PaCO2 due to deadspace ventilation
  • 7.
    Capnography- Continuous analysisand recording of Carbon Dioxide concentrations in respiratory gases.( I.E. waveforms and numbers) Capnograph a device that measures CO2 and displays a waveform. Partial pressure (mmHg) or volume (% vol) of CO2 in the airway at the end of exhalation Breath-to-breath measurement provides information within seconds
  • 8.
    -CO2 dilates thecerebral blood vessels increasing ICP by increasing the volume of blood in the intracranial vault Titrating CO2 levels to 30-35 mmHg range in head injured patient can help relieve the untoward effects of raised ICP
  • 9.
     CO₂ playsa role in metabolic, cardiovascular and respiratory systems.  Monitoring CO₂ concentration gives indication of subtle pathological disturbances of metabolic, cardiovascular and respiratory systems.
  • 10.
    Normal arterial andend-tidal CO2 values Arterial CO2 (PaCO2) sample (ABG)  PaCO2values: 35 to 45 mmHg End-tidal CO2 (EtCO2)From capnograh values: 30 to 43 mmHg 4.0 to 5.7 kPa 4.0 to 5.6% Mixed venous blood gas PeCO2 Normal range: 46-48mmHg Generally; ETCO2 < PACO2 < PaCO2
  • 11.
    Arterial to end-tidalCO2 gradient the difference b/n aCO2(from ABG) and ACO2(EtCO2 2 to 5 mmHg. This difference is termed the PaCO2—PEtCO2 gradient or the a—ADCO2 and can be increased by: COPD (causing incomplete alveolar emptying) ARDS(causing V/Q mismatch) A leak in the sampling system or around the ET tube
  • 12.
    The format forreported end- tidal CO2 can be classified as 1. Quantitative (an actual numeric value) OR usually can be displayed in units of mmHg, % or kPa 2. Qualitative (low, medium, high): usually present as a bar graph, while colorimetric devices are presented in a percentage range grouped by color
  • 15.
    Capnography (cont) How doesit work? CO2 : 2 dissimilar atoms absorbs infrared radiation with wavelength of 4.3 mm Infrared lamp = stable source IR absorption number of CO2 molecules in chamber Remaining infrared radiation falls on thermopile detector which produces heat → converted to an electrical output to produce a waveform Converted to real time waveform (note delay due to sampling time)
  • 16.
    Components 1. sampling chamber Amain-stream version positioned within the patient’s gas stream B. side-stream version Connected to the distal end of the breathing system 2. A photodetector measures light reaching it from a light source after passing through two chambers. One acts as a reference whereas the other one is the sampling chamber
  • 17.
  • 18.
  • 19.
    SpO₂ and EtCO₂ •Oxygen Saturation • Reflects Oxygenation • SpO2 changes lag when patient is hypoventilating or apneic • Should be used with Capnography • Carbon Dioxide • Reflects Ventilation • Hypoventilation/Apnea detected immediately • Should be used with pulse Oximetry Pulse Oximetry Capnography
  • 20.
    Why Use Capnography? Verifyand document ET tube placement Immediately detect changes in ET tube position Assess effectiveness of chest compressions Earliest indication of ROSC Indicator of probability of successful resuscitation Optimally adjust manual ventilations in patients sensitive to changes in CO2
  • 21.
    Ventilation- Rate andgas exchange Minute ventilation- Total volume of gas entering lungs per minute Alveolar Ventilation- Volume of gas that reaches the alveoli Dead Space Ventilation- Volume of gas that does not reach the respiratory portions ( 150 ml)
  • 22.
    The Capnography • Monitorschanges in Ventilation - asthma, COPD, airway edema, foreign body, stroke Diffusion - pulmonary edema, alveolar damage, CO poisoning, smoke inhalation Perfusion - shock, pulmonary embolus, cardiac arrest, severe dysrhythmias
  • 23.
  • 25.
    Capnogram Waveform Phase TermedVariables Gas from phase I A→B Baseline A = completion of inspiration Large airways Oropharynx nasopharynx B = beginning of expiration phase II B→C Expiratory upstroke C = slowing of exhaled flow Intermediate airways mixes with phase I air phase III C→D Alveolar plateau D = end expiration = ETCO2 Mixed gas displaced by alveolar gas phase IV D→E Inspiratory downstroke E= end inspiration Inspiratory gas has little CO2
  • 26.
    Capnographic Waveform Capnography detectsonly CO2 from ventilation No CO2 present during inspiration Baseline is normally zero A B C D E Baseline
  • 27.
    There is nocarbon dioxide at the beginning of exhalation. The air is from the trachea, mouth and nose. This upper airway area is often called “dead space” because there is no gas exchange in the upper airway. An extension of the airway such as an ET tube, expands the “dead space”.
  • 28.
  • 29.
    Capnogram Phase I Baseline Beginningof exhalation A B IBaseline
  • 30.
    Capnogram Phase one the ending of inhalation and the beginning of exhalation. This baseline is normally at zero and shows the amount of carbon dioxide in the dead space.
  • 31.
    Capnogram Phase II(Ascending Phase) carbon dioxide from the alveoli begins to reach the upper airway and mix with the dead space air. This causes a rapid rise in the amount of CO2 that is now detected in exhaled air.
  • 32.
    Capnogram Phase II AscendingPhase A B Ascending Phase Early Exhalation II C
  • 33.
    Capnogram Phase III(Alveolar Plateau)  The carbon dioxide from the alveoli has reached the airway exit. The exhaled air is now rich in CO2. In normal ventilation of health lungs, the concentration of CO2 in the air is uniform. the alveolar plateau is flat with a slight upward tilt this shows uniform concentration of carbon dioxide in the pulmonary system.
  • 34.
    Phase III cont.. Theend of phase three is also the end of exhalation.  Termination of the breath cycle contains the highest concentration of CO2 and is labeled the “end-tidal CO2”. This is the number seen on the monitor. Normal EtCO2 is 35-45mmHg.
  • 35.
    Capnogram Phase IV(DescendingPhase) Shows the beginning of the next inhalation.  Oxygen fills the airway and the carbon dioxide level quickly drops to the baseline.
  • 36.
    Capnography Waveform Normal rangeis 35-45mm Hg. Normal Waveform 45 0
  • 37.
    Possible causes toDecreasing EtCO2 level Increase in respiratory rate (hyperventilation)  Increase in tidal volume (hyperventilation)  Decrease in metabolic rate  Fall in body temperature Rebreathing Obstruction in breathing circuit or airway
  • 38.
    Possible causes toincreases EtCO2 Decrease in respiratory rate (hypoventilation)  Decrease in tidal volume (hypoventilation) Increase in metabolic rate  Rapid rise in body temperature (malignant hyperthermia)
  • 39.
    How would yourcapnogram change if you intentionally started to breathe at a rate of 40? Frequency Duration Height Shape
  • 40.
    1. Rate: increasedfrequency of waveforms 2. Duration: the waveform cycle shortens 3. Amount: the peak or height of the plateau will lower as the CO2 is blown off 4. The shape of the waveform should remain in the normal box-like pattern.
  • 41.
  • 42.
    In the normalmetabolic state hyperventilation is seen as the increase RR leads to a depletion of CO2 in the exhaled air When would a rapid RR not show a decline in EtCO2? • Metabolic states in which there is hyperventilation and high production of carbon dioxide such as fever, DKA, etc.
  • 43.
    EtCO2 would a slowRR not show an increase in EtCO2? • In Slow metabolic states in which there is a lower production of carbon dioxide such as severe hypothermia.  ETCO2 underestimates PaCO2 due to deadspace ventilation
  • 44.
  • 45.
    • When woulda slow RR not show an increase in EtCO2? • In Slow metabolic states in which there is a lower production of carbon dioxide such as severe hypothermia.
  • 46.
  • 47.
    Bronchospasm In an asthmaattack, the alveoli are unevenly filled on inspiration and empty asynchronously during expiration. The waveform often referred to as the “shark fin”.
  • 48.
    Shark Fin Asthmatic Waveforms COPDpatients have a difficult time exhaling gases This is represented on the capnogram by a shark fin appearance
  • 49.
    Factors that affectCO2 levels: INCREASE IN ETCO2 DECREASE IN ETCO2 Increased muscular activity Decreased muscular activity Increased cardiac output Decreased cardiac output Exhausted Sodalime Bronchospasm Hypoventilation Hyperventilation Malfunctioning exhalation valve Circuit leak or partial obstruction Decreased minute ventilation Hypothermia Bicarbonate infusion Poor sampling technique Tourniquet release Pulmonary embolism drug therapy for bronchospasm Increased minute ventilation
  • 50.
    A capnogram thatdoes not touch the baseline is indicative of a patient who is rebreathing CO2 through insufficient inspiratory or expiratory flow.
  • 51.
    Rebreathing A capnogram thatdoes not touch the baseline is indicative of a patient who is rebreathing CO2 through insufficient inspiratory or expiratory flow
  • 52.
    What does thiswave show?
  • 53.
    Abnormalities • Sudden in ETCO₂ to 0  Dislodged tube  Vent malfunction  ET obstruction • Sudden  in ETCO ₂  Partial obstruction  Air leak • Exponential  in ETCO ₂  Severe hyperventilation  Cardiopulmonary event
  • 54.
    Abnormalities • Gradual  –Hyperventilation – Decreasing temp – Gradual  in volume • Sudden increase in ETCO₂ – Release of limb • Gradual increase – Fever – Hypoventilation • Increased baseline – Rebreathing – Exhausted CO2 absorber
  • 55.
    •What is aCurare Cleft?
  • 62.
    #1 • Normal capnogram controlled ventilati
  • 63.
  • 64.
  • 65.
  • 66.
  • 67.
    Low EtCO₂ • IndicatesCO2 deficiency  Hyperventilation  Decreased pulmonary perfusion  Hypothermia  Decreased metabolism • Interventions Adjust ventilation rate Evaluate for adequate sedation Evaluate anxiety Conserve body heat
  • 68.
    High EtCO₂ • Indicatesincrease in ETCO2  Hypoventilation  Respiratory depressant drugs  Increased metabolism  Fever, pain, shivering • Interventions  Adjust ventilation rate  Decrease respiratory depressant drug dosages  Assess pain management  Conserve body heat
  • 69.
    Recap Phase I Inspirationends and exhalation begins, dead space air is eliminated first, no CO2 is present. Phase II Alveolar air begins to mix with dead space air, a sharp upstroke is produced. Phase III Alveolar air predominates and the CO2 level plateaus as the exhalation continues.  The EtCO2 is noted at the end of exhalation  Normal range is 35-45mmHg (5% vol)
  • 70.
    Phase IV Inspirationoccurs, CO2 level quickly returns to baseline. Normal baseline is at zero. The pattern repeats with each breath.
  • 72.
    DEFINETION • Hypoxia isO2 deficiency at the tissue level. • A pathological condition in which the whole body as a whole or a region of the body is deprived of adequate oxygen supply. • It is the decrease below normal levels of oxygen in inspired gases, arterial blood, or tissues, without reaching anoxia.
  • 73.
    CAUSES OF HYPOXIA Highaltitude. Low hemoglobin level. Decreased oxygen supply to an area. Low oxygen carrying capacity. Poor tissue perfusion. Impaired ventilation. Decreased diffusion of oxygen.
  • 74.
    TYPES 1. Hypoxic hypoxia 2.Anemic hypoxia 3. Stagnant hypoxia 4. Histotoxic hypoxia.
  • 75.
    Hypoxic hypoxia SYNONYMS Hypoxemic hypoxiaOR Arterial hypoxia  DEFINITION: Hypoxic hypoxia is a result of insufficient oxygen available to the lungs or decreased oxygen tension
  • 76.
    CHARACTERI STICS Low arterialpO2 . Low arterial O2 content. Low arterial % O2 saturation of hemoglobin. Low A-V pO2 difference
  • 77.
    Major causes ofHypoxic hypoxia 1. Low oxygen tension in inspired air. 2. Respiratory disorders associated with decreased pulmonary ventilation. 3. Respiratory disorders associated with inadequate oxygenation of blood in lungs. 4. Cardiac disorders
  • 78.
    CAUSE Low oxygen tensionin inspired air High altitude. Breathing in closed space. Breathing gas mixture containing low pO2
  • 79.
    CAUSE Respiratory disorders associatedwith decreased pulmonary ventilation. Asthma. Brain tumor. Sleep apnoea. Pneumothorax. Bulbar poliomyelitis
  • 80.
    CAUSE Respiratory disorders associatedwith inadequate oxygenation of blood in lungs. Emphysema. Fibrosis. Pulmonary hemorrhage. Pneumonia. Bronchiolar obstruction. Bronchiectasis.
  • 81.
    CAUSE Cardiac disorders. Congestive heartfailure. Low cardiac output Hypoxic hypoxia is characterized by reduced oxygen tension in arterial blood while all the other features are normal.
  • 83.
    • Hypoxia inwhich arterial pO2 is normal but the amount of haemoglobin available to carry oxygen is reduced.
  • 84.
    Anemic hypoxia • CAUSE Decreasedno. of RBCs Decreased haemoglobin content in blood Formation of altered haemoglobin Combination of haemoglobin with gases other than O2 and CO2
  • 85.
    • Anemic hypoxiais characterized by low oxygen carrying capacity of blood while the other features remain normal.
  • 86.
    • Stagnant /Ischaemic hypoxia •Hypoxia in which the blood flow to the tissues is so low or slow that adequate oxygen is not delivered to them despite a normal arterial pO2.
  • 87.
    • Congestive cardiacfailure. •Hemorrhage. • Surgical stroke. • Vasospasm. • Thrombosis. • Embolism.
  • 88.
    • Stagnant hypoxiais characterized by decreased velocity of blood flow while the other features remain normal.
  • 90.
    o Hypoxia inwhich the amount of oxygen delivered to the tissues is adequate , but because of the action of a toxic agent the tissue cells cannot make use of the oxygen supplied to them.
  • 91.
    o Cyanide poisoning: Cyanidedestroys the cellular oxidative enzymes completely paralyzing the cytochrome oxidase system.
  • 93.
    TYPES OF HYPOXIAS ARTERIALpO2 HEMOGLOBIN COUNT RATE OF BLOODFLOW TO TISSUES Hypoxic hypoxia Decreases Normal Normal Anemic hypoxia Normal Decreases Normal Stagnant hypoxia Normal Normal Decreases Histotoxic hypoxia Normal Normal Normal
  • 94.
    TYPES OF HYPOXIAS CAUSES • Hypoxichypoxia •Anemic hypoxia Stagnant hypoxia Histotoxic hypoxia • Decreases inspired pO2; decreased pulmonary ventilation ; defective V/P ratio • Total Hb content decreases due to anemia; • haemorrhage; presence of abnormal Hb • Circulatory failure; haemorrhage; heart failure • Cyanide poisoning
  • 95.
    TYPES OF HYPOXIA ARTERIALpO2 ARTERIALO2 CONTENT ARTERIAL %- O2 SATURATION OF HEMOGLOBIN Hypoxic hypoxia Decreased Decreases Decreases Anemic hypoxia Normal Markedly reduced Decreases Stagnant hypoxia Normal Normal Normal Histotoxic hypoxia Normal Normal Normal
  • 96.
    TYPES OF HYPOXIA A-V PO2 DIFFERENCE CYANOSISSTIMULATION OF PERIPHERAL CHEMORECEP TORS Hypoxic hypoxia Decreases Present Present Anemic hypoxia Normal Absent Absent Stagnant hypoxia More than normal Present Present Histotoxic hypoxia Less than normal Absent Present
  • 97.
    • Anemic hypoxiais characterized by low oxygen carrying capacity of blood while the other features remain normal.
  • 98.
    • Ischaemic hypoxia. •Hypoxia in which the blood flow to the tissues is so low or slow that adequate oxygen is not delivered to them despite a normal arterial pO2.
  • 99.
    • Congestive cardiacfailure. •Hemorrhage. • Surgical stroke. • Vasospasm. • Thrombosis. • Embolism.
  • 100.
    • Stagnant hypoxiais characterized by decreased velocity of blood flow while the other features remain normal.
  • 102.
    o Hypoxia inwhich the amount of oxygen delivered to the tissues is adequate , but because of the action of a toxic agent the tissue cells cannot make use of the oxygen supplied to them.
  • 103.
    o Cyanide poisoning: Cyanidedestroys the cellular oxidative enzymes completely paralyzing the cytochrome oxidase system.
  • 105.
    TYPES OF HYPOXIAS ARTERIALpO2 HEMOGLOBIN COUNT RATE OF BLOODFLOW TO TISSUES Hypoxic hypoxia Decreases Normal Normal Anemic hypoxia Normal Decreases Normal Stagnant hypoxia Normal Normal Decreases Histotoxic hypoxia Normal Normal Normal
  • 106.
    TYPES OF HYPOXIAS CAUSES • Hypoxichypoxia •Anemic hypoxia Stagnant hypoxia Histotoxic hypoxia • Decreases inspired pO2; decreased pulmonary ventilation ; defective V/P ratio • Total Hb content decreases due to anemia; • haemorrhage;
  • 107.
    TYPES OF HYPOXIA ARTERIALpO2 ARTERIALO2 CONTENT ARTERIAL %- O2 SATURATION OF HEMOGLOBIN Hypoxic hypoxia Decreased Decreases Decreases Anemic hypoxia Normal Markedly reduced Decreases Stagnant hypoxia Normal Normal Normal Histotoxic hypoxia Normal Normal Normal
  • 108.
    TYPES OF HYPOXIA A-V PO2 DIFFERENCE CYANOSISSTIMULATION OF PERIPHERAL CHEMORECEP TORS Hypoxic hypoxia Decreases Present Present Anemic hypoxia Normal Absent Absent Stagnant hypoxia More than normal Present Present Histotoxic hypoxia Less than normal Absent Present
  • 109.
    Stagnant /Ischaemic hypoxia •DEFINITION Hypoxia in which the blood flow to the tissues is so low or slow that adequate oxygen is not delivered to them despite a normal arterial pO2