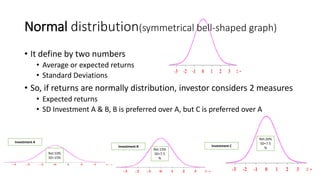
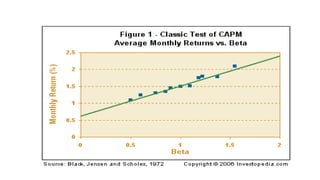
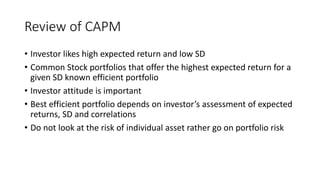
The document is a lecture on the Capital Asset Pricing Model (CAPM), which assesses the relationship between systematic risk (beta) and expected returns on assets. It outlines key concepts such as the calculation of beta, expected return factors, the distinction between systematic and unsystematic risk, and empirical tests of CAPM assumptions. Additionally, it discusses limitations of CAPM and introduces the Arbitrage Pricing Theory (APT) as an alternative asset pricing model.


![CHAPTER 9 – The Capital Asset
Pricing Model (CAPM)
9 - 37
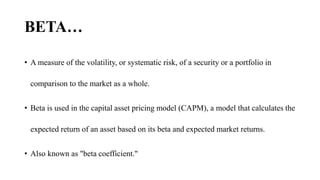
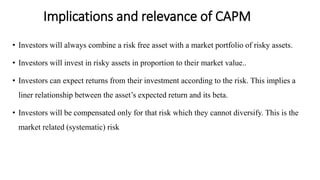
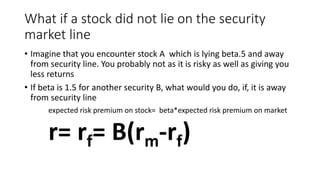
Alternative Asset Pricing Models
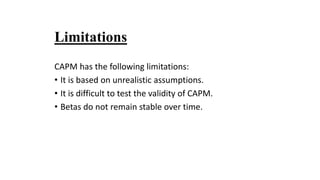
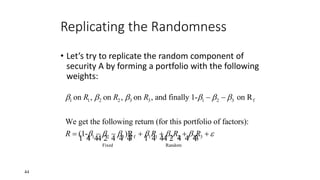
The Arbitrage Pricing Theory – the Model
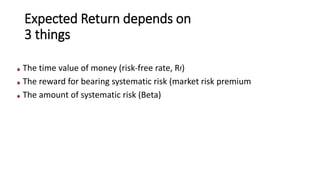
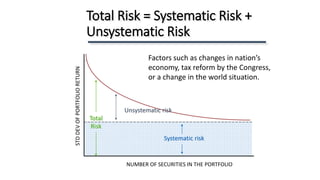
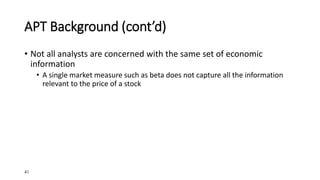
• Underlying factors represent broad economic forces which are inherently
unpredictable.
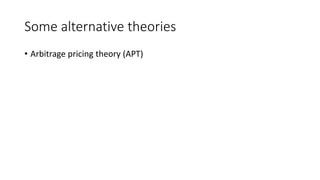
• Where:
• ERi = the expected return on security i
• a0 = the expected return on a security with zero systematic risk
• bi = the sensitivity of security i to a given risk factor
• Fi = the risk premium for a given risk factor
• The model demonstrates that a security’s risk is based on its sensitivity to
broad economic forces.
...11110 niniii FbFbFbaER [9-10]](https://image.slidesharecdn.com/capmlec6-160516194219/85/Capital-Asset-pricing-model-lec6-37-320.jpg)
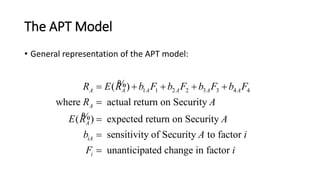
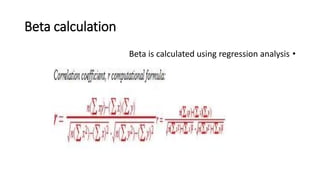
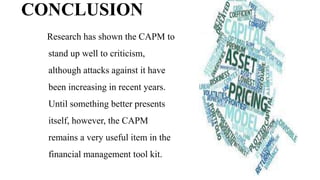
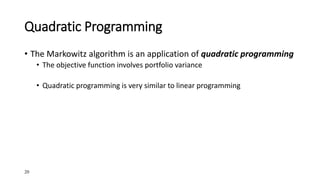
![APT
1 1 2 2 3 3
1 1 1 2 2 2 3 3 3
1 1 2 2 3 3 1 1 2 2 3 3
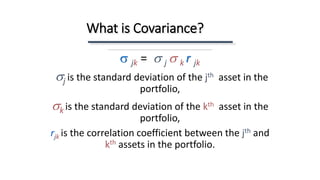
Fixed Random
(Notice that the security index "A" has been ign
( )
( ) [ ( )] [ ( )] [ ( )]
( ) ( ) ( ) ( )
R E R F F F
R E R R E R R E R R E R
R E R E R E R E R R R R
1 4 4 4 4 4 4 2 4 4 4 4 4 4 3 1 4 44 2 4 4 43
ored for clarity purposes)](https://image.slidesharecdn.com/capmlec6-160516194219/85/Capital-Asset-pricing-model-lec6-43-320.jpg)
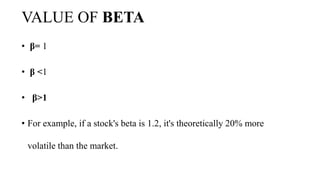
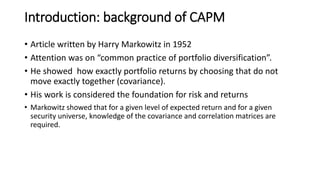
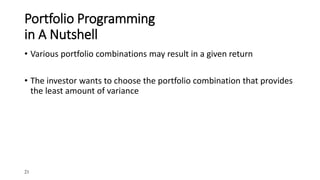
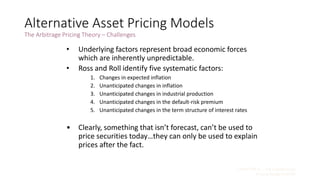
![46
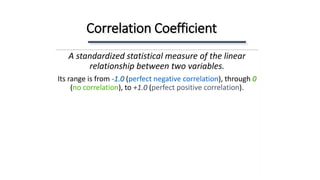
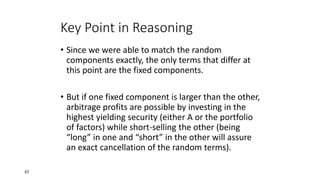
•Therefore the fixed components MUST BE THE
SAME for security A and the portfolio of factors
created, otherwise unlimited profits would be
possible.
So we have:
1 1 2 2 3 3 1 2 3 f
f 1 1 f 2 2 f 2 3 f
( ) ( ) ( ) ( ) (1- )R
Rearranging terms yields:
( ) R [ ( ) R ] [ ( ) R ] [ ( ) R ]
E R E R E R E R
E R E R E R E R
](https://image.slidesharecdn.com/capmlec6-160516194219/85/Capital-Asset-pricing-model-lec6-46-320.jpg)