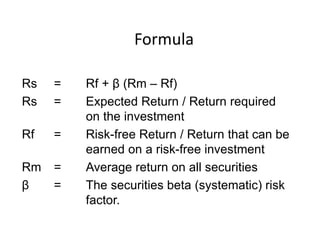
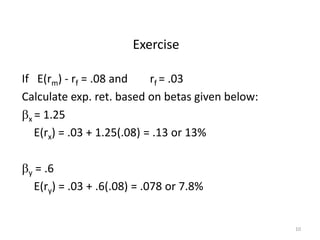
The Capital Asset Pricing Model (CAPM) was developed in the 1960s as a way to determine the expected return of an asset based on its risk. CAPM assumes that investors will be compensated only based on an asset's systematic or non-diversifiable risk as measured by its beta. The model builds on Markowitz's portfolio theory and introduces the security market line, which plots the expected return of an asset against its beta. According to CAPM, the expected return of an asset is equal to the risk-free rate plus a risk premium that is proportional to the asset's beta.
Many investors mistakenly base the success of their portfolios on returns alone. Few consider the risk that they took to achieve those returns. Since the 1960s, investors have known how to quantify and measure risk with the variability of returns, but no single measure actually looked at both risk and return together. Today, we have three sets of performance measurement tools to assist us with our portfolio evaluations. The Treynor, Sharpe and Jensen ratios combine risk and return performance into a single value, but each is slightly different. Which one is best for you? Why should you care? Let's find out.
Portfolio performance measures should be a key aspect of the investment decision process. These tools provide the necessary information for investors to assess how effectively their money has been invested (or may be invested). Remember, portfolio returns are only part of the story. Without evaluating risk-adjusted returns, an investor cannot possibly see the whole investment picture, which may inadvertently lead to clouded investment decisions.
The concept of the Security Market Line is very popular for portfolio management. It helps to derive the pricing of risky securities by plotting their expected returns.
To know more about it, click on the link given below:
https://efinancemanagement.com/investment-decisions/security-market-line
noorulhadi Lecturer at Govt College of Management Sciences, noorulhadi99@yahoo.com
i have prepared these slides and still using in mylectures, Reference: Portfolio management by S kevin and online sources
Modeling Transaction Costs for Algorithmic StrategiesQuantopian
Discussion of this presentation, and custom slippage model for you to test with, can be found at https://www.quantopian.com/posts/custom-slippage-modeling-transaction-costs-for-algorithmic-strategies
If you're interested in learning more about modeling transaction costs, we've scheduled a webinar with Tom for June 26 at 2PM EDT. The webinar will be a Q&A based on this presentation. Bring your modeling questions to the webinar, and Tom will answer any questions you have. Please RSVP at https://attendee.gotowebinar.com/register/3673417022478449920 .
Trade negotiations of the Transatlantic Trade and Investment Partnership (TTIP) and The Trans-Pacific Partnership (TTP) trade deals have provided more fuel to the fire of this ongoing debate.
This revision presentation explains and illustrates the concept of protectionism. The presentation explains the factors that motivate protectionism and the methods employed, including tariffs, import duties, dumping, currency manipulation and the favouring of domestic firms and industries.
Is your presentation in need of a professional makeover? Looking to leave your audience with a lasting impression and take your presentation to the next level?
Here is what you were looking for!
This is Shahan from Bangladesh. As a designer, I have extensive graphic design experience. I can assist you with creating an eye-catching, professional, and modern presentation.
There are no limits to my services. Having 100% client satisfaction is my main goal.
Order now https://www.fiverr.com/shahan_66/design-and-redesign-a-modern-powerpoint-presentation
The Capital Asset Pricing Model (CAPM) measures the relationship between the expected return and the risk of investing in security.
This model is used to analyze securities and price them given the expected rate of return and cost of capital involved.
what do you want to do is you can do, if only you are willing to do....right? business it not only for our own selves, but also for everybody good also.
Portfolio Investment can be understood easily.Sonam704174
Portfolio Investment can be understood as a bunch of different financial securities (including assets, stocks, government bonds, corporate bonds, mutual funds, other money market instruments, cash and cash equivalents, cryptocurrencies, commodities, and bank certificates of deposit.), bought with an expectation to gain either in the form of return or increased value, or both.
1. Capital Asset Pricing Model (CAPM)
CAPM originally depends on the theory which was
demonstrated by
Markowitz’s portfolio selection model (1952)
In Markowitz’s model, an investor selects a
portfolio at time t _ 1 that produces a stochastic
return at t.
The model assumes investors are risk averse and,
when choosing among portfolios, they care only
about the mean and variance of their one-period
investment return.
2. Introduction
• The Capital Asset Pricing Model (CAPM) was
developed independently by
• William Sharp (1964)
• John Lintner (1965) and
• Mossin (1966)
• Sharpe and Lintner add two key assumptions
• The first assumption is complete agreement: given
market clearing asset prices at t _ 1, investors agree on
the joint distribution of asset returns from t _ 1 to t.
• The second assumption is that there is borrowing and
lending at a risk-free rate
3. Basic Concepts
• If we know risk, then we can find the appropriate
cost of capital.
• If we know cost of capital, then we can find the
NPV of a project.
• If we know NPV, then we can find the value of a
project.
• If firm choose the best projects according to their
returns and risks, there will be benefits from the
improvements in financial decision making.
4. An Overview
Capital asset pricing model (CAPM) will allow you to
determine the required rate of return for any risky
asset
Three inputs are needed for CAPM.
The risk-free rate of return
The expected market rate of return
The market beta
Assets with lower risk have lower expected returns.
Assets with higher risk have higher expected returns.
5. What is Risk?
• Investment risk is defined as the probability of
occurrence of losses relative to the expected
return on any particular investment.
• Simply we can say, the possibility that
investors will lose money when they invest in
an asset.
• Total Risk = Systematic Risk + Unsystematic
Risk
6. It cannot be eliminated through diversification
It can be measured in relation to the risk of
diversified portfolio or the market.
According to CAPM, the Non-Diversifiable
risk of an investment or security or asset is
assessed in terms of the beta co-efficient.
Systematic risk
7. Is that portion of the total risk of an investment
that can be eliminated or minimized through
diversification.
Eg. Management Capabilities and decisions,
unique government regulations, availability of
raw materials, competition, etc.
Unsystematic or Diversifiable Risk
9. Formula
Rs = Rf + β (Rm – Rf)
Rs = Expected Return / Return required
on the investment
Rf = Risk-free Return / Return that can be
earned on a risk-free investment
Rm = Average return on all securities
β = The securities beta (systematic) risk
factor.
10. 10
Exercise
If E(rm) - rf = .08 and rf = .03
Calculate exp. ret. based on betas given below:
bx = 1.25
E(rx) = .03 + 1.25(.08) = .13 or 13%
by = .6
E(ry) = .03 + .6(.08) = .078 or 7.8%
11. BETA
Beta is used in the capital assets pricing model
(CAPM), a model that calculates the expected
return of an asset based on its beta and expected
market returns.
Also known as “beta coefficent.”
Beta is calculated using regression analysis
12. Calculation of Beta
Beat measures non-diversifiable risk
It shows how the price of security responds to
market forces.
In effect, the more responsive the price of a
security is to changes in the market, the higher will
be its beta.
Betas can be positive or negative however, all
betas are positive and most betas lie between 0.4
to 1.9.
13. • CAPM uses beta to viewed both as a
mathematical equation and graphical, as
the security market line (SML)
14. 14
SML and CAPM
• If you show the security market line with
excess returns on the vertical axis, the
equation of the SML is the CAPM
– The intercept is zero
– The slope of the line is beta
15. 15
Security Market Line
• The SML shows the relationship between risk
measured by beta and expected return. The
model states that the stock’s expected return
is equal to the risk-free rate plus a risk
premium obtained by the price of the risk
multiplied by the quantity of the risk.
17. ASSUMPTIONS
Individuals are risk averse.
Can lend and borrow unlimited amounts under the
risk free rate of interest.
Individuals seek to maximize the expected return.
Investors look only over a single period ahead.
Assume all information is available at the same
time to all investors.
18. Investors are price takers, they cannot influence
the market individually.
All investors have homogeneous expectations
about asset returns
The quantity of risky securities in the market
is given
ASSUMPTIONS
19. The market is perfect:
There are no taxes
There are no translation costs
Securities are completely divisible
The market is competitive
There is no inflation or any change in interest rate.
ASSUMPTIONS
20. IMPLECATIONS AND RELEVANCE
Investors will always combine a risk free asset
with a market portfolio of risky assets. Investors
will invest in risky assets in proportion to their
market value.
Investors can expect returns from their investment
according to the risk. This implies a liner
relationship between the asset’s expected return
and its beta.
Investors will be compensated only for that risk
which they cannot diversify. This is the market
related (systematic) risk.
21. LIMITATIONS
CAPM has the following limitations:
It is based on unrealistic assumptions.
People pay taxes and commissions
Many people look ahead more than one period
Not all investors forecast the same distribution
It is difficult to test the validity of CAPM.
Betas do not remain stable over time.
22. • Beta is not stationary
– Evidence that weekly betas are less than monthly
betas, especially for high-beta stocks
– Evidence that the stationarity of beta increases as
the estimation period increases
• The informed investment manager knows that
betas change
LIMITATIONS
23. Strengths and Weaknesses
CAPM and market beta are still useful too CFOs
and financial managers, knowing beta does give a
relative return that market sense.
CAPM is correct for stressing the importance of
diversification and for defining opportunity costs of
investors according to level of risk.
CAPM is a simple-to-use model that works well
enough in most situations.
24. • CAPM is not useful for stock trading or stock
selections with its simple assumptions
• Most of the estimation risk in the beta and
market risk premium, and this matters more for
longer-term projects.
• CAPM is the gold standard of corporate finance
even if not precise.
• CAPM is widely accepted in corporations; it
works because no one has found a method to
consistently beat those using it for business
decisions.
Strengths and Weaknesses
25. CONCULUSION
Research has shown the CAPM to stand up well
to criticism, although attacks against it have been
increasing in recent years. Until something better
presents itself, however, the CAPM remains a
very useful item in the financial management tool
kit.