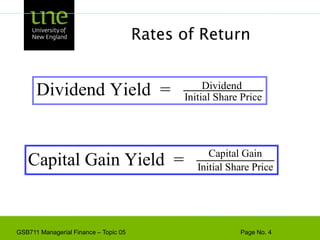
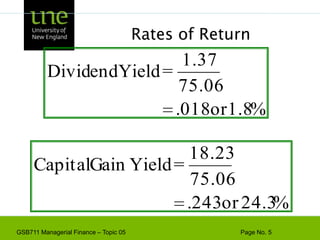
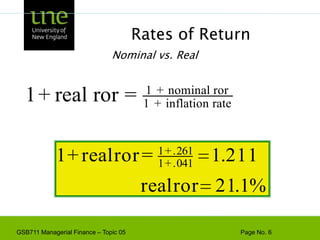
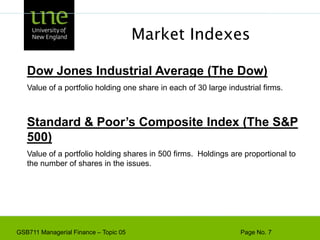
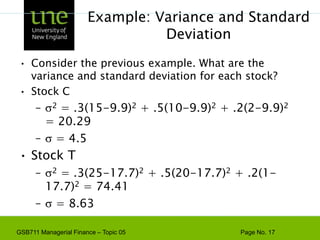
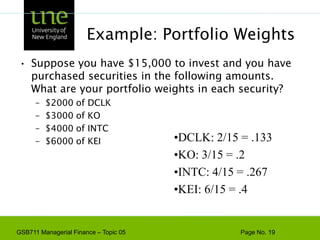
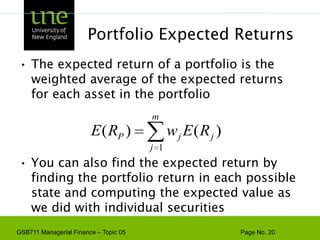
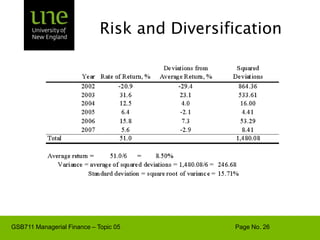
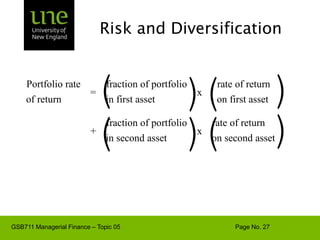
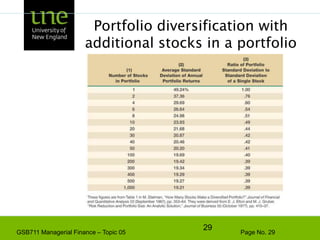
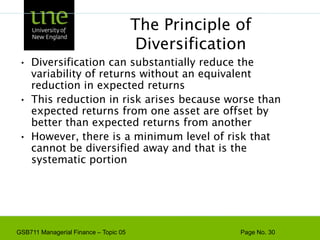
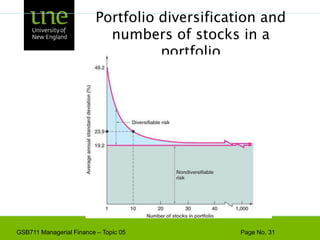
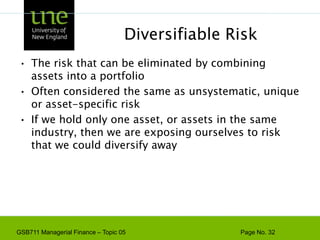
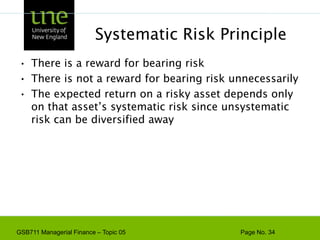
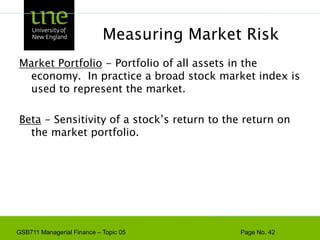
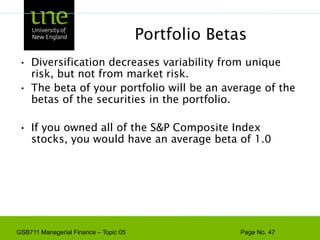
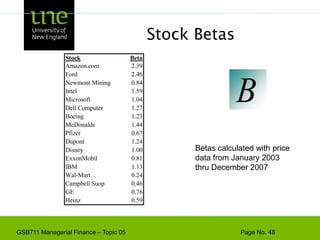
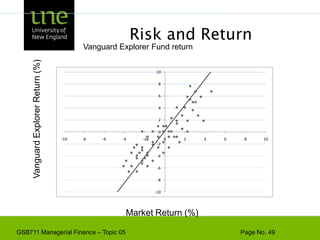
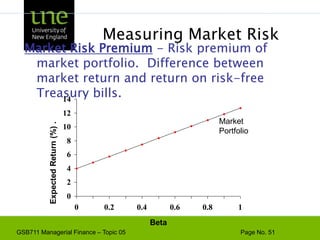
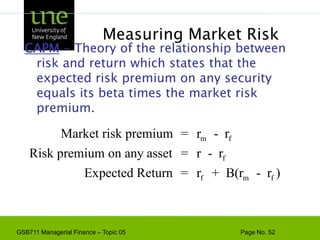
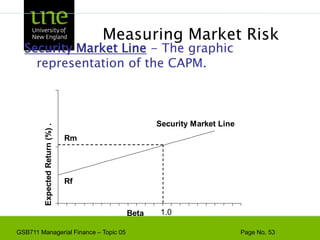
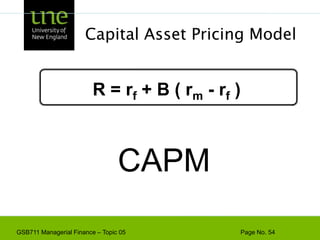
The document covers concepts of risk, return, and the Capital Asset Pricing Model (CAPM) as part of the Managerial Finance curriculum. It discusses various topics including rates of return, risk measurement, diversification, portfolio construction, and project risk in capital budgeting. Additionally, it highlights the impact of systematic and unsystematic risks on investment decisions and explores the relationship between risk and expected returns using beta as a key metric.
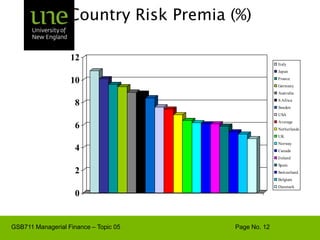


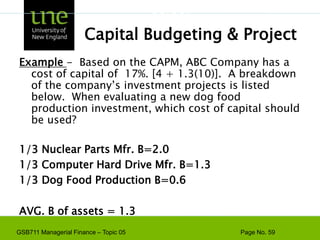
![Capital Budgeting & ProjectExample - Based on the CAPM, ABC Company has a cost of capital of 17%. [4 + 1.3(10)]. A breakdown of the company’s investment projects is listed below. When evaluating a new dog food production investment, which cost of capital should be used?1/3 Nuclear Parts Mfr. B=2.01/3 Computer Hard Drive Mfr. B=1.31/3 Dog Food Production B=0.6AVG. B of assets = 1.3Risk](https://image.slidesharecdn.com/gsb711lecturenote05-riskreturnandcapm-110111183554-phpapp02/85/GSB-711-Lecture-Note-05-Risk-Return-and-CAPM-61-320.jpg)


![Topic 4[1] finance](https://cdn.slidesharecdn.com/ss_thumbnails/topic41-131107182635-phpapp02-thumbnail.jpg?width=640&height=640&fit=bounds)


