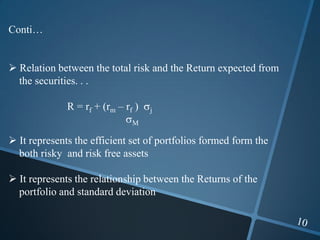
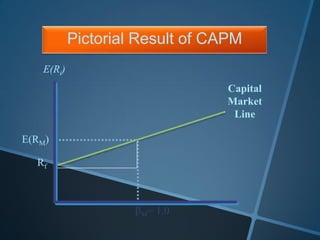
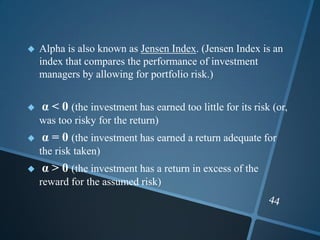
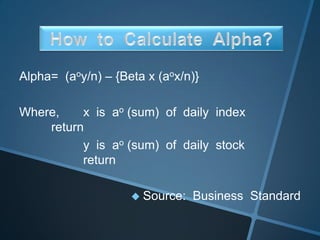
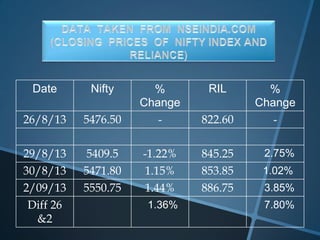
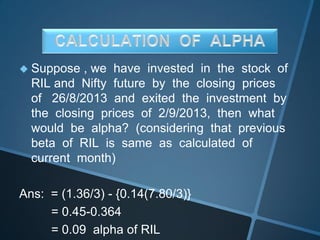
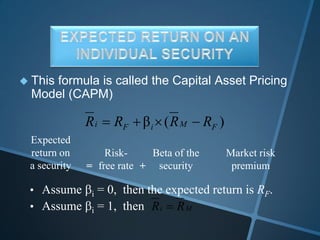
GROUP OPINION
PRESENTS. . .
 Introduced by Jack Trevnor, William Sharpe, John Linter,
and Jan Mossin
 CAPM is a model which is used to describe how
securities are priced in the marketplace
 It has its roots in Markowitz model
1. The investor’s objective is to maximize the utility of
the terminal wealth
2. Investors make choices on the basis of
“risk and return”
3. Investors have homogeneous expectations of
“risk and return”
4. Investors have identical time horizon
5. Information is freely and simultaneously available to
investors
6. There is a risk-free asset, and investors can borrow and
lend unlimited amounts at the risk-free rate
7. There are no taxes, transaction costs, restrictions on short
rates, or other market imperfections
8. Total asset quantity is fixed, and all assets are marketable
and divisible
CAPITAL MARKET LINE
 The capital market state that there is a risk free rate that is
provided by security. i.e. zero risk.
 This is also the rate available to all investors in the
market, at which they can borrow or lend any amount in
the market.
Conti…
 Relation between the total risk and the Return expected from
the securities. . .
R = rf + (rm – rf ) j
M
 It represents the efficient set of portfolios formed form the
both risky and risk free assets
 It represents the relationship between the Returns of the
portfolio and standard deviation
Pictorial Result of CAPM
E(Ri)
E(RM)
Rf
Capital
Market
Line
= 1.0
 Any investor can achieve the point along the straight line
(CML) by combining the proportion of risky security(M) and
risk-free rate.
Any point which is bellow or above the CML is not optimal.
The investor, instead of investing in a portfolio below the point
M, can always go for higher point of return for the same risk
level on the CML.
SECURITY MARKET LINE
1. It is graphical presentation of CAPM
2. After diversification only systematic risk
remains in the portfolio
3. So the return of the portfolio should depend
only on the systematic risk i.e. On beta
Security Market Line (SML)
 Graphically shows relationship between
market risk and required rate of return
Slope of SML
 The slope of the SML reflects investors’
degree of Risk Aversion.
 When slope is steep (high market price of
risk, high required rates of return), this
indicates that investors are nervous (worried,
concerned) about investing in the stock
market and want higher returns on every
stock.
 The required rate of return on a security
depends on
the risk free rate
the “beta” of the security, and
the market price of risk.
 The required return is a linear function of the
beta coefficient.
All else being the same, higher the beta coefficient,
higher is the required return on the security.
ESTIMATING RISK FREE RATE
 The risk free rate (T) is the least discussed of
the CAPM factors.
 Whether in academic research or in practical
applications of the CAPM the 90 days treasury
bill rate has been virtually the only proxy used
for the risk free assets.
PRACTICAL PROBLEMS
WITH USING THE
TREASURY BILL RATE
1. CENTRAL BANK INTERVENTION
 Choosing the treasury bill rate is not a pure
market rate.
 These rates are influenced by:
• Interest rate control
• Controlling the money supply
 Action of the central bank certainly affect bond &
equity prices & thus their yields.
2. SHORT TERM RATE
VOLATILITY
 Short term treasury securities show significant
variability over time.
 When the rates of return are calculated over
longer periods of time, the variability between
periods is quite dramatic.
 This variability could come from either of the two
components of the risk free rates:
• The nominal rate of return
• The return to compensate for expected inflation
3.THE TREASURY RATE & MINIMUM
RATE OF RETURN
 Although treasury bill rates are volatile, they may
still provide an adequate proxy (T).
 The model’s theoretical predictions & the actual
rates using treasury bill securities for the same
or the following period are quite different.
ESTIMATING THE
MARKET RETURN
 Many practitioners estimate future market
returns in much the same way that they estimate
beta.
 Consequently, these practitioners assume that
the past is an adequate mirror of the investors’
expected market premium.
ESTIMATING THE MARKET
RETURN
We have to discuss four of the
questions that analysts must answer
in the process of estimating the
market’s rate of return
1. CALCULATING SIMPLE OR
COMPOUND RETURNS
 There are two techniques used for calculating
returns:
-Simple (arithmetic) averages
- Compound (geometric) averages
Q.1 How should the return be calculated?
 If the average investor rebalanced his portfolio
every period, the geometric mean would not be
correct representation of his portfolio’s
performance over time.
 The arithmetic mean would provide better
measure of typical performance over time.
2. CALCULATING VALUE OR
EQUALLY WEIGHTED RETURNS
 In value-weighted index, where each return in
the indices weighted by the market value of the
stock.
 In equally weighted index, the returns are
simply averaged.
Q.2 If an index is used, should it be value-or-equal-
weighted?
3. TIME PERIOD
 In implementing the CAPM, many contend that
investors view the market return as a long term
concept.
 This suggests that investors opinion about
individual assets may change, but that the
expected market returns show long term
stability.
Q.3 Over what period should the return be calculated?
 Yet it has been well documented that certain
periods of history have greater impact on
individuals than do other periods.
 The period chosen reflects our best judgment of
the period of history that will mostly resemble the
market that we expect over the investors
horizon.
4. MARKET PROXY
 There are number of indices which can be used
as proxy for the market.
 It is difficult and probably impossible to know
whether an index is an adequate proxy for the
unknown world.
 Furthermore, since each index is composed of
different kinds of stocks, the return can be, and
should be, quite different.
Q.4 What proxy should be used for the market?
 ßeta is the share’s sensitivity to market
movement. It indicates how much the scrip
moves for a unit change in the market
index.
 Source: Business Standard
 Type of risks :
 Unsystematic Risk
 Systematic Risk
Beta is necessary for systematic risk.
Variance (Rm)= the uncertainty attached to
economic events
Covariance (Ri, Rm)= the responsiveness of an
asset’s rate of return (Ri) to those things
that also change the market’s rate of return
(Rm)
i= investment , m= market
(Rm)Variance
Rm)(Ri,Covariance
βi
 Co-efficient of Correlation
 Co-efficient of Regression
 Standard Deviation
How to Calculate
ßeta ?
Date Nifty %
Change
RIL %
Change
26/8/13 5476.50 - 822.60 -
29/8/13 5409.5 -1.22% 845.25 2.75%
30/8/13 5471.80 1.15% 853.85 1.02%
2/09/13 5550.75 1.44% 886.75 3.85%
Diff 26
&2
1.36% 7.80%
INDEX
(X-x̄) (X-x̄)² RIL (Y-¥) (Y-¥)² (X-x̄) (Y-
¥)
X x x² Y y y² xy
-1.22 -1.68 2.82 2.75 0.21 0.04 0.35
1.15 0.69 0.48 1.02 -1.52 2.31 -1.05
1.44 0.98 0.96 3.85 1.31 1.72 1.28
1.36 0.00 4.26 7.80 0.00 0.58
x̄ ¥
0.46 2.54
σx
σy
X
σx.σy
y)(x,Covariance
byx
Var.(x)
y)Cov.(x,
βeta
/nx
xy/n
2
RILofβeta14.0
4.26
0.58
PRACTICAL
APPLICATION OF
ßETA
 Suppose on Sunday (Dt. 9/9/2013) we decided to
invest in 60 shares by hedging it with nifty
futures on the Monday. How will we invest risk
free?
Ans:
Ril Investment = 886.75*60*0.14 (β)/ 5550.75
= 7448.7/5550.75
= 1.34
 Henceforth we will invest (short) in a lot of nifty
future (lot size 50 shares)
 Alpha is the excess return of stock above the risk-
adjusted market return, given its level of risk as
measured by beta.
 A positive alpha of 1.0 means the fund has outperformed
its benchmark index by 1%.
 A negative alpha would indicate an underperformance of
1%.
 Alpha is also known as Jensen Index. (Jensen Index is an
index that compares the performance of investment
managers by allowing for portfolio risk.)
 α < 0 (the investment has earned too little for its risk (or,
was too risky for the return)
 α = 0 (the investment has earned a return adequate for
the risk taken)
 α > 0 (the investment has a return in excess of the
reward for the assumed risk)
PRACTICAL
APPLICATION OF
ALPHA
Alpha= (aoy/n) – {Beta x (aox/n)}
Where, x is ao (sum) of daily index
return
y is ao (sum) of daily stock
return
 Source: Business Standard
Date Nifty %
Change
RIL %
Change
26/8/13 5476.50 - 822.60 -
29/8/13 5409.5 -1.22% 845.25 2.75%
30/8/13 5471.80 1.15% 853.85 1.02%
2/09/13 5550.75 1.44% 886.75 3.85%
Diff 26
&2
1.36% 7.80%
 Suppose , we have invested in the stock of
RIL and Nifty future by the closing prices
of 26/8/2013 and exited the investment by
the closing prices of 2/9/2013, then what
would be alpha? (considering that previous
beta of RIL is same as calculated of
current month)
Ans: = (1.36/3) - {0.14(7.80/3)}
= 0.45-0.364
= 0.09 alpha of RIL
 This formula is called the Capital Asset Pricing
Model (CAPM)
)(β FMiFi RRRR
• Assume i = 0, then the expected return is RF.
• Assume i = 1, then Mi RR
Expected
return on
a security =
Risk-
free rate +
Beta of the
security
Market risk
premium
capital asset pricing model

capital asset pricing model

  • 1.
  • 3.
     Introduced byJack Trevnor, William Sharpe, John Linter, and Jan Mossin  CAPM is a model which is used to describe how securities are priced in the marketplace  It has its roots in Markowitz model
  • 5.
    1. The investor’sobjective is to maximize the utility of the terminal wealth 2. Investors make choices on the basis of “risk and return” 3. Investors have homogeneous expectations of “risk and return”
  • 6.
    4. Investors haveidentical time horizon 5. Information is freely and simultaneously available to investors
  • 7.
    6. There isa risk-free asset, and investors can borrow and lend unlimited amounts at the risk-free rate 7. There are no taxes, transaction costs, restrictions on short rates, or other market imperfections 8. Total asset quantity is fixed, and all assets are marketable and divisible
  • 9.
    CAPITAL MARKET LINE The capital market state that there is a risk free rate that is provided by security. i.e. zero risk.  This is also the rate available to all investors in the market, at which they can borrow or lend any amount in the market.
  • 10.
    Conti…  Relation betweenthe total risk and the Return expected from the securities. . . R = rf + (rm – rf ) j M  It represents the efficient set of portfolios formed form the both risky and risk free assets  It represents the relationship between the Returns of the portfolio and standard deviation
  • 11.
    Pictorial Result ofCAPM E(Ri) E(RM) Rf Capital Market Line = 1.0
  • 12.
     Any investorcan achieve the point along the straight line (CML) by combining the proportion of risky security(M) and risk-free rate. Any point which is bellow or above the CML is not optimal. The investor, instead of investing in a portfolio below the point M, can always go for higher point of return for the same risk level on the CML.
  • 13.
    SECURITY MARKET LINE 1.It is graphical presentation of CAPM 2. After diversification only systematic risk remains in the portfolio 3. So the return of the portfolio should depend only on the systematic risk i.e. On beta
  • 14.
    Security Market Line(SML)  Graphically shows relationship between market risk and required rate of return
  • 15.
    Slope of SML The slope of the SML reflects investors’ degree of Risk Aversion.  When slope is steep (high market price of risk, high required rates of return), this indicates that investors are nervous (worried, concerned) about investing in the stock market and want higher returns on every stock.
  • 16.
     The requiredrate of return on a security depends on the risk free rate the “beta” of the security, and the market price of risk.  The required return is a linear function of the beta coefficient. All else being the same, higher the beta coefficient, higher is the required return on the security.
  • 17.
    ESTIMATING RISK FREERATE  The risk free rate (T) is the least discussed of the CAPM factors.  Whether in academic research or in practical applications of the CAPM the 90 days treasury bill rate has been virtually the only proxy used for the risk free assets.
  • 18.
    PRACTICAL PROBLEMS WITH USINGTHE TREASURY BILL RATE
  • 19.
    1. CENTRAL BANKINTERVENTION  Choosing the treasury bill rate is not a pure market rate.  These rates are influenced by: • Interest rate control • Controlling the money supply  Action of the central bank certainly affect bond & equity prices & thus their yields.
  • 20.
    2. SHORT TERMRATE VOLATILITY  Short term treasury securities show significant variability over time.  When the rates of return are calculated over longer periods of time, the variability between periods is quite dramatic.  This variability could come from either of the two components of the risk free rates: • The nominal rate of return • The return to compensate for expected inflation
  • 21.
    3.THE TREASURY RATE& MINIMUM RATE OF RETURN  Although treasury bill rates are volatile, they may still provide an adequate proxy (T).  The model’s theoretical predictions & the actual rates using treasury bill securities for the same or the following period are quite different.
  • 22.
  • 23.
     Many practitionersestimate future market returns in much the same way that they estimate beta.  Consequently, these practitioners assume that the past is an adequate mirror of the investors’ expected market premium. ESTIMATING THE MARKET RETURN
  • 24.
    We have todiscuss four of the questions that analysts must answer in the process of estimating the market’s rate of return
  • 25.
    1. CALCULATING SIMPLEOR COMPOUND RETURNS  There are two techniques used for calculating returns: -Simple (arithmetic) averages - Compound (geometric) averages Q.1 How should the return be calculated?
  • 26.
     If theaverage investor rebalanced his portfolio every period, the geometric mean would not be correct representation of his portfolio’s performance over time.  The arithmetic mean would provide better measure of typical performance over time.
  • 27.
    2. CALCULATING VALUEOR EQUALLY WEIGHTED RETURNS  In value-weighted index, where each return in the indices weighted by the market value of the stock.  In equally weighted index, the returns are simply averaged. Q.2 If an index is used, should it be value-or-equal- weighted?
  • 28.
    3. TIME PERIOD In implementing the CAPM, many contend that investors view the market return as a long term concept.  This suggests that investors opinion about individual assets may change, but that the expected market returns show long term stability. Q.3 Over what period should the return be calculated?
  • 29.
     Yet ithas been well documented that certain periods of history have greater impact on individuals than do other periods.  The period chosen reflects our best judgment of the period of history that will mostly resemble the market that we expect over the investors horizon.
  • 30.
    4. MARKET PROXY There are number of indices which can be used as proxy for the market.  It is difficult and probably impossible to know whether an index is an adequate proxy for the unknown world.  Furthermore, since each index is composed of different kinds of stocks, the return can be, and should be, quite different. Q.4 What proxy should be used for the market?
  • 32.
     ßeta isthe share’s sensitivity to market movement. It indicates how much the scrip moves for a unit change in the market index.  Source: Business Standard
  • 33.
     Type ofrisks :  Unsystematic Risk  Systematic Risk Beta is necessary for systematic risk.
  • 34.
    Variance (Rm)= theuncertainty attached to economic events Covariance (Ri, Rm)= the responsiveness of an asset’s rate of return (Ri) to those things that also change the market’s rate of return (Rm) i= investment , m= market (Rm)Variance Rm)(Ri,Covariance βi
  • 35.
     Co-efficient ofCorrelation  Co-efficient of Regression  Standard Deviation
  • 36.
  • 37.
    Date Nifty % Change RIL% Change 26/8/13 5476.50 - 822.60 - 29/8/13 5409.5 -1.22% 845.25 2.75% 30/8/13 5471.80 1.15% 853.85 1.02% 2/09/13 5550.75 1.44% 886.75 3.85% Diff 26 &2 1.36% 7.80%
  • 38.
    INDEX (X-x̄) (X-x̄)² RIL(Y-¥) (Y-¥)² (X-x̄) (Y- ¥) X x x² Y y y² xy -1.22 -1.68 2.82 2.75 0.21 0.04 0.35 1.15 0.69 0.48 1.02 -1.52 2.31 -1.05 1.44 0.98 0.96 3.85 1.31 1.72 1.28 1.36 0.00 4.26 7.80 0.00 0.58 x̄ ¥ 0.46 2.54
  • 39.
  • 40.
  • 41.
     Suppose onSunday (Dt. 9/9/2013) we decided to invest in 60 shares by hedging it with nifty futures on the Monday. How will we invest risk free? Ans: Ril Investment = 886.75*60*0.14 (β)/ 5550.75 = 7448.7/5550.75 = 1.34  Henceforth we will invest (short) in a lot of nifty future (lot size 50 shares)
  • 43.
     Alpha isthe excess return of stock above the risk- adjusted market return, given its level of risk as measured by beta.  A positive alpha of 1.0 means the fund has outperformed its benchmark index by 1%.  A negative alpha would indicate an underperformance of 1%.
  • 44.
     Alpha isalso known as Jensen Index. (Jensen Index is an index that compares the performance of investment managers by allowing for portfolio risk.)  α < 0 (the investment has earned too little for its risk (or, was too risky for the return)  α = 0 (the investment has earned a return adequate for the risk taken)  α > 0 (the investment has a return in excess of the reward for the assumed risk)
  • 45.
  • 46.
    Alpha= (aoy/n) –{Beta x (aox/n)} Where, x is ao (sum) of daily index return y is ao (sum) of daily stock return  Source: Business Standard
  • 47.
    Date Nifty % Change RIL% Change 26/8/13 5476.50 - 822.60 - 29/8/13 5409.5 -1.22% 845.25 2.75% 30/8/13 5471.80 1.15% 853.85 1.02% 2/09/13 5550.75 1.44% 886.75 3.85% Diff 26 &2 1.36% 7.80%
  • 48.
     Suppose ,we have invested in the stock of RIL and Nifty future by the closing prices of 26/8/2013 and exited the investment by the closing prices of 2/9/2013, then what would be alpha? (considering that previous beta of RIL is same as calculated of current month) Ans: = (1.36/3) - {0.14(7.80/3)} = 0.45-0.364 = 0.09 alpha of RIL
  • 49.
     This formulais called the Capital Asset Pricing Model (CAPM) )(β FMiFi RRRR • Assume i = 0, then the expected return is RF. • Assume i = 1, then Mi RR Expected return on a security = Risk- free rate + Beta of the security Market risk premium