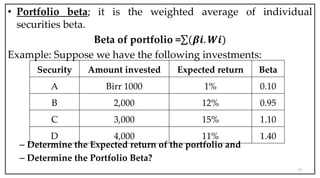
- Portfolio theory deals with constructing portfolios to maximize return for a given level of risk.
- Diversification reduces unsystematic risk but not all risk. Efficient portfolios provide the lowest risk for a given return.
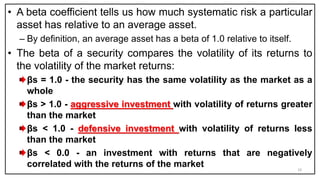
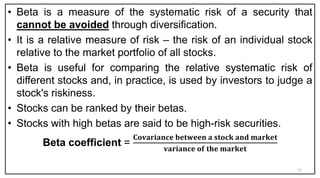
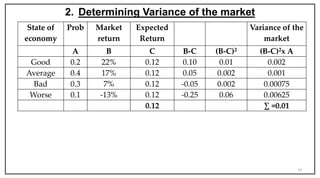
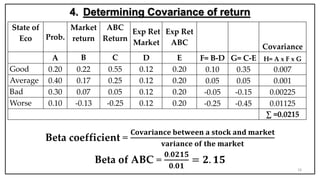
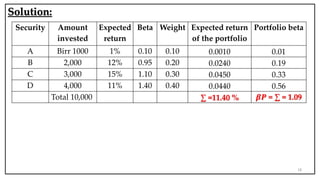
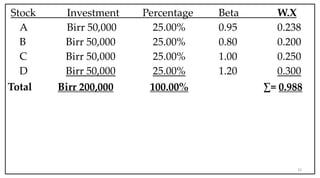
- Beta measures the systematic risk of an asset relative to the market. A beta of 1 means the asset has the same volatility as the market.


![Topic 4[1] finance](https://cdn.slidesharecdn.com/ss_thumbnails/topic41-131107182635-phpapp02-thumbnail.jpg?width=640&height=640&fit=bounds)


