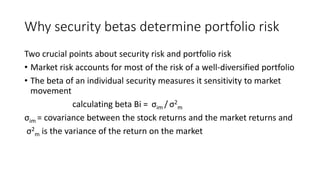
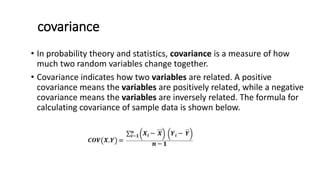
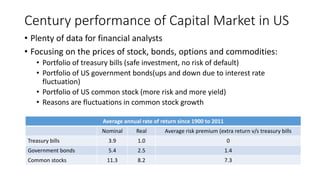
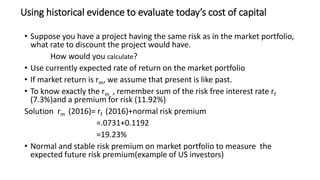
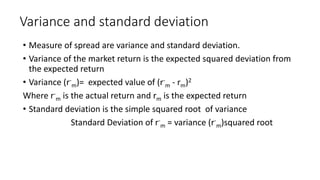
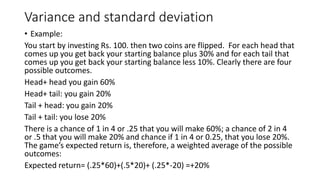
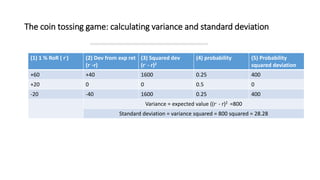
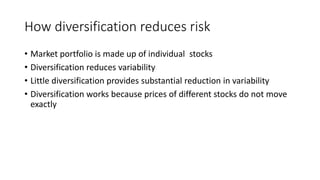
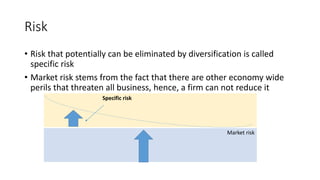
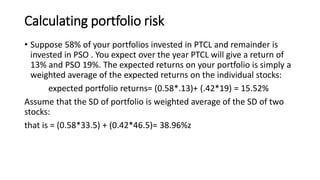
The document discusses the Capital Asset Pricing Model and concepts related to risk and return in finance, including the variability and management of business risk. It explains key terms like risk aversion, risk premium, and the relationship between risk and returns, as well as various financial instruments such as stocks, bonds, and portfolios. Additionally, it covers measures like covariance, standard deviation, and the importance of diversification in managing portfolio risk.


![Day ABC Returns (%) XYZ Returns (%)
1 1.1 3
2 1.7 4.2
3 2.1 4.9
4 1.4 4.1
5 0.2 2.5
Table: Daily returns for two stocks using the closing prices
Calculating Covariance
Calculating a stock's covariance starts with finding a list of previous prices. This is labeled as
"historical prices" on most quote pages. Typically, the closing price for each day is used to find the
return from one day to the next. Do this for both stocks, and build a list to begin the calculations.
For example:
From here, we need to calculate the average return for each stock:
For ABC it would be ( 1.1+1.7+2.1+1.4+0.2/ )5=1.30
For XYZ it would be ( 3+4.2+4.9+4.1+2.5/ )5=3.74
Now, it is a matter of taking the differences between ABC's return and ABC's average return, and
multiplying it by the difference between XYZ's return and XYZ's average return. The last step is to
divide the result by the sample size and subtract one. If it was the entire population, you could just
divide by the population size.
This can be represented by the following equation :
Using our example on ABC and XYZ above, the covariance is calculated as:
=[(1.1-1.30( x )3-3.74([ + ])1.7-1.30( x )4.2-3.74([ + ])2.1-1.30( x )4.9-3.74])+…
[ =0.148[ + ]0.184[ + ]0.928[ + ]0.036[ + ]1.364]
=2.66( /5-1)
=0.665](https://image.slidesharecdn.com/riskreturncapmlec5-160508083028/85/Risk-return-amp-lec5-8-320.jpg)
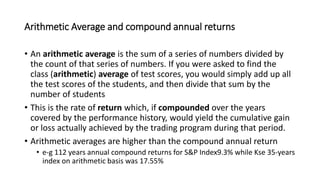
![Arithmetic Average and compound annual returns
• Suppose oil company Common Stock Price Rs.100. chances are that
the end of the year it might be Rs. 90, Rs. 110 or Rs. 130.
The expected return could be [1/3(-10+10+30)]= + 10
Or -10+10+30/3 =10%
• On discount or compound cash flow it will be as:
PV= 110/1.10= Rs. 100 (expected rate of return 10%)
• Average compound returns of oil company as:
(.9*1.1*1.3)1/3 =.088 or 8.8%
NPV at 10% = -100+108.8/1.1 = -1.1](https://image.slidesharecdn.com/riskreturncapmlec5-160508083028/85/Risk-return-amp-lec5-14-320.jpg)
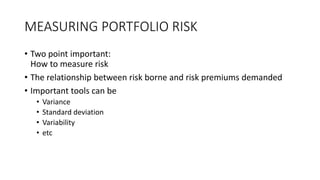
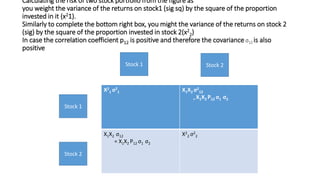
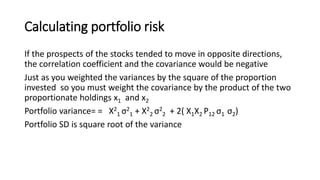
![Calculating portfolio risk
• We can the same in example of PTCL and PSO. We said earlier the two
stock were perfectly correlated, the SD of the portfolio would lie 58%
of the way between the SD of the two stocks
• The variance of your portfolio is the sum of these entries:
Portfolio variance = [(0.58)2 *(33.5)2]+ [(0.42)2* (46.5)2+2(0.58*42*1*33.5*46.5)=
1516.99
• SD= 38.95
PSOPTCL
= X1X2 P12 σ1 σ2
=(0.58)*0.42*1*(33.5)*(46.5)
X2
1 σ2
1 =(0.58)2 *(33.5)2PTCL
X2
2 σ2
2
=(0.4)2 * (46.5)2
= X1X2 P12 σ1 σ2
=(0.58)*(0.42)*1*(33.5)*(46.5)
PSO](https://image.slidesharecdn.com/riskreturncapmlec5-160508083028/85/Risk-return-amp-lec5-27-320.jpg)