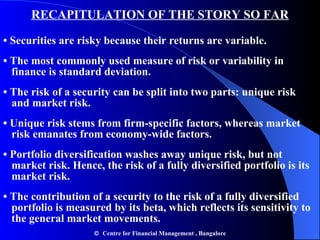
Downloaded 340 times


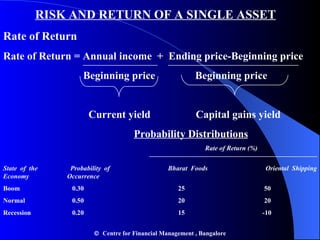
![RISK AND RETURN OF A SINGLE ASSET Expected Rate of Return n E ( R ) = p i R i i =1 E ( R b ) = (0.3)(25%) +(0.50)(20%) + (0.20) (15%)= 20.5% Standard Deviation of Return 2 = p i ( R i - E ( R )) 2 = 2 State of the Bharat Foods Stock Economy p i R i p i R i R i - E ( R ) ( R i - E ( R ))2 p i (R i - E ( R ))2 1. Boom 0.30 25 7.5 4.5 20.25 6.075 2. Normal 0.50 20 10.0 -0.5 0.25 0.125 3. Recession 0.20 0.20 15 3.0 -5.5 30.25 6.050 p i R i = 20.5 p i ( R i – E ( R ))2 = 12.25 σ = [ p i ( R i - E ( R ))2]1/2 = (12.25)1/2 = 3.5% Centre for Financial Management , Bangalore](https://image.slidesharecdn.com/chapter9riskreturn-110314221200-phpapp01/85/Chapter-9-risk-return-4-320.jpg)
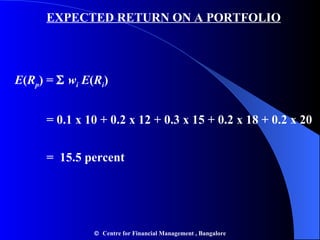
![PORTFOLIO RISK : 2-SECURITY CASE p = [ w 1 2 1 2 + w 2 2 2 2 +2 w 1 w 2 12 1 2 ] 1/2 Example w 1 = 0.6, w 2 = 0.4, 1 = 0.10 2 = 0.16, 12 = 0.5 p = [0.6 2 x 0.10 2 + 0.4 2 x 0.16 2 + 2x 0.6x 0.4x 0.5x 0.10 x 0.16] 1/2 = 10.7 percent Centre for Financial Management , Bangalore](https://image.slidesharecdn.com/chapter9riskreturn-110314221200-phpapp01/85/Chapter-9-risk-return-9-320.jpg)
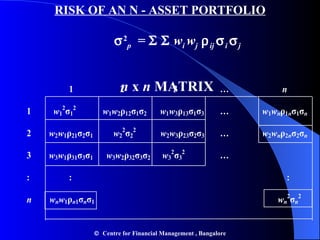
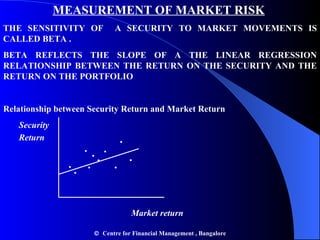
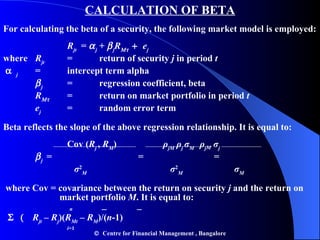
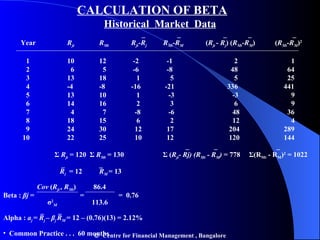
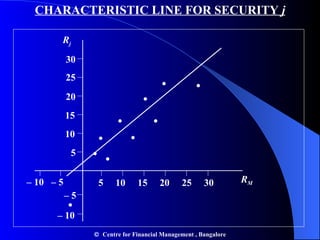
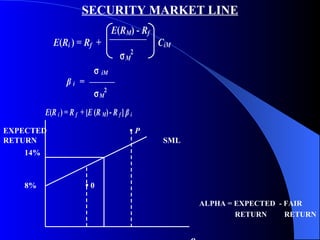
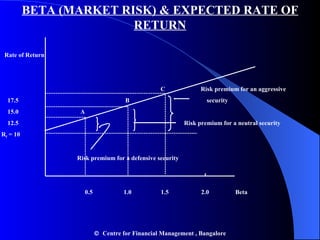
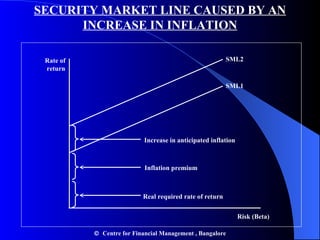
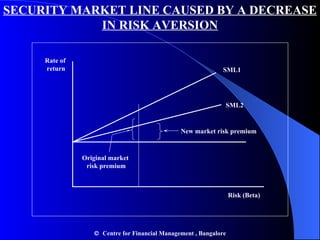
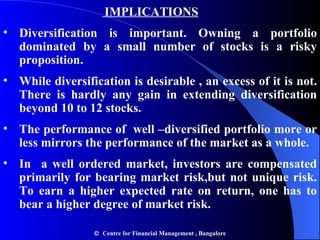
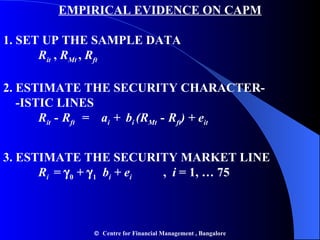
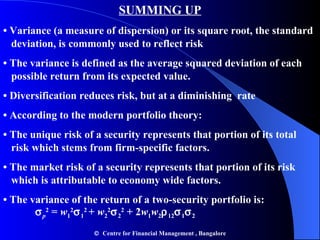
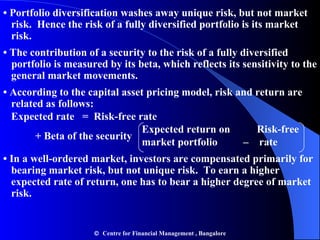

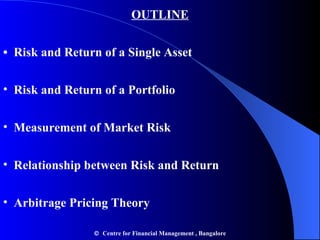
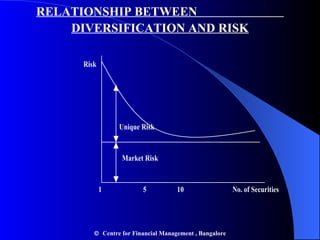
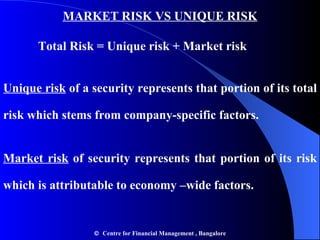
This chapter discusses risk and return, including: - Risk and return of individual assets is measured using probability distributions and expected return and standard deviation. - Portfolio risk is lower than holding individual assets due to diversification. Beta measures the sensitivity of an asset's return to market movements. - The Security Market Line shows the expected return of an asset based on its beta and the risk-free rate. The Capital Asset Pricing Model suggests assets should be priced based on their systematic risk.


