Downloaded 1,358 times


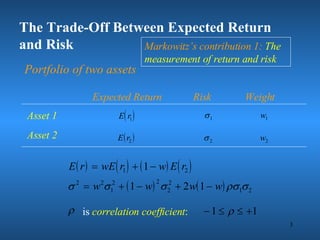


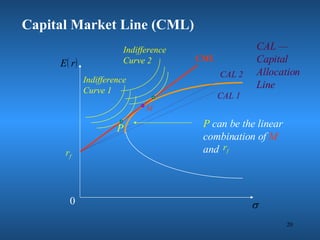


1) Portfolio theory shows that risk and return are negatively correlated, and diversification across many assets reduces unsystematic risk. Only systematic risk cannot be eliminated through diversification. 2) The efficient frontier graphs the set of optimal portfolios that maximize return for a given level of risk. The capital market line depicts the combination of investments in the market portfolio and risk-free asset. 3) The Capital Asset Pricing Model derives the security market line relationship between risk and return, defining risk as an asset's beta coefficient measuring its volatility relative to the market.


