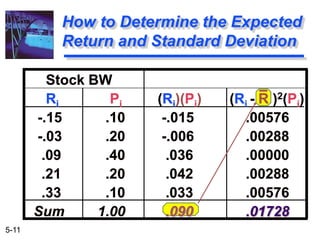
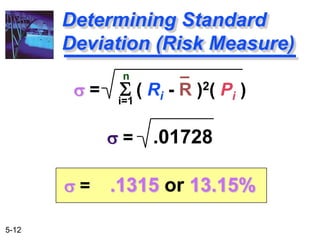
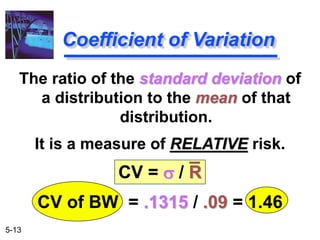
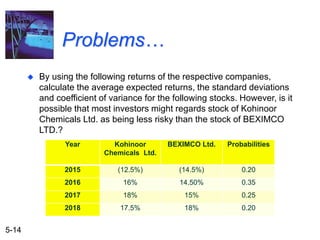
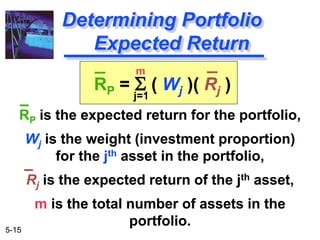
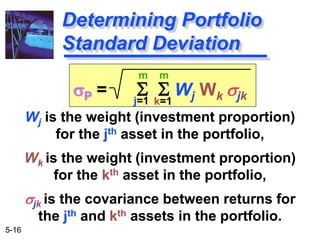
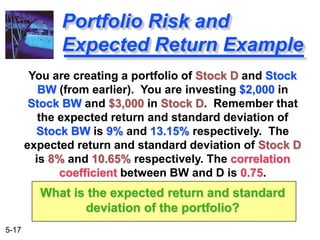
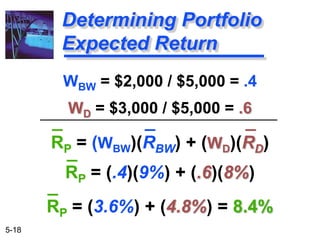
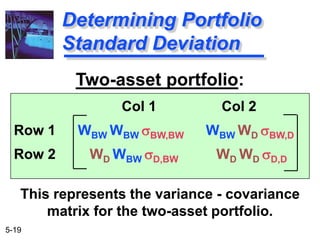
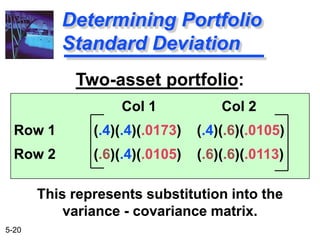
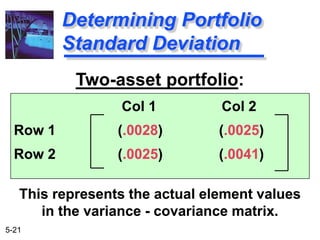
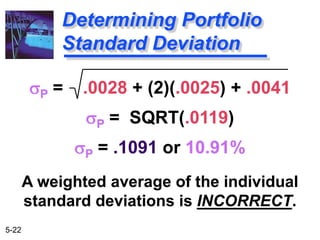
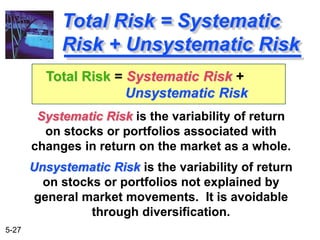
5-1
Chapter 3
Risk and
Return
5-2
After studying this Chapter,
you should be able to:
1. Understand the relationship (or “trade-off”) between
risk and return.
2. Define risk and return and show how to measure
them by calculating expected return, standard
deviation, and coefficient of variation.
3. Explain risk and return in a portfolio context, and
distinguish between individual security and portfolio
risk.
4. Distinguish between avoidable (unsystematic) risk
and unavoidable (systematic) risk and explain how
proper diversification can eliminate one of these
risks.
5-3
Risk and Return
Defining Risk and Return
Using Probability Distributions to
Measure Risk
Risk and Return in a Portfolio Context
Diversification
5-4
Defining Return
Income received on an investment
plus any change in market price,
usually expressed as a percent of
the beginning market price of the
investment.
Dt + (Pt - Pt-1 )
Pt-1
R =
5-5
Return Example
The stock price for Stock A was $10 per
share 1 year ago. The stock is currently
trading at $9.50 per share and shareholders
just received a $1 dividend. What return
was earned over the past year?
5-6
Return Example
The stock price for Stock A was $10 per
share 1 year ago. The stock is currently
trading at $9.50 per share and shareholders
just received a $1 dividend. What return
was earned over the past year?
$1.00 + ($9.50 - $10.00 )
$10.00R = = 5%
5-7
Defining Risk
What rate of return do you expect on your
investment (savings) this year?
What rate will you actually earn?
Does it matter if it is a bank CD or a share
of stock?
The variability of returns from
those that are expected.
5-8
Determining Expected
Return (Discrete Dist.)
R = S ( Ri )( Pi )
R is the expected return for the asset,
Ri is the return for the ith possibility,
Pi is the probability of that return
occurring,
n is the total number of possibilities.
n
i=1
5-9
How to Determine the Expected
Return and Standard Deviation
Stock BW
Ri Pi (Ri)(Pi)
-.15 .10 -.015
-.03 .20 -.006
.09 .40 .036
.21 .20 .042
.33 .10 .033
Sum 1.00 .090
The
expected
return, R,
for Stock
BW is .09
or 9%
5-10
Determining Standard
Deviation (Risk Measure)
s = S ( Ri - R )2( Pi )
Standard Deviation, s, is a statistical
measure of the variability of a distribution
around its mean.
It is the square root of variance.
Note, this is for a discrete distribution.
n
i=1
5-11
How to Determine the Expected
Return and Standard Deviation
Stock BW
Ri Pi (Ri)(Pi) (Ri - R )2(Pi)
-.15 .10 -.015 .00576
-.03 .20 -.006 .00288
.09 .40 .036 .00000
.21 .20 .042 .00288
.33 .10 .033 .00576
Sum 1.00 .090 .01728
5-12
Determining Standard
Deviation (Risk Measure)
s = S ( Ri - R )2( Pi )
s = .01728
s = .1315 or 13.15%
n
i=1
5-13
Coefficient of Variation
The ratio of the standard deviation of
a distribution to the mean of that
distribution.
It is a measure of RELATIVE risk.
CV = s / R
CV of BW = .1315 / .09 = 1.46
5-14
Problems…
 By using the following returns of the respective companies,
calculate the average expected returns, the standard deviations
and coefficient of variance for the following stocks. However, is it
possible that most investors might regards stock of Kohinoor
Chemicals Ltd. as being less risky than the stock of BEXIMCO
LTD.?
Year Kohinoor
Chemicals Ltd.
BEXIMCO Ltd. Probabilities
2015 (12.5%) (14.5%) 0.20
2016 16% 14.50% 0.35
2017 18% 15% 0.25
2018 17.5% 18% 0.20
5-15
RP = S ( Wj )( Rj )
RP is the expected return for the portfolio,
Wj is the weight (investment proportion)
for the jth asset in the portfolio,
Rj is the expected return of the jth asset,
m is the total number of assets in the
portfolio.
Determining Portfolio
Expected Return
m
j=1
5-16
Determining Portfolio
Standard Deviation
m
j=1
m
k=1
sP = S S Wj Wk sjk
Wj is the weight (investment proportion)
for the jth asset in the portfolio,
Wk is the weight (investment proportion)
for the kth asset in the portfolio,
sjk is the covariance between returns for
the jth and kth assets in the portfolio.
5-17
You are creating a portfolio of Stock D and Stock
BW (from earlier). You are investing $2,000 in
Stock BW and $3,000 in Stock D. Remember that
the expected return and standard deviation of
Stock BW is 9% and 13.15% respectively. The
expected return and standard deviation of Stock D
is 8% and 10.65% respectively. The correlation
coefficient between BW and D is 0.75.
What is the expected return and standard
deviation of the portfolio?
Portfolio Risk and
Expected Return Example
5-18
Determining Portfolio
Expected Return
WBW = $2,000 / $5,000 = .4
WD = $3,000 / $5,000 = .6
RP = (WBW)(RBW) + (WD)(RD)
RP = (.4)(9%) + (.6)(8%)
RP = (3.6%) + (4.8%) = 8.4%
5-19
Two-asset portfolio:
Col 1 Col 2
Row 1 WBW WBW sBW,BW WBW WD sBW,D
Row 2 WD WBW sD,BW WD WD sD,D
This represents the variance - covariance
matrix for the two-asset portfolio.
Determining Portfolio
Standard Deviation
5-20
Two-asset portfolio:
Col 1 Col 2
Row 1 (.4)(.4)(.0173) (.4)(.6)(.0105)
Row 2 (.6)(.4)(.0105) (.6)(.6)(.0113)
This represents substitution into the
variance - covariance matrix.
Determining Portfolio
Standard Deviation
5-21
Two-asset portfolio:
Col 1 Col 2
Row 1 (.0028) (.0025)
Row 2 (.0025) (.0041)
This represents the actual element values
in the variance - covariance matrix.
Determining Portfolio
Standard Deviation
5-22
Determining Portfolio
Standard Deviation
sP = .0028 + (2)(.0025) + .0041
sP = SQRT(.0119)
sP = .1091 or 10.91%
A weighted average of the individual
standard deviations is INCORRECT.
5-23
Determining Portfolio
Standard Deviation
The WRONG way to calculate is a
weighted average like:
sP = .4 (13.15%) + .6(10.65%)
sP = 5.26 + 6.39 = 11.65%
10.91% = 11.65%
This is INCORRECT.
5-24
Stock C Stock D Portfolio
Return 9.00% 8.00% 8.64%
Stand.
Dev. 13.15% 10.65% 10.91%
CV 1.46 1.33 1.26
The portfolio has the LOWEST coefficient
of variation due to diversification.
Summary of the Portfolio
Return and Risk Calculation
5-25
Problem
 Stock A and B have the following historical returns.
a) Calculate the average rate of return for each stock during the period
2008 to 2012. Assume that someone held a portfolio consisting of 50% of
stock A and Stock B. What would have been the realized rate of return on
the portfolio in which year from 2008 to 2012? What would have been the
average return on the portfolio during this period?
b) Calculate the SD of returns for each stock and the portfolio.
C) Calculate the CV of returns for each stock and the portfolio
Years Stock-A’s Return Stock-B’s Return
2010 38.67 44.25
2011 14.33 3.67
2012 33.00 28.30
5-26
Combining securities that are not perfectly,
positively correlated reduces risk.
Diversification and the
Correlation Coefficient
INVESTMENTRETURN
TIME TIMETIME
SECURITY E SECURITY F
Combination
E and F
5-27
Systematic Risk is the variability of return
on stocks or portfolios associated with
changes in return on the market as a whole.
Unsystematic Risk is the variability of return
on stocks or portfolios not explained by
general market movements. It is avoidable
through diversification.
Total Risk = Systematic
Risk + Unsystematic Risk
Total Risk = Systematic Risk +
Unsystematic Risk
5-28
Total Risk = Systematic
Risk + Unsystematic Risk
Total
Risk
Unsystematic risk
Systematic risk
STDDEVOFPORTFOLIORETURN
NUMBER OF SECURITIES IN THE PORTFOLIO
Factors such as changes in nation’s
economy, tax reform by the Congress,
or a change in the world situation.
5-29
Total Risk = Systematic
Risk + Unsystematic Risk
Total
Risk
Unsystematic risk
Systematic risk
STDDEVOFPORTFOLIORETURN
NUMBER OF SECURITIES IN THE PORTFOLIO
Factors unique to a particular company
or industry. For example, the death of a
key executive or loss of a governmental
defense contract.

Risk and return

  • 1.
  • 2.
    5-2 After studying thisChapter, you should be able to: 1. Understand the relationship (or “trade-off”) between risk and return. 2. Define risk and return and show how to measure them by calculating expected return, standard deviation, and coefficient of variation. 3. Explain risk and return in a portfolio context, and distinguish between individual security and portfolio risk. 4. Distinguish between avoidable (unsystematic) risk and unavoidable (systematic) risk and explain how proper diversification can eliminate one of these risks.
  • 3.
    5-3 Risk and Return DefiningRisk and Return Using Probability Distributions to Measure Risk Risk and Return in a Portfolio Context Diversification
  • 4.
    5-4 Defining Return Income receivedon an investment plus any change in market price, usually expressed as a percent of the beginning market price of the investment. Dt + (Pt - Pt-1 ) Pt-1 R =
  • 5.
    5-5 Return Example The stockprice for Stock A was $10 per share 1 year ago. The stock is currently trading at $9.50 per share and shareholders just received a $1 dividend. What return was earned over the past year?
  • 6.
    5-6 Return Example The stockprice for Stock A was $10 per share 1 year ago. The stock is currently trading at $9.50 per share and shareholders just received a $1 dividend. What return was earned over the past year? $1.00 + ($9.50 - $10.00 ) $10.00R = = 5%
  • 7.
    5-7 Defining Risk What rateof return do you expect on your investment (savings) this year? What rate will you actually earn? Does it matter if it is a bank CD or a share of stock? The variability of returns from those that are expected.
  • 8.
    5-8 Determining Expected Return (DiscreteDist.) R = S ( Ri )( Pi ) R is the expected return for the asset, Ri is the return for the ith possibility, Pi is the probability of that return occurring, n is the total number of possibilities. n i=1
  • 9.
    5-9 How to Determinethe Expected Return and Standard Deviation Stock BW Ri Pi (Ri)(Pi) -.15 .10 -.015 -.03 .20 -.006 .09 .40 .036 .21 .20 .042 .33 .10 .033 Sum 1.00 .090 The expected return, R, for Stock BW is .09 or 9%
  • 10.
    5-10 Determining Standard Deviation (RiskMeasure) s = S ( Ri - R )2( Pi ) Standard Deviation, s, is a statistical measure of the variability of a distribution around its mean. It is the square root of variance. Note, this is for a discrete distribution. n i=1
  • 11.
    5-11 How to Determinethe Expected Return and Standard Deviation Stock BW Ri Pi (Ri)(Pi) (Ri - R )2(Pi) -.15 .10 -.015 .00576 -.03 .20 -.006 .00288 .09 .40 .036 .00000 .21 .20 .042 .00288 .33 .10 .033 .00576 Sum 1.00 .090 .01728
  • 12.
    5-12 Determining Standard Deviation (RiskMeasure) s = S ( Ri - R )2( Pi ) s = .01728 s = .1315 or 13.15% n i=1
  • 13.
    5-13 Coefficient of Variation Theratio of the standard deviation of a distribution to the mean of that distribution. It is a measure of RELATIVE risk. CV = s / R CV of BW = .1315 / .09 = 1.46
  • 14.
    5-14 Problems…  By usingthe following returns of the respective companies, calculate the average expected returns, the standard deviations and coefficient of variance for the following stocks. However, is it possible that most investors might regards stock of Kohinoor Chemicals Ltd. as being less risky than the stock of BEXIMCO LTD.? Year Kohinoor Chemicals Ltd. BEXIMCO Ltd. Probabilities 2015 (12.5%) (14.5%) 0.20 2016 16% 14.50% 0.35 2017 18% 15% 0.25 2018 17.5% 18% 0.20
  • 15.
    5-15 RP = S( Wj )( Rj ) RP is the expected return for the portfolio, Wj is the weight (investment proportion) for the jth asset in the portfolio, Rj is the expected return of the jth asset, m is the total number of assets in the portfolio. Determining Portfolio Expected Return m j=1
  • 16.
    5-16 Determining Portfolio Standard Deviation m j=1 m k=1 sP= S S Wj Wk sjk Wj is the weight (investment proportion) for the jth asset in the portfolio, Wk is the weight (investment proportion) for the kth asset in the portfolio, sjk is the covariance between returns for the jth and kth assets in the portfolio.
  • 17.
    5-17 You are creatinga portfolio of Stock D and Stock BW (from earlier). You are investing $2,000 in Stock BW and $3,000 in Stock D. Remember that the expected return and standard deviation of Stock BW is 9% and 13.15% respectively. The expected return and standard deviation of Stock D is 8% and 10.65% respectively. The correlation coefficient between BW and D is 0.75. What is the expected return and standard deviation of the portfolio? Portfolio Risk and Expected Return Example
  • 18.
    5-18 Determining Portfolio Expected Return WBW= $2,000 / $5,000 = .4 WD = $3,000 / $5,000 = .6 RP = (WBW)(RBW) + (WD)(RD) RP = (.4)(9%) + (.6)(8%) RP = (3.6%) + (4.8%) = 8.4%
  • 19.
    5-19 Two-asset portfolio: Col 1Col 2 Row 1 WBW WBW sBW,BW WBW WD sBW,D Row 2 WD WBW sD,BW WD WD sD,D This represents the variance - covariance matrix for the two-asset portfolio. Determining Portfolio Standard Deviation
  • 20.
    5-20 Two-asset portfolio: Col 1Col 2 Row 1 (.4)(.4)(.0173) (.4)(.6)(.0105) Row 2 (.6)(.4)(.0105) (.6)(.6)(.0113) This represents substitution into the variance - covariance matrix. Determining Portfolio Standard Deviation
  • 21.
    5-21 Two-asset portfolio: Col 1Col 2 Row 1 (.0028) (.0025) Row 2 (.0025) (.0041) This represents the actual element values in the variance - covariance matrix. Determining Portfolio Standard Deviation
  • 22.
    5-22 Determining Portfolio Standard Deviation sP= .0028 + (2)(.0025) + .0041 sP = SQRT(.0119) sP = .1091 or 10.91% A weighted average of the individual standard deviations is INCORRECT.
  • 23.
    5-23 Determining Portfolio Standard Deviation TheWRONG way to calculate is a weighted average like: sP = .4 (13.15%) + .6(10.65%) sP = 5.26 + 6.39 = 11.65% 10.91% = 11.65% This is INCORRECT.
  • 24.
    5-24 Stock C StockD Portfolio Return 9.00% 8.00% 8.64% Stand. Dev. 13.15% 10.65% 10.91% CV 1.46 1.33 1.26 The portfolio has the LOWEST coefficient of variation due to diversification. Summary of the Portfolio Return and Risk Calculation
  • 25.
    5-25 Problem  Stock Aand B have the following historical returns. a) Calculate the average rate of return for each stock during the period 2008 to 2012. Assume that someone held a portfolio consisting of 50% of stock A and Stock B. What would have been the realized rate of return on the portfolio in which year from 2008 to 2012? What would have been the average return on the portfolio during this period? b) Calculate the SD of returns for each stock and the portfolio. C) Calculate the CV of returns for each stock and the portfolio Years Stock-A’s Return Stock-B’s Return 2010 38.67 44.25 2011 14.33 3.67 2012 33.00 28.30
  • 26.
    5-26 Combining securities thatare not perfectly, positively correlated reduces risk. Diversification and the Correlation Coefficient INVESTMENTRETURN TIME TIMETIME SECURITY E SECURITY F Combination E and F
  • 27.
    5-27 Systematic Risk isthe variability of return on stocks or portfolios associated with changes in return on the market as a whole. Unsystematic Risk is the variability of return on stocks or portfolios not explained by general market movements. It is avoidable through diversification. Total Risk = Systematic Risk + Unsystematic Risk Total Risk = Systematic Risk + Unsystematic Risk
  • 28.
    5-28 Total Risk =Systematic Risk + Unsystematic Risk Total Risk Unsystematic risk Systematic risk STDDEVOFPORTFOLIORETURN NUMBER OF SECURITIES IN THE PORTFOLIO Factors such as changes in nation’s economy, tax reform by the Congress, or a change in the world situation.
  • 29.
    5-29 Total Risk =Systematic Risk + Unsystematic Risk Total Risk Unsystematic risk Systematic risk STDDEVOFPORTFOLIORETURN NUMBER OF SECURITIES IN THE PORTFOLIO Factors unique to a particular company or industry. For example, the death of a key executive or loss of a governmental defense contract.