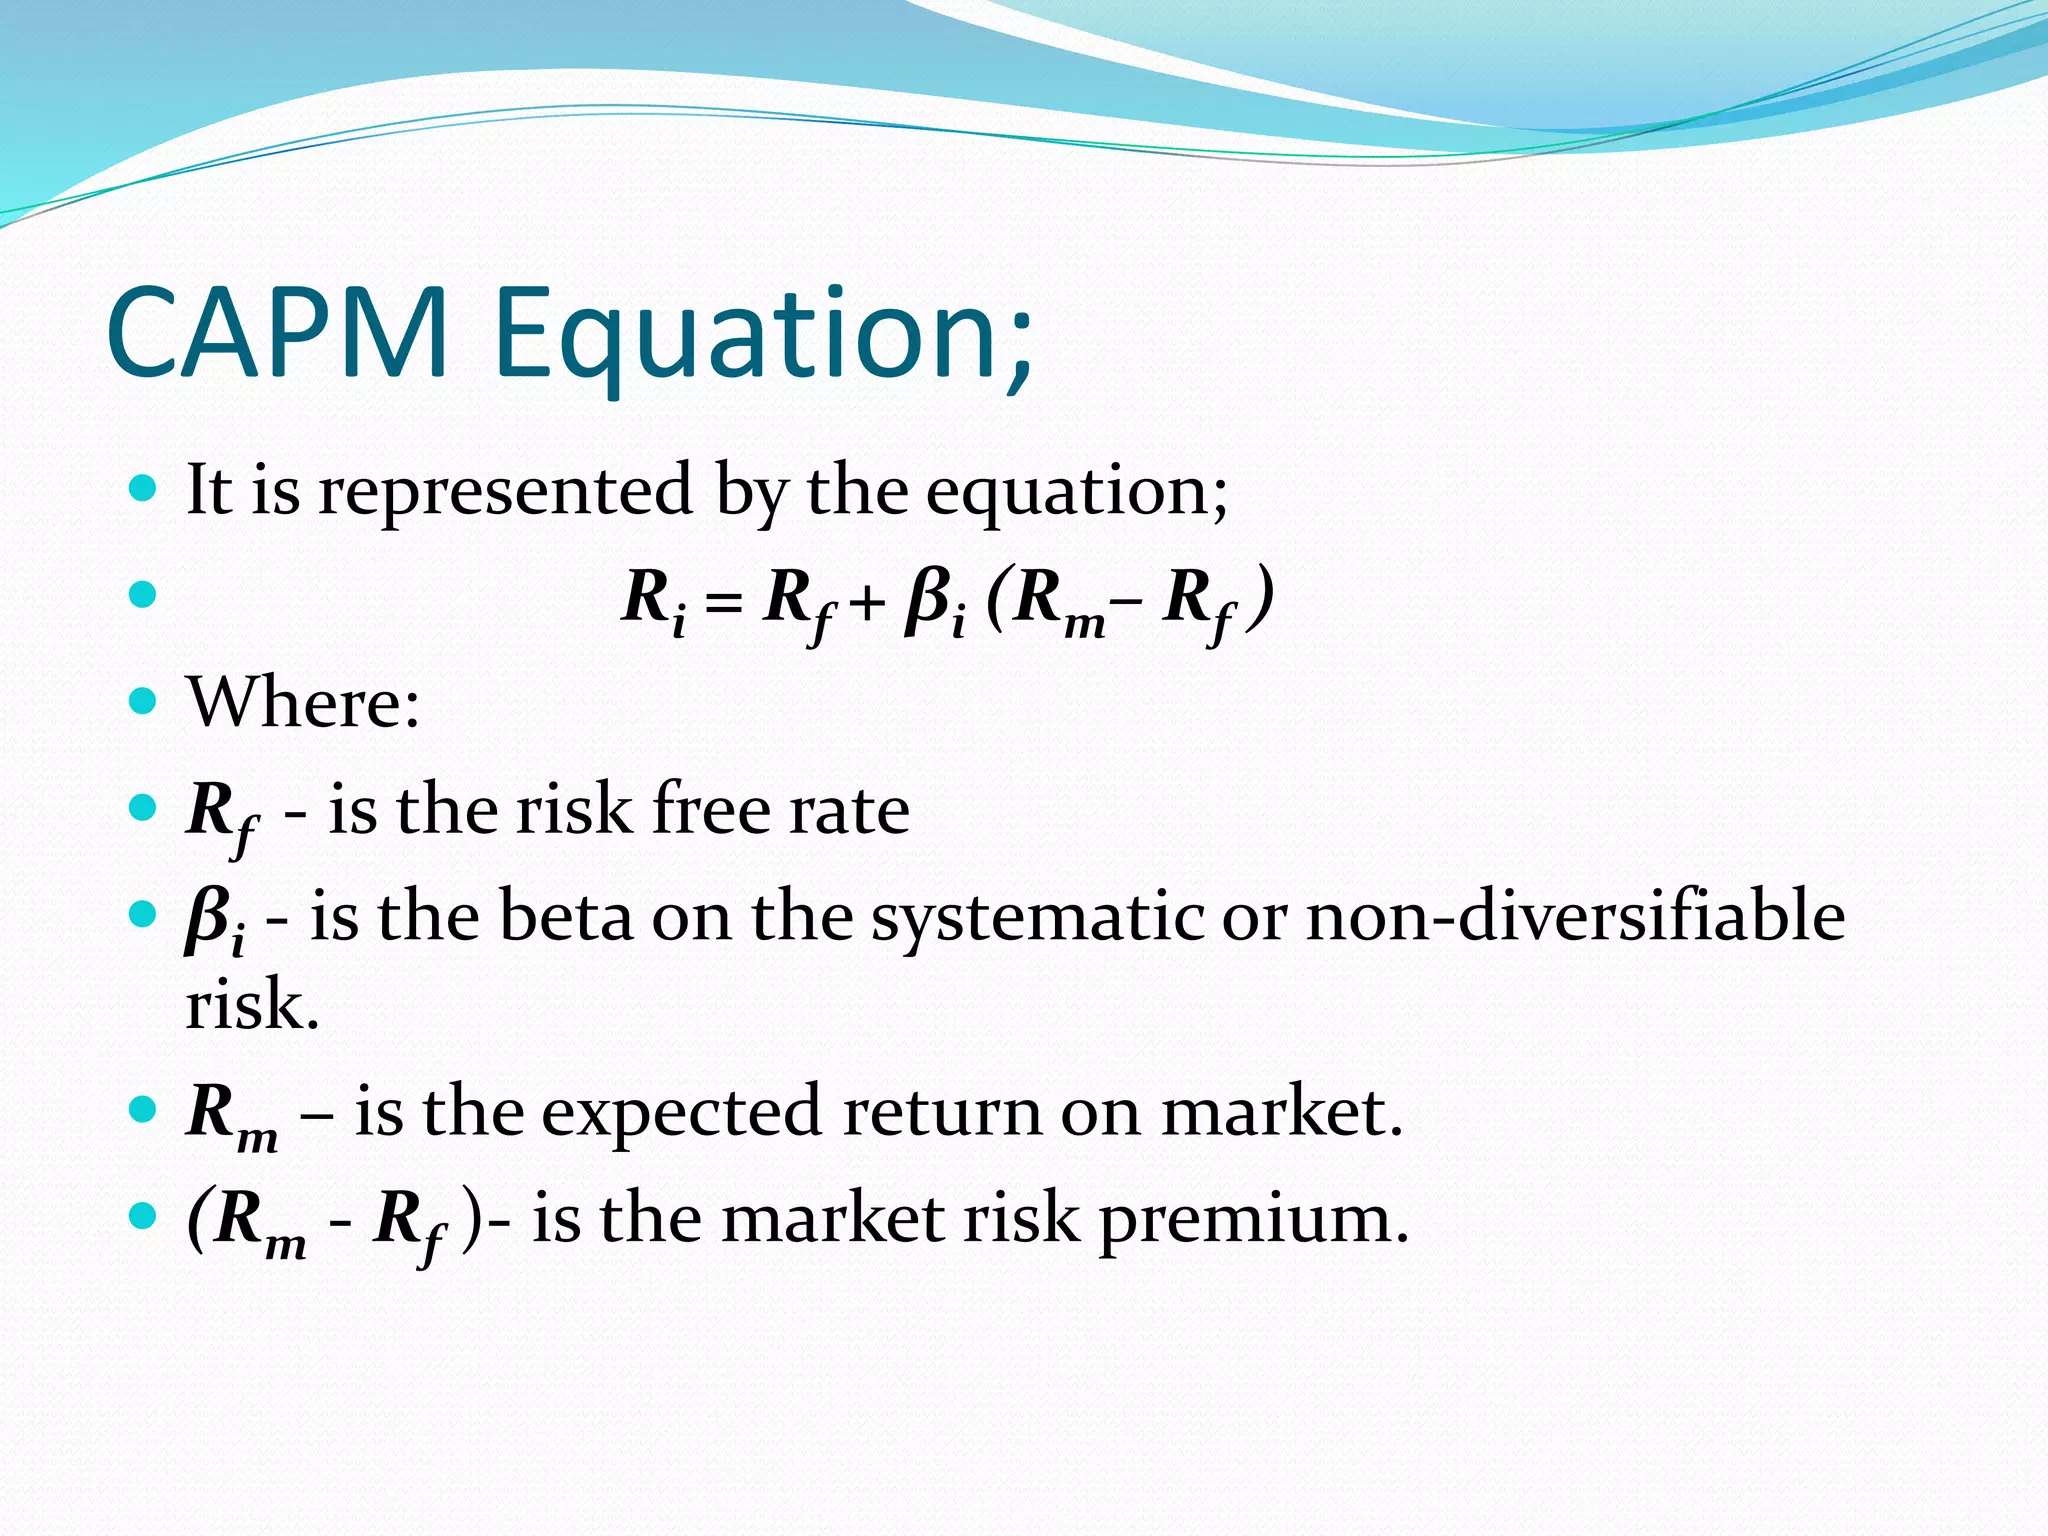
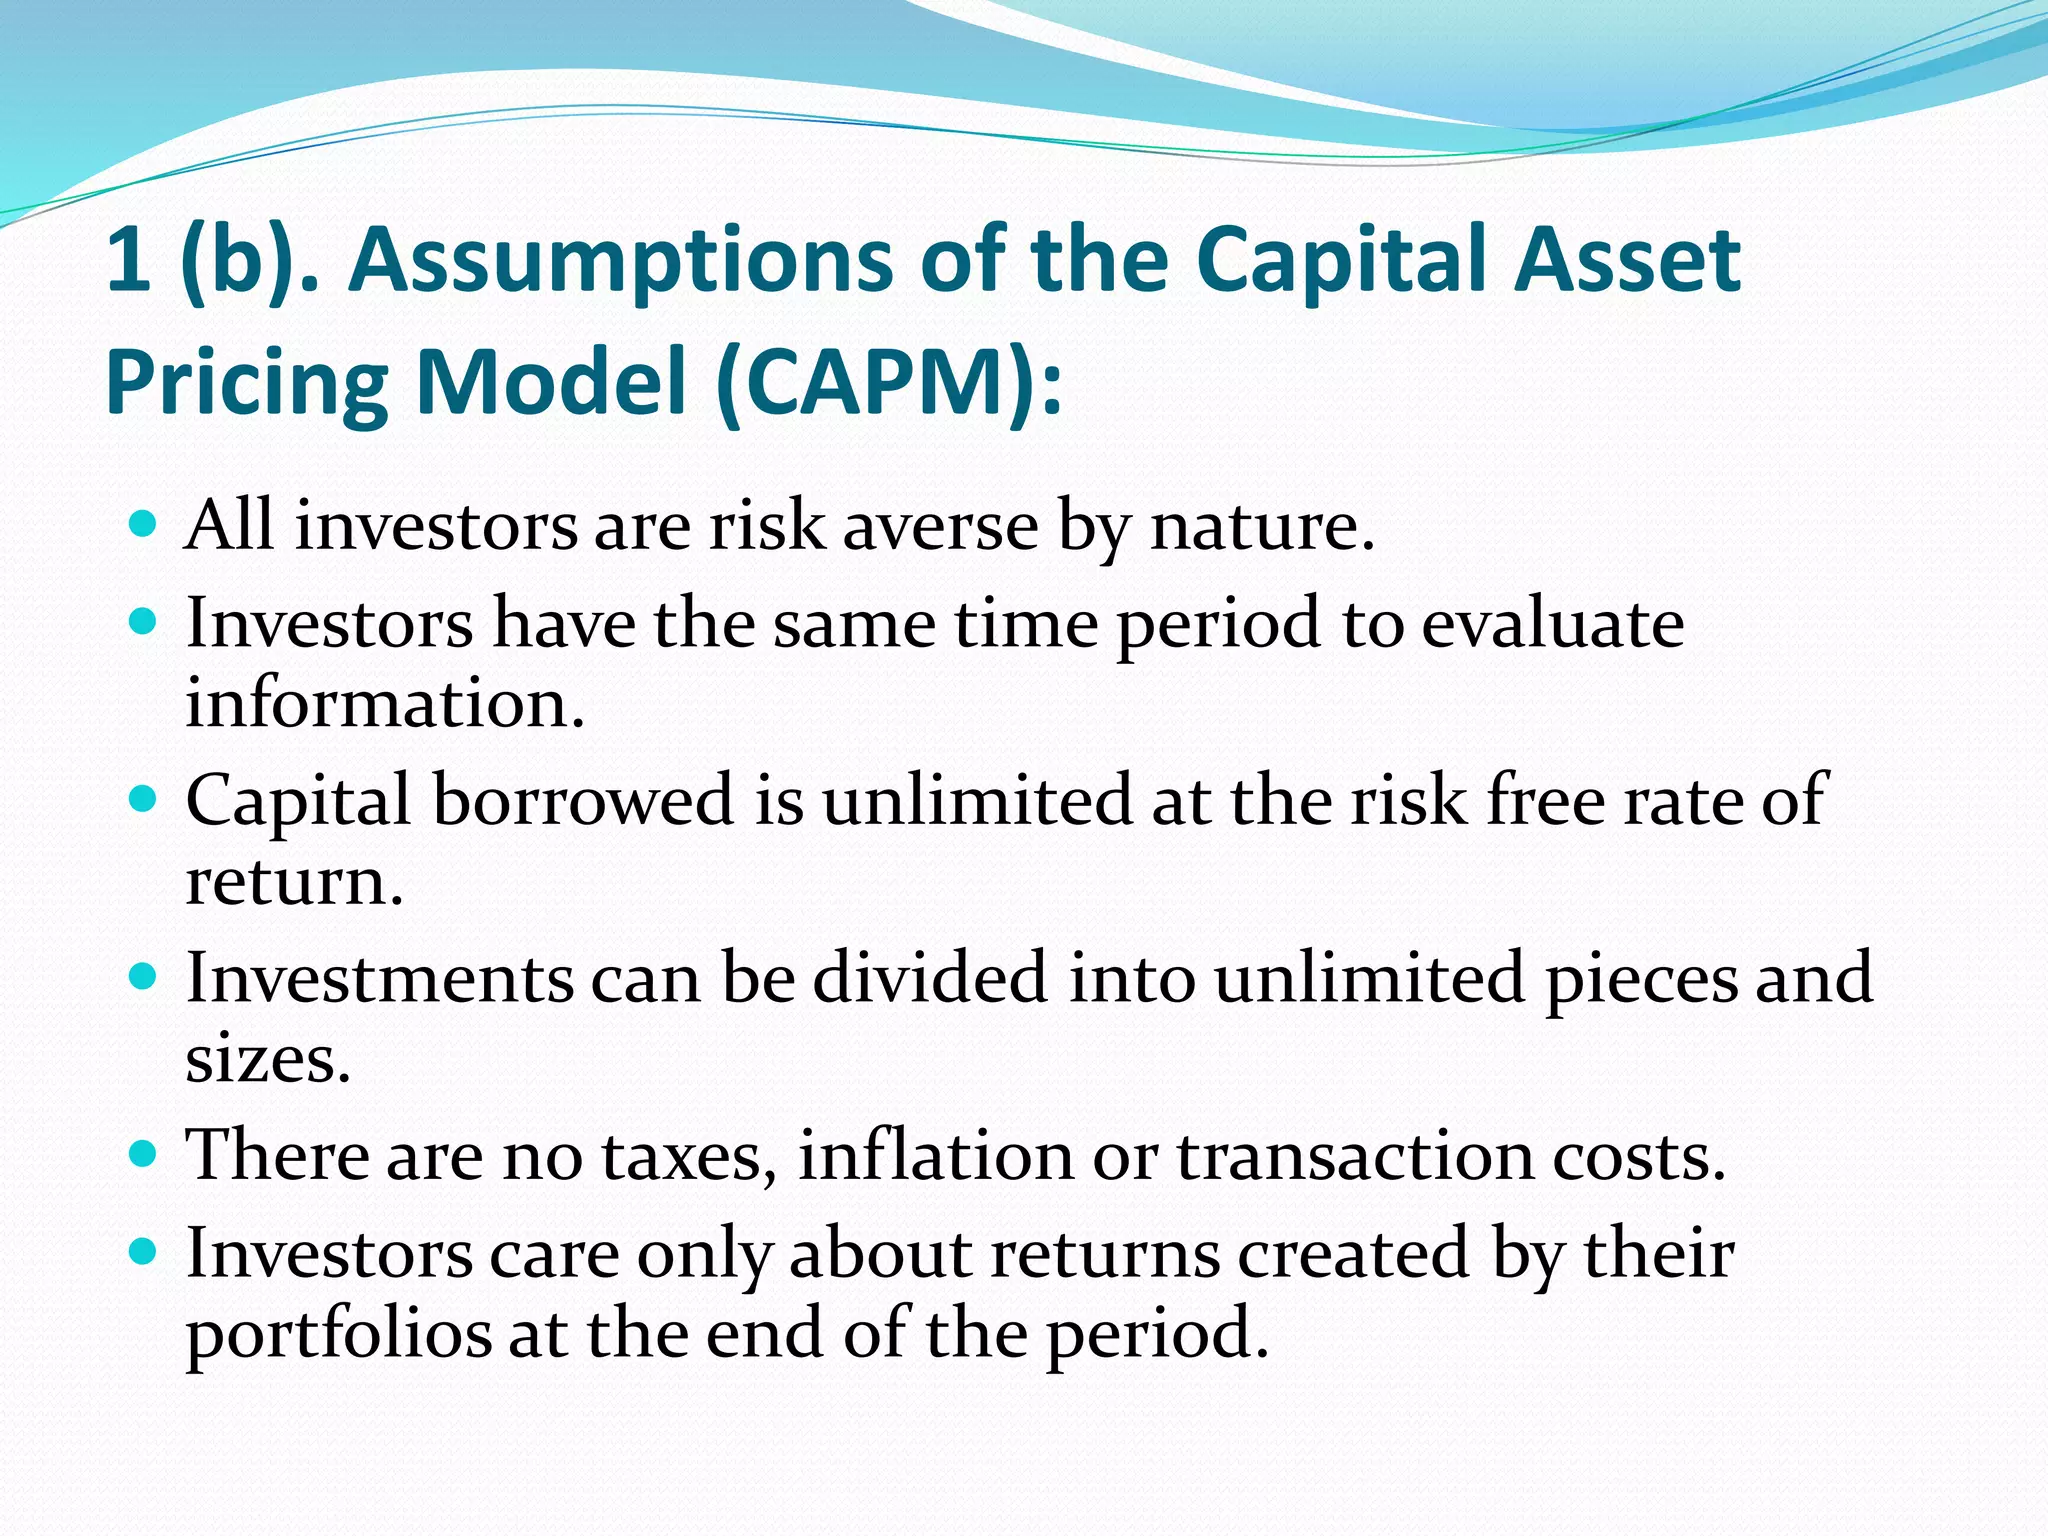
Presentation by:
Kamba Saleh Kidandaire
to Postgraduate Students of
Cavendish University-Uganda (2015)
BARODA FUND MANAGERS:
Case Study:
Demand for portfolio managers has risen in the past
years as investors from all walks of life try to get the most
out of their resources. You being a graduate of Cavendish
University and having been recommended to Mr. Lee to
advise him on the different securities that are available
for investment, understand and know the current trends
taking place in the business cycles. Your knowledge on
security analysis and portfolio management has earned
you a lot of respect in the industry from your colleagues.
Mr. Lee has come with the following data to appoint you
as a portfolio manager.
TABLE:
SECURITY. ESTIMATED
RETUN %
BETA. STANDARD
DEVIATION.
A 30 2.0 50
B 20 1.5 40
C 20 1.0 30
D 11.5 0.8 25
E 10.0 0.5 20
MARKET INDEX 15 1.0 18
GOVERNMENT
SECURITY
7 0 0
Questions.
1. (a). What is capital Asset Pricing Model?
(b). List and discuss 5 assumptions of Capital Asset
Pricing Model.
(c). In terms of the security market line, which of the
securities listed above are underpriced.
2. (a). Compare and contrast Capital Market Line and
Security Market Line.
(b). Assuming a portfolio is constructed using equal
proportions of five securities listed above; calculate the
expected return and risk.
1 (a) Capital Asset Pricing Model
(CAPM):
 It is used to describe the relationship between risk and
returns.
 It can be used in pricing of risk securities.
 The model was introduced in 1964 as an extension of
the Modern Portfolio Theory.
 Modern Portfolio Theory explores ways investors can
construct portfolios that have minimal risk levels while
maximizing returns.
CAPM Equation;
 It is represented by the equation;
 Ri = Rf + βi (Rm– Rf )
 Where:
 Rf - is the risk free rate
 βi - is the beta on the systematic or non-diversifiable
risk.
 Rm – is the expected return on market.
 (Rm - Rf )- is the market risk premium.
1 (b). Assumptions of the Capital Asset
Pricing Model (CAPM):
 All investors are risk averse by nature.
 Investors have the same time period to evaluate
information.
 Capital borrowed is unlimited at the risk free rate of
return.
 Investments can be divided into unlimited pieces and
sizes.
 There are no taxes, inflation or transaction costs.
 Investors care only about returns created by their
portfolios at the end of the period.
1 (c). Using the security market line (SML), to
determine securities which are underpriced:
 The SML is used to display the expected rate of return
of a particular security as a function of the systematic
or non-diversifiable risk.
 SML is given by the formula;
E(Ri) = Rf + βi [ E(Rm) – Rf ]
SML ……………………………continued.
 Where:
 E(Ri) - is the expected rate on security.
 Rf - is the risk free rate
 βi - is the systematic or non-diversifiable risk.
 E(Rm) – is the expected return on market portfolio.
 Rm - is the market risk.
SECURITY A:
 Therefore
 A: E(Ri) = Rf + βi [ E(Rm) – Rf ]
 E(Ri) = 50 + 2 [ 30 – 50)
 = 50 + 2 [-20]
 = 50 + -40
 = 10 per cent.
SECURITY B:
 E(Ri) = Rf + βi [ E(Rm) – Rf ]
 E(Ri) = 40 + 1.5 [ 25 – 40)
 = 40 + 1.5 [-15]
 = 40 + -22.5
 = 17.5 per cent.
SECURITY C:
 E(Ri) = Rf + βi [ E(Rm) – Rf ]
 E(Ri) = 30 + 1 [20 – 30]
 = 30 + 1 [-10]
 = 30 + -10
 = 20 per cent.
SECURITY D:
 E(Ri) = Rf + βi [ E(Rm) – Rf ]
 E(Ri) = 25 + 0.8 [11.5 – 25)
 = 25 +0.8 [-13.5]
 = 25 + -10.8
 = 14.2 per cent.
SECURITY E:
 E(Ri) = Rf + βi [ E(Rm) – Rf ]
 E(Ri) = 20 + 0.5 [10 – 20]
 = 20 + 0.5 [-10]
 = 20 + -5
 = 15 per cent.
Price values of securities.
Security Estimated
Return %
Calculated
Return %
Stock price or
value
A 30 20 Overpriced
B 25 17.5 Overpriced
C 20 20 Well priced
D 11.5 14.2 Underpriced
E 10 15 Underpriced
2(a). Relationship between Capital Market
Line (CML) and Security Market Line (SML):
Differences;
CML SML
Demonstrates the rate of
return depending on risk
free rate of return and level
of risks for a specified
portfolio.
Demonstrates market risk and
expected return s at a given time.
Determines the market
portfolio and risk free
assets.
Determines all security factors
E.g; inflation rates, taxes, transaction
costs etc…
Differences (cont….)
Graphs drawn under
Capital market line
define mostly, if
not only, the
efficient portfolios .
Security market line
graph represents both
efficient and non-
efficient portfolios.
Risks are measured
through standard
deviation or through
the total risk factors
Risks are measured
through the beta
coefficient (β).
Shows the level of risk
and return for a
Shows the level of risk and
return for individual
Similarities between CML and
SML:
 The similarities can be extracted from the assumptions
of CAPM (Capital Asset Pricing Model). Therefore;
 All investors are risk averse by nature.
 Investors have the same time period to evaluate
information.
 Capital borrowed is unlimited at the risk free rate of
return
CML & SML Similarities (continued….)
 In both market lines, investments can be divided into
unlimited pieces and sizes.
 There are no taxes, inflation or transaction costs in
both cases.
 Investors care only about returns created by their
portfolios at the end of the period.
Question 2 (b)
 If a portfolio is constructed using equal
proportions of five securities listed above;
calculate the expected return and risk.
The expected return on portfolio.
 This is given the equation;
E(Rp) = W (Rm) + (1 – W) Rf
 Where
 E(Rp) is the expected return on portfolio.
 W is the weight or proportion or measurement of risk
security which given as 1.0
 Rm is the expected return on risky security which given
as 15.
 Rf is the expected return from risk free security which
stated as 18.
Cont….
 Expected return on the portfolio is calculated using
the market index since it appeals to all the 5 securities.
Expected Return on Portfolio:
 E(Rp) = W*(Rm) + (1 – W)*Rf
E(Rp) = 1.0*(15) + (1- 1.0)*18
= 15 + (0)*18
= 15 + 0
= 15 per cent
Portfolio Risk:
 This is stated with the equation;
σp = Wσj
 Where;
 σp is the portfolio risk.
 W is the weight of the risk security or the beta which is 0
 σj is the standard deviation which is given as 0
Portfolio Risk:
 Therefore;
 σp = Wσj
 = 0*0
 =0 percent.
 Therefore there are no risks incurred in the portfolio.
END OF
PRESENTATION
#THANK YOU#

Financial Management: Capital Asset Pricing Model (CAPM)

  • 1.
    Presentation by: Kamba SalehKidandaire to Postgraduate Students of Cavendish University-Uganda (2015)
  • 2.
    BARODA FUND MANAGERS: CaseStudy: Demand for portfolio managers has risen in the past years as investors from all walks of life try to get the most out of their resources. You being a graduate of Cavendish University and having been recommended to Mr. Lee to advise him on the different securities that are available for investment, understand and know the current trends taking place in the business cycles. Your knowledge on security analysis and portfolio management has earned you a lot of respect in the industry from your colleagues. Mr. Lee has come with the following data to appoint you as a portfolio manager.
  • 3.
    TABLE: SECURITY. ESTIMATED RETUN % BETA.STANDARD DEVIATION. A 30 2.0 50 B 20 1.5 40 C 20 1.0 30 D 11.5 0.8 25 E 10.0 0.5 20 MARKET INDEX 15 1.0 18 GOVERNMENT SECURITY 7 0 0
  • 4.
    Questions. 1. (a). Whatis capital Asset Pricing Model? (b). List and discuss 5 assumptions of Capital Asset Pricing Model. (c). In terms of the security market line, which of the securities listed above are underpriced. 2. (a). Compare and contrast Capital Market Line and Security Market Line. (b). Assuming a portfolio is constructed using equal proportions of five securities listed above; calculate the expected return and risk.
  • 5.
    1 (a) CapitalAsset Pricing Model (CAPM):  It is used to describe the relationship between risk and returns.  It can be used in pricing of risk securities.  The model was introduced in 1964 as an extension of the Modern Portfolio Theory.  Modern Portfolio Theory explores ways investors can construct portfolios that have minimal risk levels while maximizing returns.
  • 6.
    CAPM Equation;  Itis represented by the equation;  Ri = Rf + βi (Rm– Rf )  Where:  Rf - is the risk free rate  βi - is the beta on the systematic or non-diversifiable risk.  Rm – is the expected return on market.  (Rm - Rf )- is the market risk premium.
  • 7.
    1 (b). Assumptionsof the Capital Asset Pricing Model (CAPM):  All investors are risk averse by nature.  Investors have the same time period to evaluate information.  Capital borrowed is unlimited at the risk free rate of return.  Investments can be divided into unlimited pieces and sizes.  There are no taxes, inflation or transaction costs.  Investors care only about returns created by their portfolios at the end of the period.
  • 8.
    1 (c). Usingthe security market line (SML), to determine securities which are underpriced:  The SML is used to display the expected rate of return of a particular security as a function of the systematic or non-diversifiable risk.  SML is given by the formula; E(Ri) = Rf + βi [ E(Rm) – Rf ]
  • 9.
    SML ……………………………continued.  Where: E(Ri) - is the expected rate on security.  Rf - is the risk free rate  βi - is the systematic or non-diversifiable risk.  E(Rm) – is the expected return on market portfolio.  Rm - is the market risk.
  • 10.
    SECURITY A:  Therefore A: E(Ri) = Rf + βi [ E(Rm) – Rf ]  E(Ri) = 50 + 2 [ 30 – 50)  = 50 + 2 [-20]  = 50 + -40  = 10 per cent.
  • 11.
    SECURITY B:  E(Ri)= Rf + βi [ E(Rm) – Rf ]  E(Ri) = 40 + 1.5 [ 25 – 40)  = 40 + 1.5 [-15]  = 40 + -22.5  = 17.5 per cent.
  • 12.
    SECURITY C:  E(Ri)= Rf + βi [ E(Rm) – Rf ]  E(Ri) = 30 + 1 [20 – 30]  = 30 + 1 [-10]  = 30 + -10  = 20 per cent.
  • 13.
    SECURITY D:  E(Ri)= Rf + βi [ E(Rm) – Rf ]  E(Ri) = 25 + 0.8 [11.5 – 25)  = 25 +0.8 [-13.5]  = 25 + -10.8  = 14.2 per cent.
  • 14.
    SECURITY E:  E(Ri)= Rf + βi [ E(Rm) – Rf ]  E(Ri) = 20 + 0.5 [10 – 20]  = 20 + 0.5 [-10]  = 20 + -5  = 15 per cent.
  • 15.
    Price values ofsecurities. Security Estimated Return % Calculated Return % Stock price or value A 30 20 Overpriced B 25 17.5 Overpriced C 20 20 Well priced D 11.5 14.2 Underpriced E 10 15 Underpriced
  • 16.
    2(a). Relationship betweenCapital Market Line (CML) and Security Market Line (SML): Differences; CML SML Demonstrates the rate of return depending on risk free rate of return and level of risks for a specified portfolio. Demonstrates market risk and expected return s at a given time. Determines the market portfolio and risk free assets. Determines all security factors E.g; inflation rates, taxes, transaction costs etc…
  • 17.
    Differences (cont….) Graphs drawnunder Capital market line define mostly, if not only, the efficient portfolios . Security market line graph represents both efficient and non- efficient portfolios. Risks are measured through standard deviation or through the total risk factors Risks are measured through the beta coefficient (β). Shows the level of risk and return for a Shows the level of risk and return for individual
  • 18.
    Similarities between CMLand SML:  The similarities can be extracted from the assumptions of CAPM (Capital Asset Pricing Model). Therefore;  All investors are risk averse by nature.  Investors have the same time period to evaluate information.  Capital borrowed is unlimited at the risk free rate of return
  • 19.
    CML & SMLSimilarities (continued….)  In both market lines, investments can be divided into unlimited pieces and sizes.  There are no taxes, inflation or transaction costs in both cases.  Investors care only about returns created by their portfolios at the end of the period.
  • 20.
    Question 2 (b) If a portfolio is constructed using equal proportions of five securities listed above; calculate the expected return and risk.
  • 21.
    The expected returnon portfolio.  This is given the equation; E(Rp) = W (Rm) + (1 – W) Rf  Where  E(Rp) is the expected return on portfolio.  W is the weight or proportion or measurement of risk security which given as 1.0  Rm is the expected return on risky security which given as 15.  Rf is the expected return from risk free security which stated as 18.
  • 22.
    Cont….  Expected returnon the portfolio is calculated using the market index since it appeals to all the 5 securities.
  • 23.
    Expected Return onPortfolio:  E(Rp) = W*(Rm) + (1 – W)*Rf E(Rp) = 1.0*(15) + (1- 1.0)*18 = 15 + (0)*18 = 15 + 0 = 15 per cent
  • 24.
    Portfolio Risk:  Thisis stated with the equation; σp = Wσj  Where;  σp is the portfolio risk.  W is the weight of the risk security or the beta which is 0  σj is the standard deviation which is given as 0
  • 25.
    Portfolio Risk:  Therefore; σp = Wσj  = 0*0  =0 percent.  Therefore there are no risks incurred in the portfolio.
  • 26.