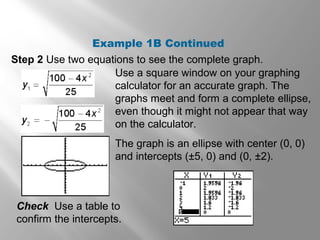
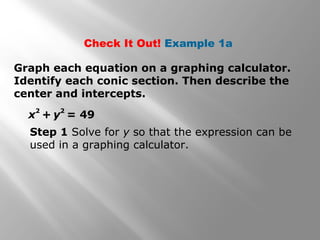
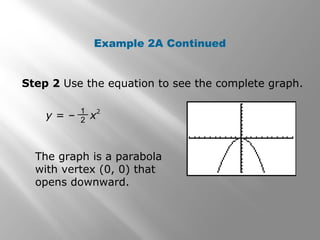
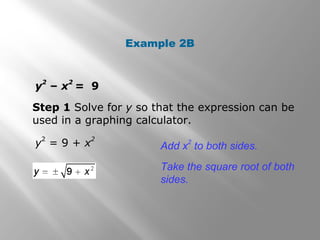
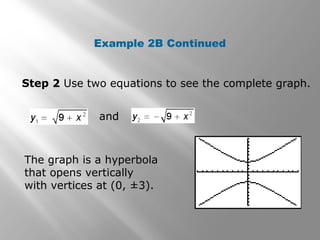
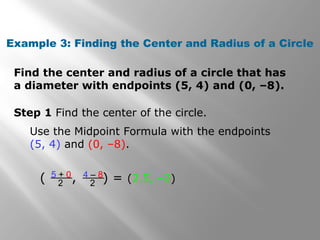
UNIT 13.1 CONIC SECTIONUNIT 13.1 CONIC SECTION
BASICSBASICS
Warm Up
Solve for y.
1. x
2
+ y
2
= 1
2. 4x
2
– 9y
2
= 1
Recognize conic sections as
intersections of planes and cones.
Use the distance and midpoint formulas
to solve problems.
Objectives
conic section
Vocabulary
In Chapter 5, you studied the
parabola. The parabola is one
of a family of curves called
conic sections. Conic
sections are formed by the
intersection of a double right
cone and a plane. There are
four types of conic sections:
circles, ellipses, hyperbolas,
and parabolas.
Although the parabolas you studied in Chapter 5 are
functions, most conic sections are not. This means
that you often must use two functions to graph a
conic section on a calculator.
When you take the square root of both sides of
an equation, remember that you must include
the positive and negative roots.
Remember!
A circle is defined by its center and its radius. An
ellipse, an elongated shape similar to a circle, has
two perpendicular axes of different lengths.
Graph each equation on a graphing calculator.
Identify each conic section. Then describe the
center and intercepts.
Example 1A: Graphing Circles and Ellipses on a
Calculator
(x – 1)
2
+ (y – 1)
2
= 1
Step 1 Solve for y so that the expression can be
used in a graphing calculator.
Subtract (x – 1)
2
from both sides.(y – 1)
2
= 1 – (x – 1)
2
Take square root of both sides.
Then add 1 to both sides.
Example 1A Continued
Step 2 Use two equations to see the complete graph.
Use a square window on your
graphing calculator for an accurate
graph. The graphs meet and form a
complete circle, even though it might
not appear that way on the calculator.
The graph is a circle with center (1, 1)
and intercepts (1,0) and (0, 1).
Check Use a table to
confirm the intercepts.
4x
2
+ 25y
2
= 100
Step 1 Solve for y so that the expression can be
used in a graphing calculator.
Subtract 4x
2
from both sides.25y
2
= 100 – 4x
2
Take the square root of both
sides.
y
2
= 100 – 4x
2
25
Divide both sides by 25.
Example 1B: Graphing Circles and Ellipses on a
Calculator
Step 2 Use two equations to see the complete graph.
Use a square window on your graphing
calculator for an accurate graph. The
graphs meet and form a complete ellipse,
even though it might not appear that way
on the calculator.
The graph is an ellipse with center (0, 0)
and intercepts (±5, 0) and (0, ±2).
Check Use a table to
confirm the intercepts.
Example 1B Continued
Graph each equation on a graphing calculator.
Identify each conic section. Then describe the
center and intercepts.
x
2
+ y
2
= 49
Step 1 Solve for y so that the expression can be
used in a graphing calculator.
Check It Out! Example 1a
Step 2 Use two equations to see the complete graph.
Check Use a table to
confirm the intercepts.
Check It Out! Example 1a Continued
9x
2
+ 25y
2
= 225
Step 1 Solve for y so that the expression can be
used in a graphing calculator.
Check It Out! Example 1b
Step 2 Use two equations to see the complete graph.
Check Use a table to
confirm the intercepts.
Check It Out! Example 1b Continued
A parabola is a single curve, whereas a hyperbola
has two congruent branches. The equation of a
parabola usually contains either an x
2
term or a y
2
term, but not both. The equations of the other
conics will usually contain both x
2
and y
2
terms.
Because hyperbolas contain two curves that open
in opposite directions, classify them as opening
horizontally, vertically, or neither.
Helpful Hint
Graph each equation on a graphing calculator.
Identify each conic section. Then describe the
vertices and the direction that the graph opens.
Example 2A: Graphing Parabolas and Hyperbolas on a
Calculator
Step 1 Solve for y so that the expression can be
used in a graphing calculator.
y = – x
21
2
y = – x
21
2
Example 2A Continued
Step 2 Use the equation to see the complete graph.
The graph is a parabola
with vertex (0, 0) that
opens downward.
y = – x
21
2
Example 2B
Step 1 Solve for y so that the expression can be
used in a graphing calculator.
y
2
– x
2
= 9
y
2
= 9 + x
2
Add x
2
to both sides.
Take the square root of both
sides.
Example 2B Continued
Step 2 Use two equations to see the complete graph.
The graph is a hyperbola
that opens vertically
with vertices at (0, ±3).
and
Graph each equation on a graphing calculator.
Identify each conic section. Then describe the
vertices and the direction that the graph opens.
Step 1 Solve for y so that the expression can be
used in a graphing calculator.
2y
2
= x
Check It Out! Example 2a
Step 2 Use two equations to see the complete graph.
Check It Out! Example 2a Continued
Step 1 Solve for y so that the expression can be
used in a graphing calculator.
x
2
– y
2
= 16
Check It Out! Example 2b
Step 2 Use two equations to see the complete graph.
Check It Out! Example 2b Continued
Every conic section can be defined in terms of
distances. You can use the Midpoint and Distance
Formulas to find the center and radius of a circle.
Because a diameter must
pass through the center of
a circle, the midpoint of a
diameter is the center of
the circle. The radius of a
circle is the distance from
the center to any point on
the circle and equal to half
the diameter.
The midpoint formula uses averages. You can
think of xM as the average of the x-values and yM
as the average of the y-values.
Helpful Hint
Find the center and radius of a circle that has
a diameter with endpoints (5, 4) and (0, –8).
Example 3: Finding the Center and Radius of a Circle
Step 1 Find the center of the circle.
Use the Midpoint Formula with the endpoints
(5, 4) and (0, –8).
( , ) = (2.5, –2)5 + 0
2
4 – 8
2
Example 3 Continued
Step 2 Find the radius.
Use the Distance Formula with (2.5, –2) and
(0, –8)
The radius of the circle is 6.5
Check Use the other endpoint (5, 4) and the
center (2.5, –2). The radius should equal 6.5 for
any point on the circle.
The radius is the same using (5, 4).
r = ( 5 – 2.5)2
+ (4 – (–2))2
Find the center and radius of a circle that has
a diameter with endpoints (2, 6) and (14, 22).
Step 1 Find the center of the circle.
Check It Out! Example 3
Step 2 Find the radius.
Check Use the other endpoint (2, 6) and the
center (8, 14). The radius should equal 10 for any
point on the circle.

Check It Out! Example 3 Continued
Lesson Quiz: Part I
Graph each equation on a graphing calculator.
Identify each conic section. Then describe the
center and intercepts for circles and ellipses, or
the vertices and direction that the graph opens for
parabolas and hyperbolas.
1. x
2
– 16y
2
= 16
2. 4x
2
+ 49y
2
= 196
3. x = 6y
2
4. x
2
+ y
2
= 0.25
Lesson Quiz: Part II
5. Find the center and radius of a circle that
has a diameter with endpoints (3, 7) and
(–2, –5).
All rights belong to their respective owners.
Copyright Disclaimer Under Section 107 of
the Copyright Act 1976, allowance is made
for "fair use" for purposes such as criticism,
comment, news reporting, TEACHING,
scholarship, and research.
Fair use is a use permitted by copyright
statute that might otherwise be infringing.
Non-profit, EDUCATIONAL or personal use
tips the balance in favor of fair use.

Unit 13.1

  • 1.
    UNIT 13.1 CONICSECTIONUNIT 13.1 CONIC SECTION BASICSBASICS
  • 2.
    Warm Up Solve fory. 1. x 2 + y 2 = 1 2. 4x 2 – 9y 2 = 1
  • 3.
    Recognize conic sectionsas intersections of planes and cones. Use the distance and midpoint formulas to solve problems. Objectives
  • 4.
  • 5.
    In Chapter 5,you studied the parabola. The parabola is one of a family of curves called conic sections. Conic sections are formed by the intersection of a double right cone and a plane. There are four types of conic sections: circles, ellipses, hyperbolas, and parabolas. Although the parabolas you studied in Chapter 5 are functions, most conic sections are not. This means that you often must use two functions to graph a conic section on a calculator.
  • 6.
    When you takethe square root of both sides of an equation, remember that you must include the positive and negative roots. Remember! A circle is defined by its center and its radius. An ellipse, an elongated shape similar to a circle, has two perpendicular axes of different lengths.
  • 7.
    Graph each equationon a graphing calculator. Identify each conic section. Then describe the center and intercepts. Example 1A: Graphing Circles and Ellipses on a Calculator (x – 1) 2 + (y – 1) 2 = 1 Step 1 Solve for y so that the expression can be used in a graphing calculator. Subtract (x – 1) 2 from both sides.(y – 1) 2 = 1 – (x – 1) 2 Take square root of both sides. Then add 1 to both sides.
  • 8.
    Example 1A Continued Step2 Use two equations to see the complete graph. Use a square window on your graphing calculator for an accurate graph. The graphs meet and form a complete circle, even though it might not appear that way on the calculator. The graph is a circle with center (1, 1) and intercepts (1,0) and (0, 1). Check Use a table to confirm the intercepts.
  • 9.
    4x 2 + 25y 2 = 100 Step1 Solve for y so that the expression can be used in a graphing calculator. Subtract 4x 2 from both sides.25y 2 = 100 – 4x 2 Take the square root of both sides. y 2 = 100 – 4x 2 25 Divide both sides by 25. Example 1B: Graphing Circles and Ellipses on a Calculator
  • 10.
    Step 2 Usetwo equations to see the complete graph. Use a square window on your graphing calculator for an accurate graph. The graphs meet and form a complete ellipse, even though it might not appear that way on the calculator. The graph is an ellipse with center (0, 0) and intercepts (±5, 0) and (0, ±2). Check Use a table to confirm the intercepts. Example 1B Continued
  • 11.
    Graph each equationon a graphing calculator. Identify each conic section. Then describe the center and intercepts. x 2 + y 2 = 49 Step 1 Solve for y so that the expression can be used in a graphing calculator. Check It Out! Example 1a
  • 12.
    Step 2 Usetwo equations to see the complete graph. Check Use a table to confirm the intercepts. Check It Out! Example 1a Continued
  • 13.
    9x 2 + 25y 2 = 225 Step1 Solve for y so that the expression can be used in a graphing calculator. Check It Out! Example 1b
  • 14.
    Step 2 Usetwo equations to see the complete graph. Check Use a table to confirm the intercepts. Check It Out! Example 1b Continued
  • 15.
    A parabola isa single curve, whereas a hyperbola has two congruent branches. The equation of a parabola usually contains either an x 2 term or a y 2 term, but not both. The equations of the other conics will usually contain both x 2 and y 2 terms. Because hyperbolas contain two curves that open in opposite directions, classify them as opening horizontally, vertically, or neither. Helpful Hint
  • 16.
    Graph each equationon a graphing calculator. Identify each conic section. Then describe the vertices and the direction that the graph opens. Example 2A: Graphing Parabolas and Hyperbolas on a Calculator Step 1 Solve for y so that the expression can be used in a graphing calculator. y = – x 21 2 y = – x 21 2
  • 17.
    Example 2A Continued Step2 Use the equation to see the complete graph. The graph is a parabola with vertex (0, 0) that opens downward. y = – x 21 2
  • 18.
    Example 2B Step 1Solve for y so that the expression can be used in a graphing calculator. y 2 – x 2 = 9 y 2 = 9 + x 2 Add x 2 to both sides. Take the square root of both sides.
  • 19.
    Example 2B Continued Step2 Use two equations to see the complete graph. The graph is a hyperbola that opens vertically with vertices at (0, ±3). and
  • 20.
    Graph each equationon a graphing calculator. Identify each conic section. Then describe the vertices and the direction that the graph opens. Step 1 Solve for y so that the expression can be used in a graphing calculator. 2y 2 = x Check It Out! Example 2a
  • 21.
    Step 2 Usetwo equations to see the complete graph. Check It Out! Example 2a Continued
  • 22.
    Step 1 Solvefor y so that the expression can be used in a graphing calculator. x 2 – y 2 = 16 Check It Out! Example 2b
  • 23.
    Step 2 Usetwo equations to see the complete graph. Check It Out! Example 2b Continued
  • 24.
    Every conic sectioncan be defined in terms of distances. You can use the Midpoint and Distance Formulas to find the center and radius of a circle.
  • 25.
    Because a diametermust pass through the center of a circle, the midpoint of a diameter is the center of the circle. The radius of a circle is the distance from the center to any point on the circle and equal to half the diameter. The midpoint formula uses averages. You can think of xM as the average of the x-values and yM as the average of the y-values. Helpful Hint
  • 26.
    Find the centerand radius of a circle that has a diameter with endpoints (5, 4) and (0, –8). Example 3: Finding the Center and Radius of a Circle Step 1 Find the center of the circle. Use the Midpoint Formula with the endpoints (5, 4) and (0, –8). ( , ) = (2.5, –2)5 + 0 2 4 – 8 2
  • 27.
    Example 3 Continued Step2 Find the radius. Use the Distance Formula with (2.5, –2) and (0, –8) The radius of the circle is 6.5 Check Use the other endpoint (5, 4) and the center (2.5, –2). The radius should equal 6.5 for any point on the circle. The radius is the same using (5, 4). r = ( 5 – 2.5)2 + (4 – (–2))2
  • 28.
    Find the centerand radius of a circle that has a diameter with endpoints (2, 6) and (14, 22). Step 1 Find the center of the circle. Check It Out! Example 3
  • 29.
    Step 2 Findthe radius. Check Use the other endpoint (2, 6) and the center (8, 14). The radius should equal 10 for any point on the circle.  Check It Out! Example 3 Continued
  • 30.
    Lesson Quiz: PartI Graph each equation on a graphing calculator. Identify each conic section. Then describe the center and intercepts for circles and ellipses, or the vertices and direction that the graph opens for parabolas and hyperbolas. 1. x 2 – 16y 2 = 16 2. 4x 2 + 49y 2 = 196 3. x = 6y 2 4. x 2 + y 2 = 0.25
  • 31.
    Lesson Quiz: PartII 5. Find the center and radius of a circle that has a diameter with endpoints (3, 7) and (–2, –5).
  • 32.
    All rights belongto their respective owners. Copyright Disclaimer Under Section 107 of the Copyright Act 1976, allowance is made for "fair use" for purposes such as criticism, comment, news reporting, TEACHING, scholarship, and research. Fair use is a use permitted by copyright statute that might otherwise be infringing. Non-profit, EDUCATIONAL or personal use tips the balance in favor of fair use.