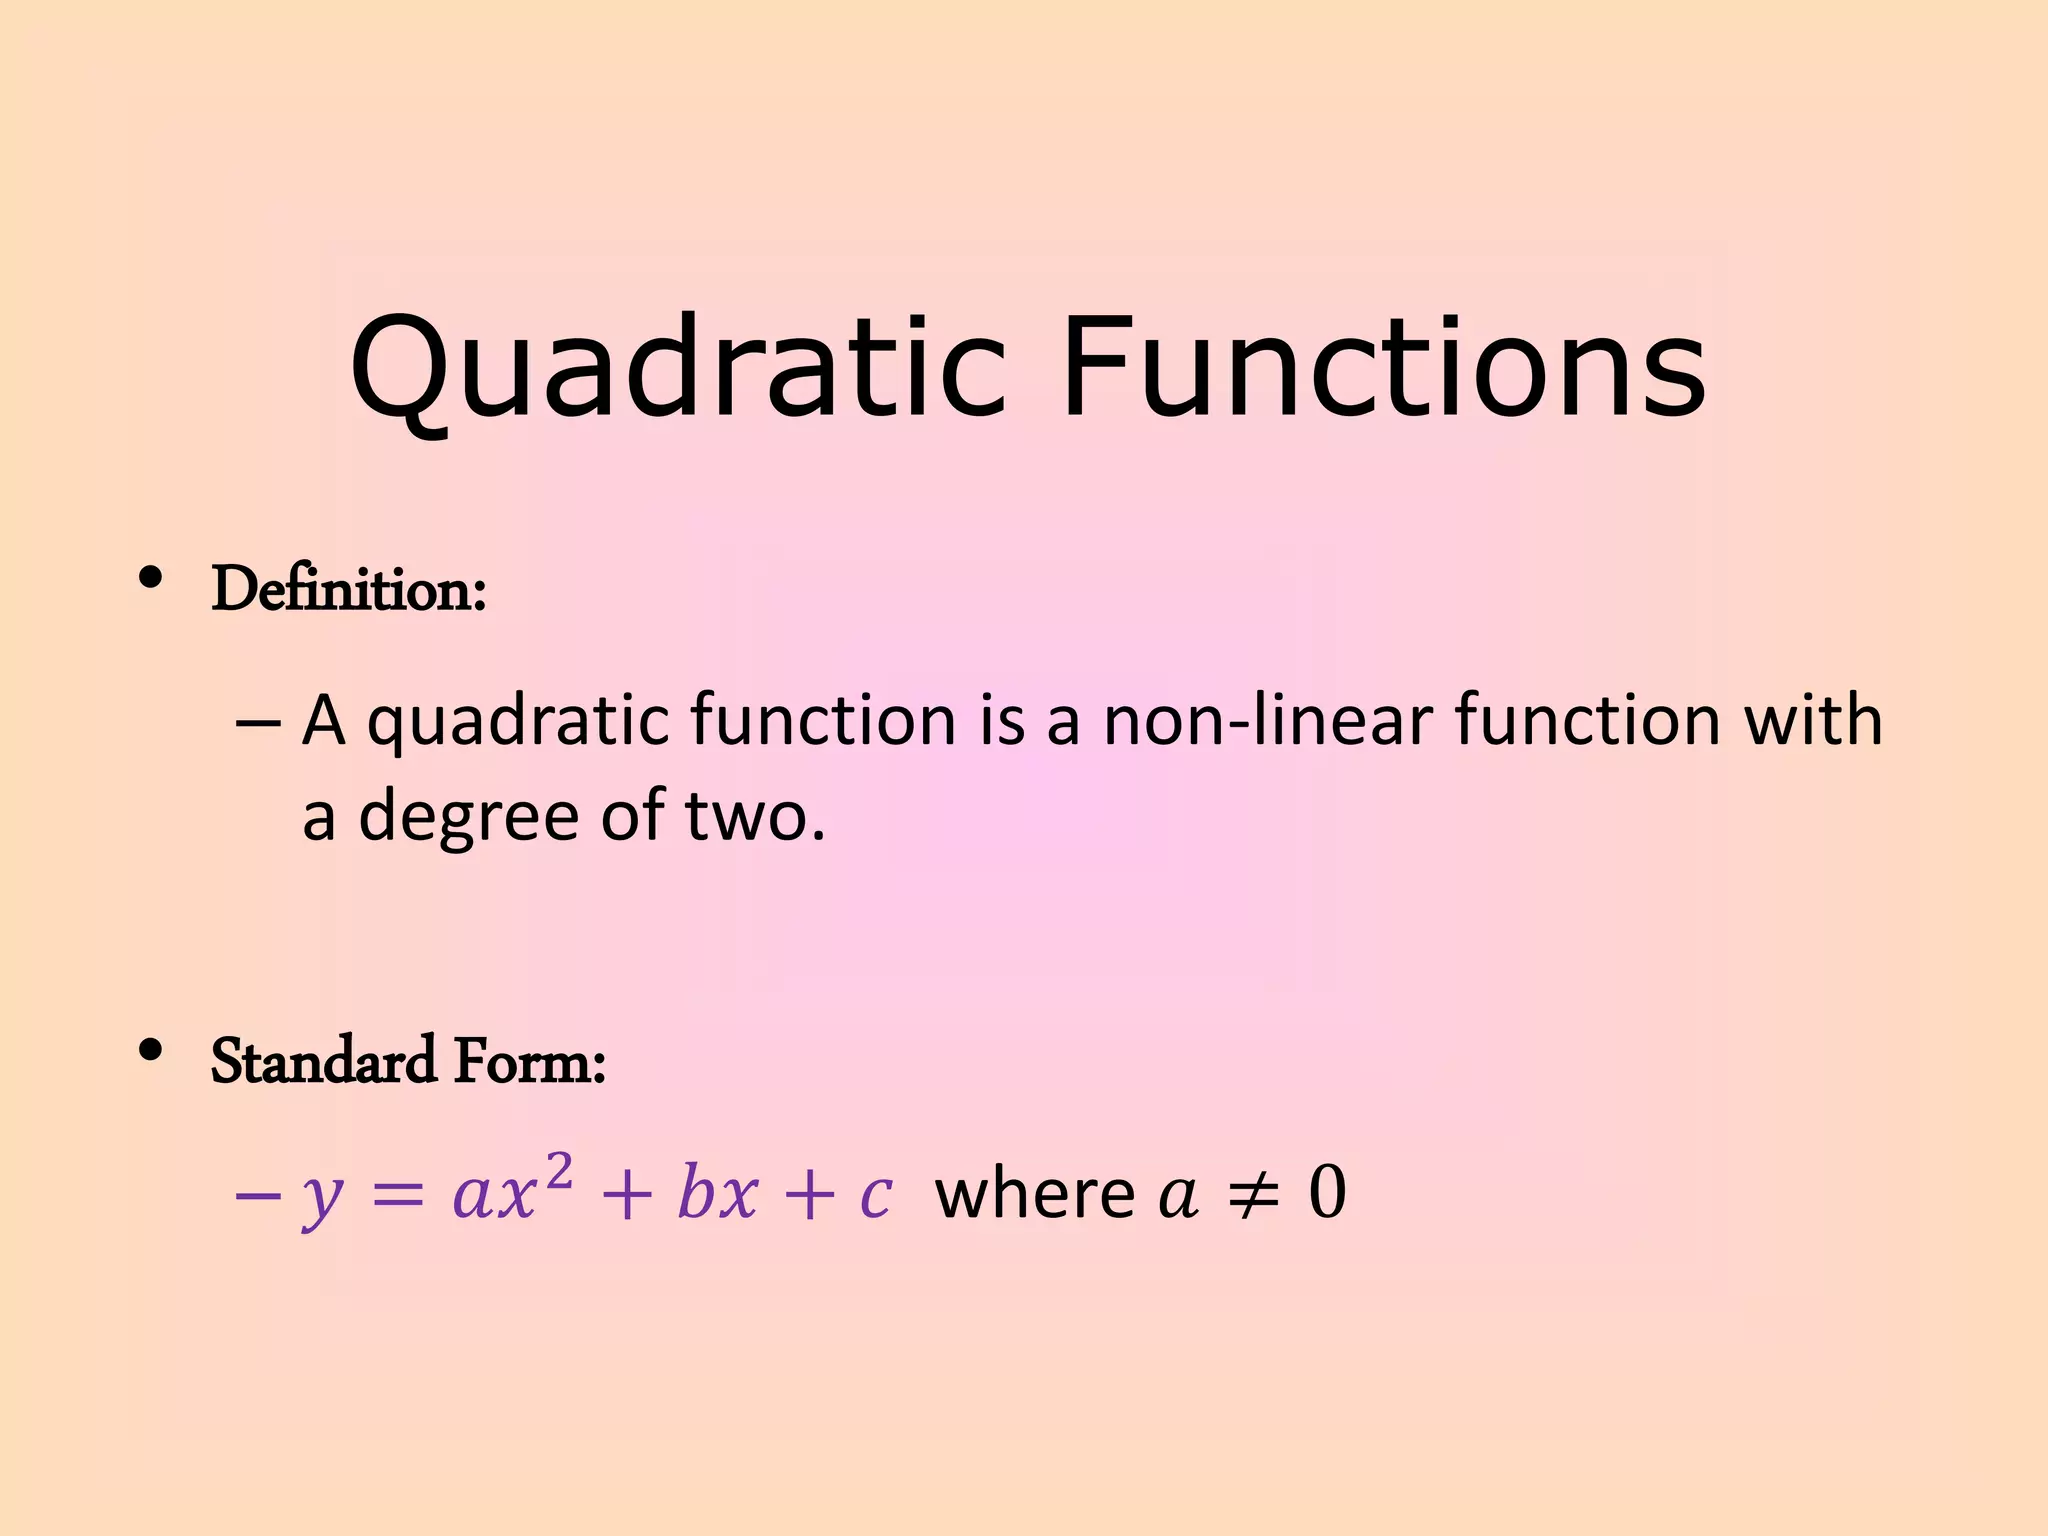
This document discusses graphing quadratic functions of the form y = ax^2 + bx + c. It provides the following key points:
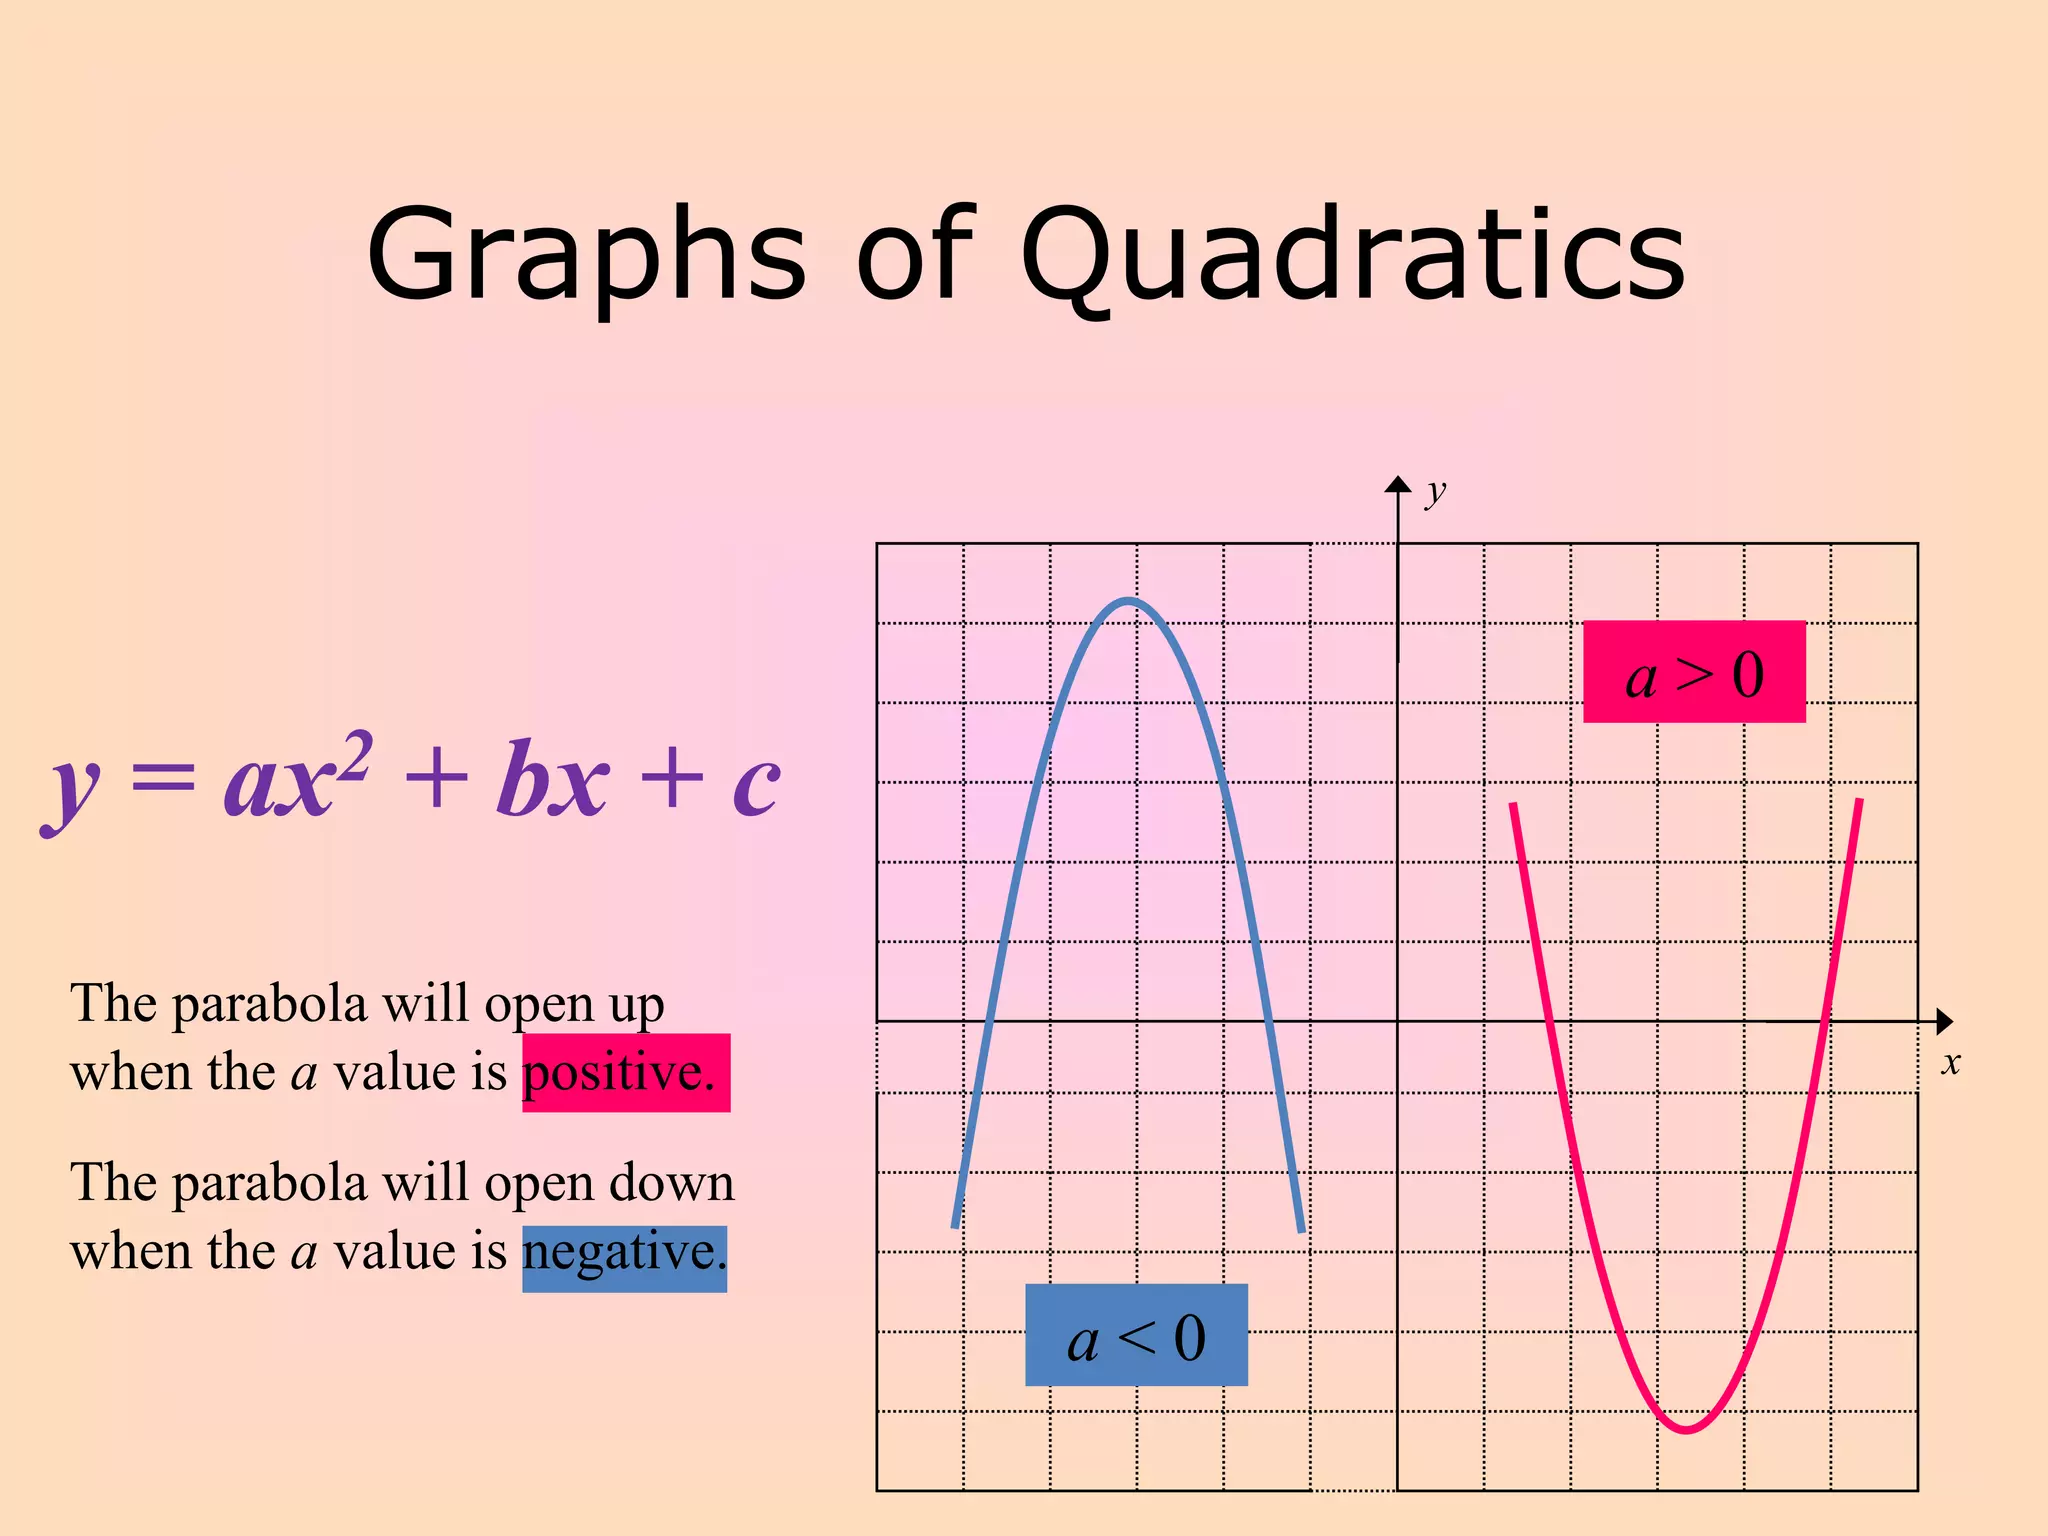
- Quadratic functions produce parabolic graphs that open up or down depending on whether a is positive or negative.
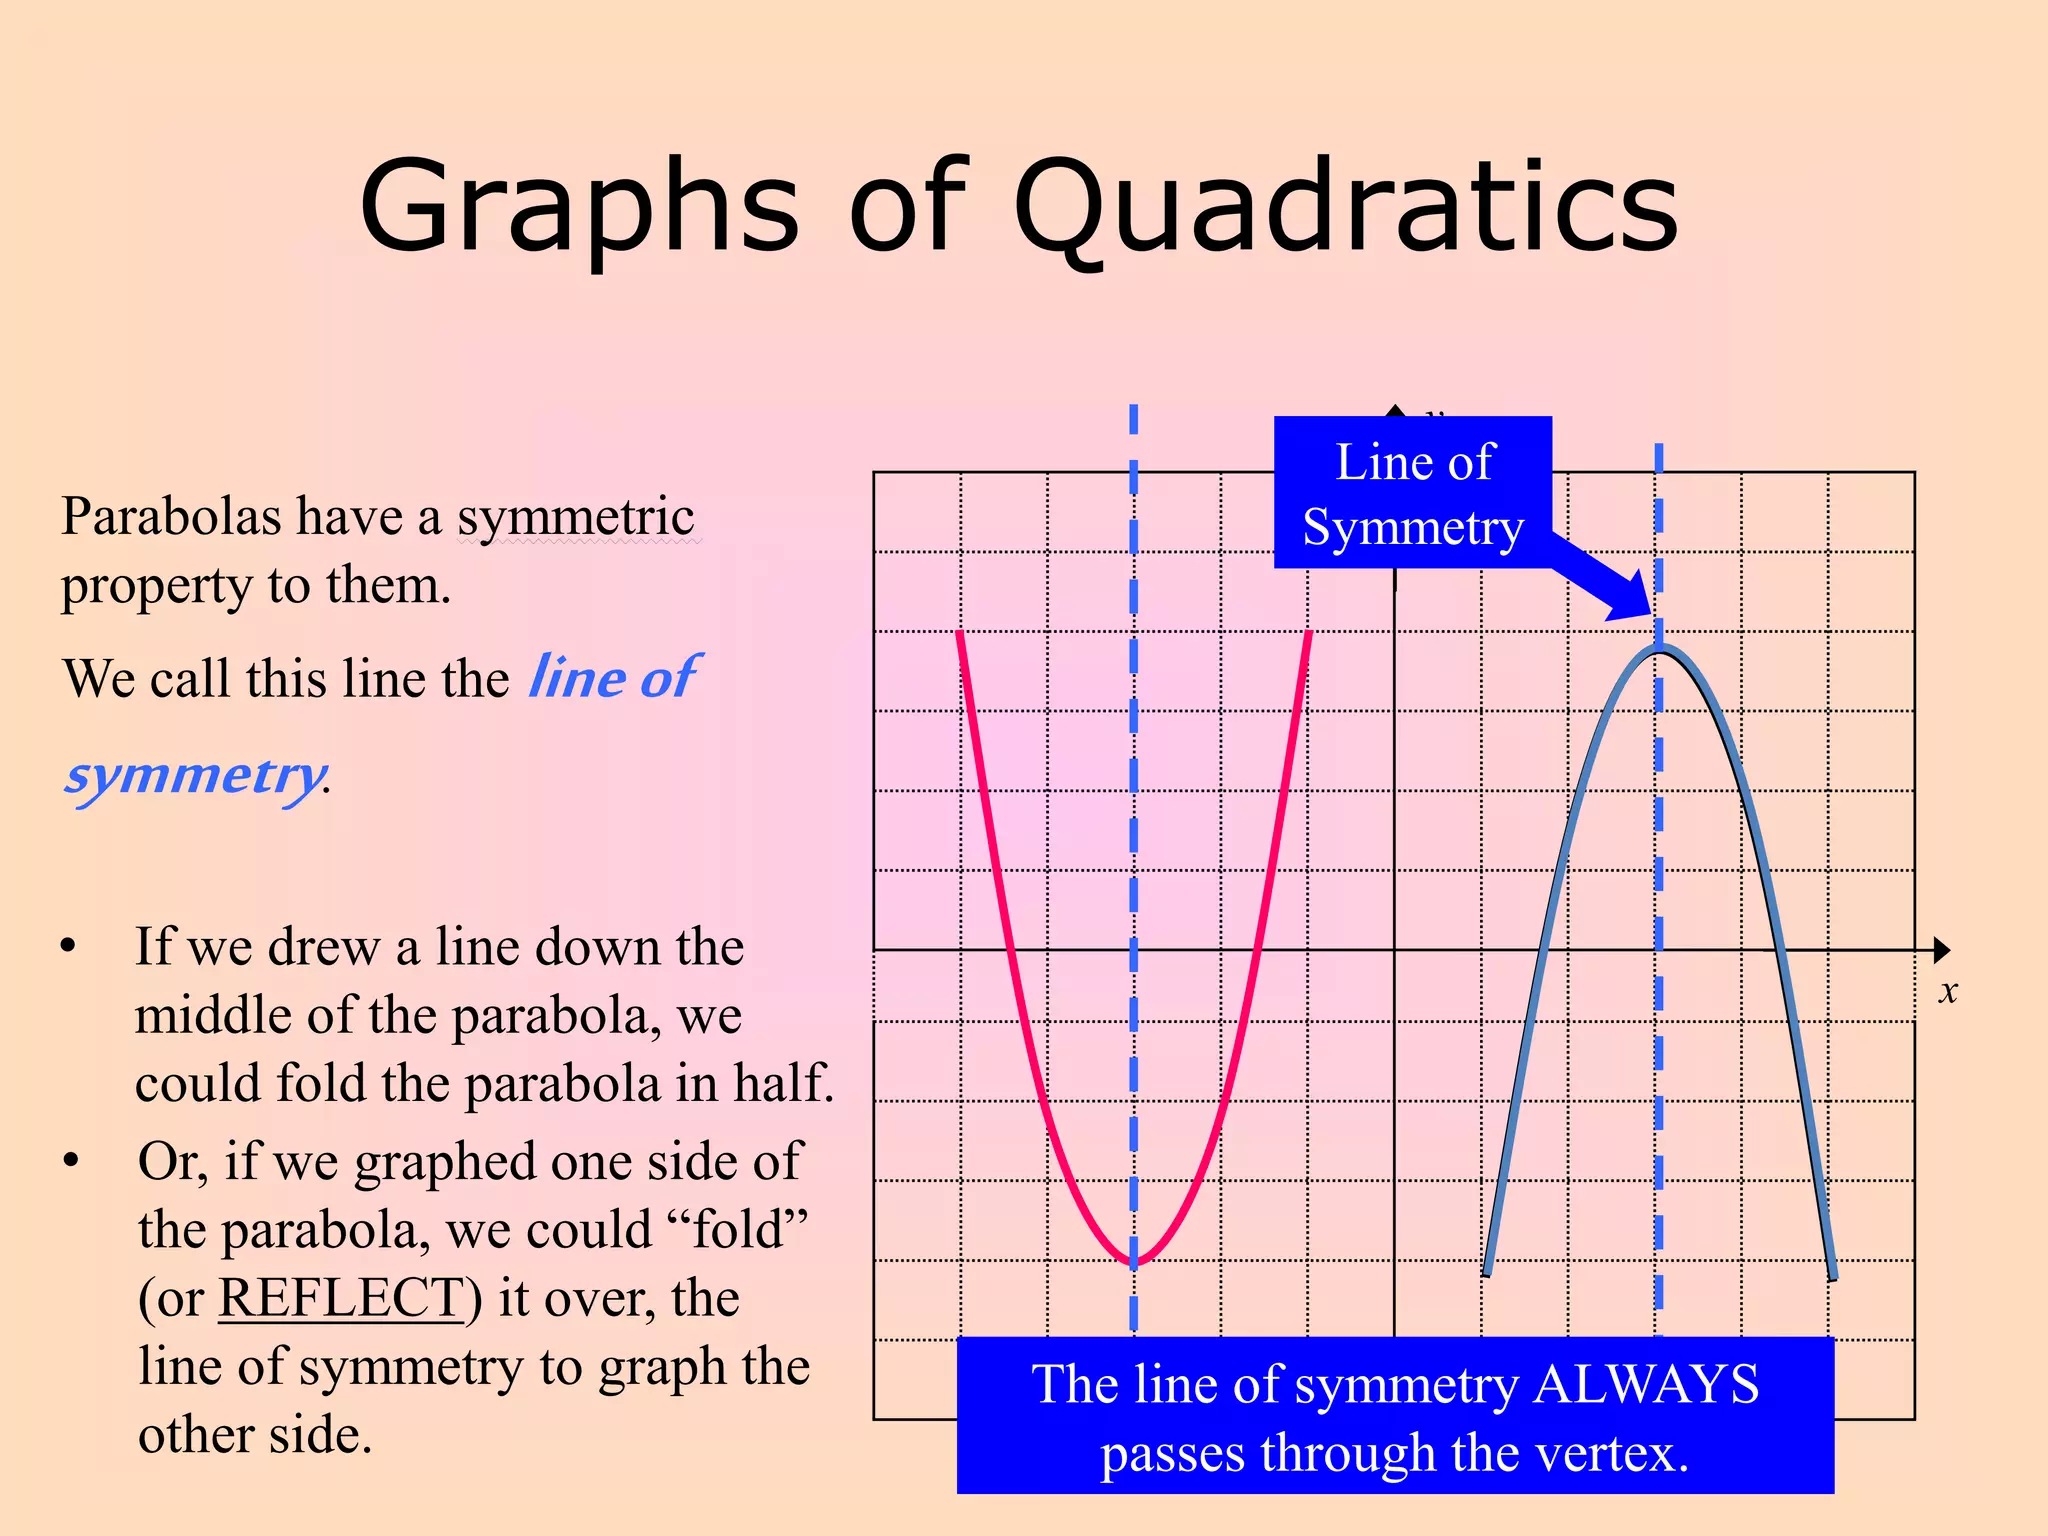
- The vertex of the parabola is the point of minimum or maximum, which corresponds to the line of symmetry that passes through it.
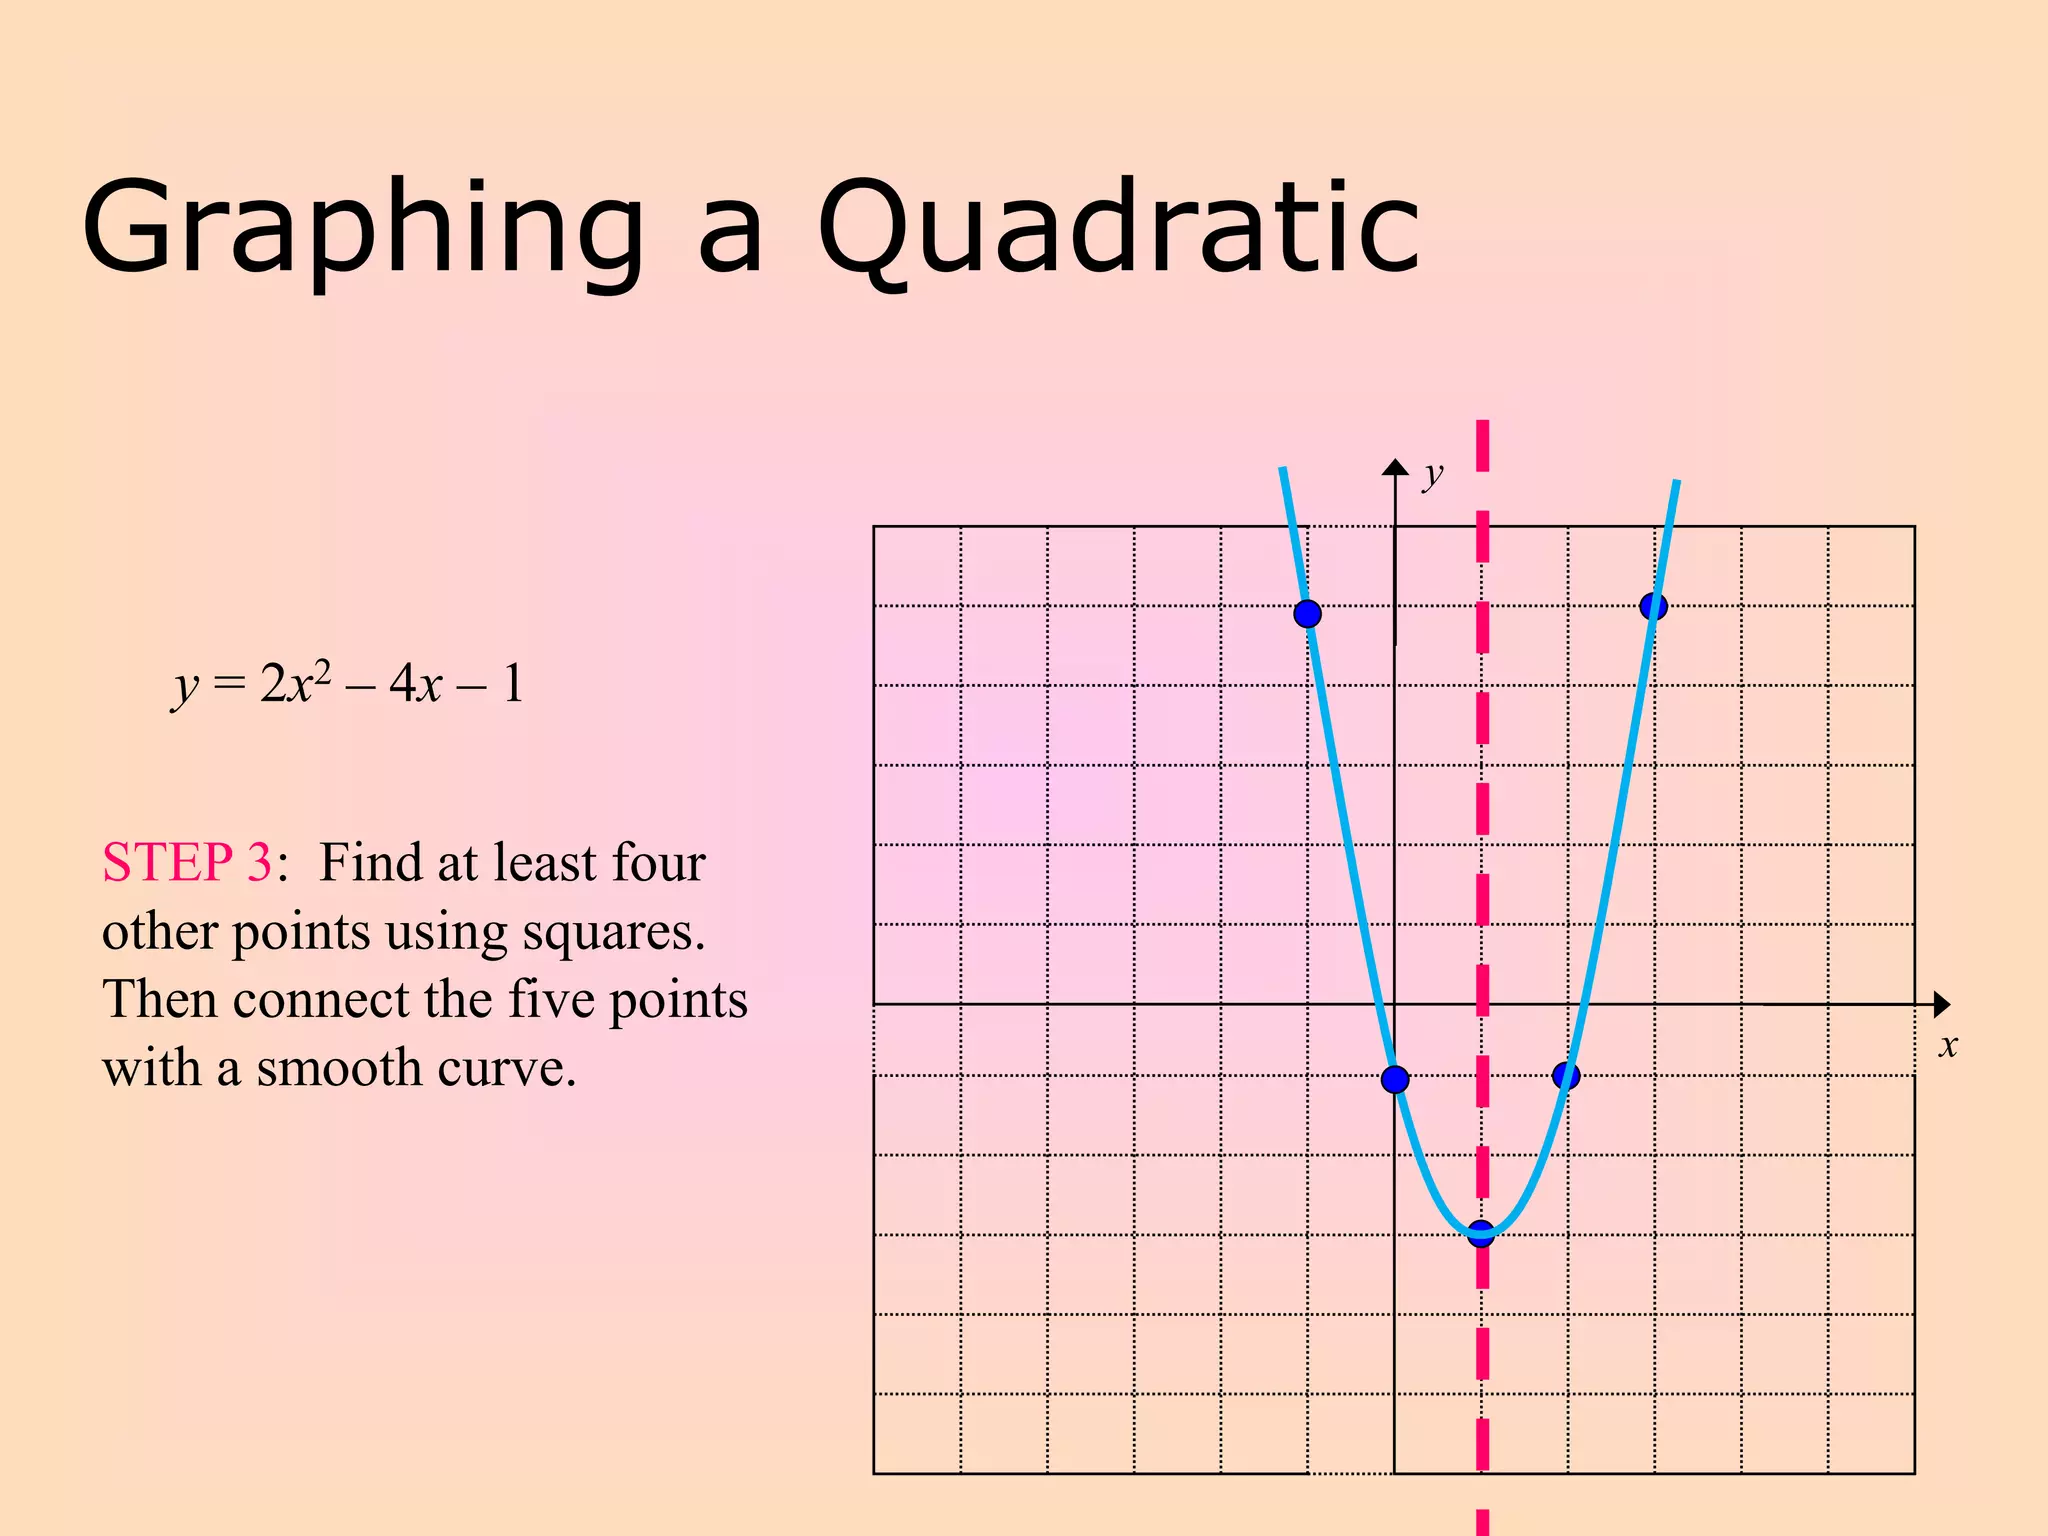
- To graph a quadratic, one finds the line of symmetry, determines the vertex coordinates, and plots at least four other points to connect into a smooth curve.


![y
x
Use the
vertex to
find the
restriction!
Remember: Domain is the set
of all x-values for the function.
Range is the set of all y-values
for the function.
Are there any restrictions
on the domain?
Are there any restrictions on
the range?
Graphs of Quadratics
No! (−∞, ∞)
Yes! (−∞, 𝟑]](https://image.slidesharecdn.com/graphingquadraticfunctionsstandardform-160406193944/75/Graphing-Quadratic-Functions-in-Standard-Form-7-2048.jpg)