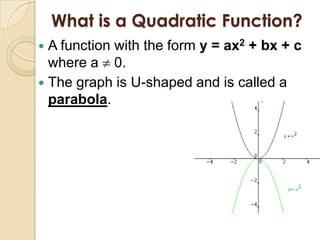
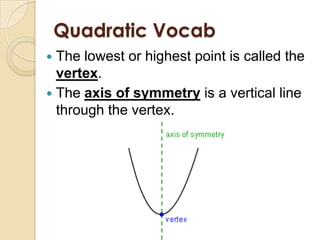
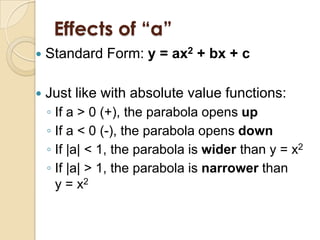
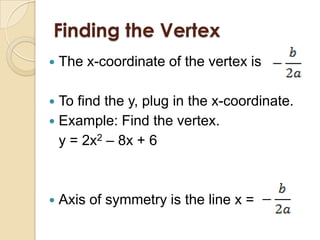
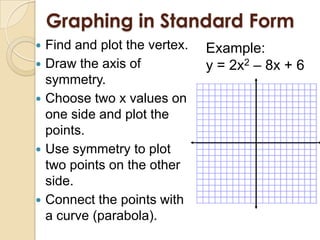
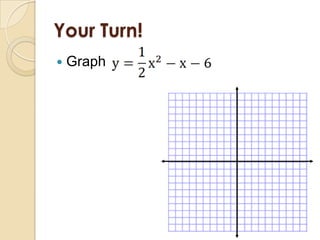
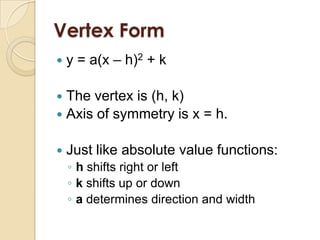
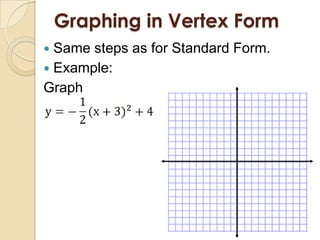
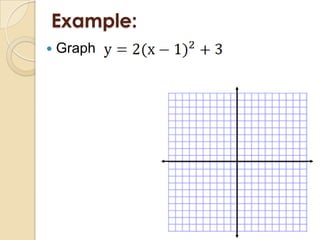
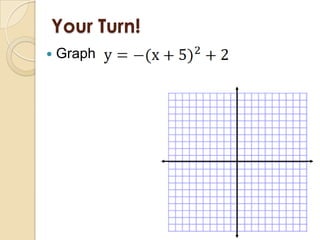
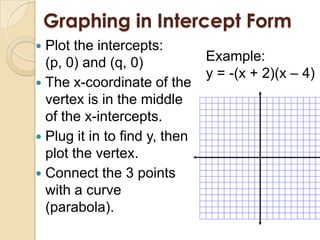
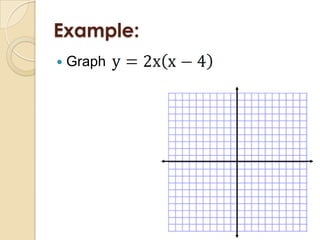
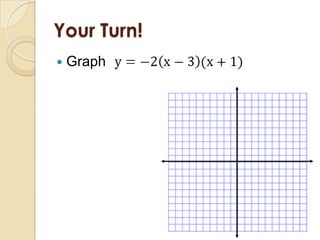
5.1 Graphing Quadratic
Functions
What is a Quadratic Function?
 A function with the form y = ax2 + bx + c
  where a 0.
 The graph is U-shaped and is called a
  parabola.
Why Study Quadratics?
 Many things we see every day are
  modeled by quadratic functions.
 What are some examples?
    ◦ Water in a drinking fountain
    ◦ The McDonald’s Golden Arches
    ◦ The path of a basketball
Quadratic Vocab
 The lowest or highest point is called the
  vertex.
 The axis of symmetry is a vertical line
  through the vertex.
Effects of “a”
   Standard Form: y = ax2 + bx + c

   Just like with absolute value functions:
    ◦ If a > 0 (+), the parabola opens up
    ◦ If a < 0 (-), the parabola opens down
    ◦ If |a| < 1, the parabola is wider than y = x2
    ◦ If |a| > 1, the parabola is narrower than
      y = x2
Finding the Vertex
   The x-coordinate of the vertex is

 To find the y, plug in the x-coordinate.
 Example: Find the vertex.
  y = 2x2 – 8x + 6


   Axis of symmetry is the line x =
Graphing in Standard Form
   Find and plot the vertex.   Example:
   Draw the axis of            y = 2x2 – 8x + 6
    symmetry.
   Choose two x values on
    one side and plot the
    points.
   Use symmetry to plot
    two points on the other
    side.
   Connect the points with
    a curve (parabola).
Example:
   Graph y = -x2 + 4x - 2
Your Turn!
   Graph
Vertex Form
   y = a(x – h)2 + k

 The vertex is (h, k)
 Axis of symmetry is x = h.


   Just like absolute value functions:
    ◦ h shifts right or left
    ◦ k shifts up or down
    ◦ a determines direction and width
Graphing in Vertex Form
 Same steps as for Standard Form.
 Example:
Graph
Example:
   Graph
Your Turn!
   Graph
Intercept Form
 y = a(x – p)(x – q)
 X-intercepts are p and q
 Axis of symmetry is halfway between
  (p, 0) and (q, 0).
Graphing in Intercept Form
 Plot the intercepts:
  (p, 0) and (q, 0)            Example:
                               y = -(x + 2)(x – 4)
 The x-coordinate of the
  vertex is in the middle
  of the x-intercepts.
 Plug it in to find y, then
  plot the vertex.
 Connect the 3 points
  with a curve
  (parabola).
Example:
   Graph
Your Turn!
   Graph
Writing in Standard Form
   Multiply! (Use FOIL)

 Example:
 Write in standard form:
Example:
   Write in standard form:
Your Turn!
 Write in standard form:
 1.


   2.

5.1 Graphing Quadratic Functions

  • 1.
  • 2.
    What is aQuadratic Function?  A function with the form y = ax2 + bx + c where a 0.  The graph is U-shaped and is called a parabola.
  • 3.
    Why Study Quadratics? Many things we see every day are modeled by quadratic functions.  What are some examples? ◦ Water in a drinking fountain ◦ The McDonald’s Golden Arches ◦ The path of a basketball
  • 4.
    Quadratic Vocab  Thelowest or highest point is called the vertex.  The axis of symmetry is a vertical line through the vertex.
  • 5.
    Effects of “a”  Standard Form: y = ax2 + bx + c  Just like with absolute value functions: ◦ If a > 0 (+), the parabola opens up ◦ If a < 0 (-), the parabola opens down ◦ If |a| < 1, the parabola is wider than y = x2 ◦ If |a| > 1, the parabola is narrower than y = x2
  • 6.
    Finding the Vertex  The x-coordinate of the vertex is  To find the y, plug in the x-coordinate.  Example: Find the vertex. y = 2x2 – 8x + 6  Axis of symmetry is the line x =
  • 7.
    Graphing in StandardForm  Find and plot the vertex. Example:  Draw the axis of y = 2x2 – 8x + 6 symmetry.  Choose two x values on one side and plot the points.  Use symmetry to plot two points on the other side.  Connect the points with a curve (parabola).
  • 8.
    Example:  Graph y = -x2 + 4x - 2
  • 9.
  • 10.
    Vertex Form  y = a(x – h)2 + k  The vertex is (h, k)  Axis of symmetry is x = h.  Just like absolute value functions: ◦ h shifts right or left ◦ k shifts up or down ◦ a determines direction and width
  • 11.
    Graphing in VertexForm  Same steps as for Standard Form.  Example: Graph
  • 12.
  • 13.
  • 14.
    Intercept Form  y= a(x – p)(x – q)  X-intercepts are p and q  Axis of symmetry is halfway between (p, 0) and (q, 0).
  • 15.
    Graphing in InterceptForm  Plot the intercepts: (p, 0) and (q, 0) Example: y = -(x + 2)(x – 4)  The x-coordinate of the vertex is in the middle of the x-intercepts.  Plug it in to find y, then plot the vertex.  Connect the 3 points with a curve (parabola).
  • 16.
  • 17.
  • 18.
    Writing in StandardForm  Multiply! (Use FOIL)  Example:  Write in standard form:
  • 19.
    Example:  Write in standard form:
  • 20.
    Your Turn!  Writein standard form:  1.  2.