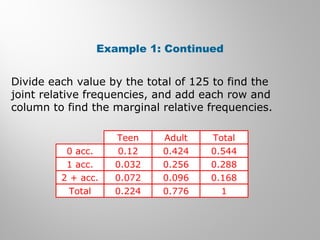
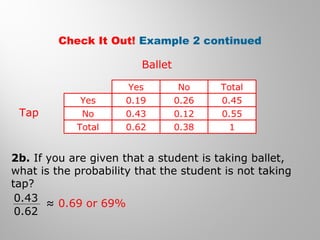
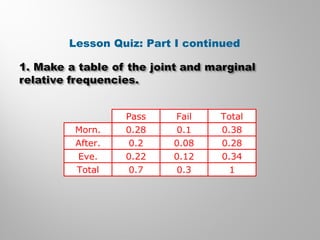
Holt Algebra 2
UNIT 11.4 CONDITIONALUNIT 11.4 CONDITIONAL
PROBABILITYPROBABILITY
Warm Up
A bag contains 4 red and 2 yellow marbles. A
marble is selected, kept out of the bag, and
another marble is selected. Find each
conditional probability of selecting the second
marble (create a tree diagram).
1. P(red | red) 2. P(red | yellow)
3. P(yellow | yellow) 4. P(yellow | red)
0.6 0.8
0.2 0.4
0.4
Continued : Warm Up
Construct and interpret two-way frequency
tables of data when two categories are
associated with each object being classified.
Objectives
joint relative frequency
marginal relative frequency
conditional relative frequency
Vocabulary
A two-way frequency table is a useful way to
organize data that can be categorized by two
variables. Suppose you asked 20 children and
adults whether they liked broccoli. The table shows
one way to arrange the data.
The joint relative frequencies
are the values in each category
divided by the total number of
values, shown by the shaded
cells in the table. Each value is
divided by 20, the total number
of individuals.
The marginal relative frequencies are found by
adding the joint relative frequencies in each row
and column.
Example 1: Finding Joint and Marginal Relative
Frequencies
The table shows the results of randomly selected
car insurance quotes for 125 cars made by an
insurance company in one week. Make a table of
the joint and marginal relative frequencies.
Example 1: Continued
Divide each value by the total of 125 to find the
joint relative frequencies, and add each row and
column to find the marginal relative frequencies.
Teen Adult Total
0 acc. 0.12 0.424 0.544
1 acc.
2 + acc.
Total
0.032 0.256 0.288
0.072 0.096 0.168
0.224 0.776 1
Check It Out! Example 1
The table shows the number of books sold at a
library sale. Make a table of the joint and
marginal relative frequencies.
Check It Out! Example 1 Continued
Divide each value by the total of 210 to find the joint
relative frequencies, and add each row and column
to find the marginal relative frequencies.
Fiction Nonfiction Total
Hardcover 0.133 0.248 0.381
Paperback
Total
0.448 0.171 0.619
0.581 0.419 1
Example 2: Using Conditional Relative Frequency to
Find Probability
A reporter asked 150 voters if they plan to vote
in favor of a new library and a new arena. The
table shows the results.
Example 2A Continued
Yes No Total
Yes 0.14 0.2 0.34
No
Total
0.38 0.28 0.66
0.52 0.48 1
Library
Arena
A. Make a table of the joint and marginal relative
frequencies.
Example 2B Continued
0.28 ≈ 0.58
0.48
The classes at a dance academy include ballet
and tap dancing. Enrollment in these classes is
shown in the table.
Check It Out! Example 2
2a. Copy and complete the table of the joint relative
frequencies and marginal relative frequencies.
2b. If you are given that a student is taking ballet,
what is the probability that the student is not taking
tap?
Check It Out! Example 2 continued
Yes No Total
Yes 0.19 0.26 0.45
No
Total
0.43 0.12 0.55
0.62 0.38 1
Ballet
Tap
≈ 0.69 or 69%
0.43
0.62
Example 3: Comparing Conditional Probabilities
Use conditional probabilities to determine for
which method a customer is most likely to pay
with a gift card.
P(gift card if in store) = 0.4
P(gift card if online) ≈ 0.41
P(gift card if by catalog) ≈ 0.38
so most likely if buying online.
Example 3 Continued
A customer is most likely to pay with a gift card if
buying online.
Gift Card Another
Method
TOTAL
Store 0.12 0.18 0.30
Online 0.18 0.26 0.44
Catalog 0.10 0.16 0.26
TOTAL 0.40 0.60 1
Check It Out! Example 3
Francine is evaluating three driving schools. She
asked 50 people who attended the schools
whether they passed their driving tests on the
first try. Use conditional probabilities to
determine which is the best school.
Use conditional probabilities to determine
which is the best school.
Check It Out! Example 3 Continued
Pass Fail TOTAL
Al’s Driving 0.28 0.16 0.44
Drive Time 0.22 0.14 0.36
Crash
Course
0.10 0.10 0.20
TOTAL 0.60 0.40 1
Al’s Driving has the best pass rate, about 64%,
versus 61% for Drive Time and 50% for Crash
Course.
Lesson Quiz: Part I
1. At a juice-bottling factory, quality-control
technicians randomly select bottles and mark
them pass or fail. The manager randomly selects
the results of 50 tests and organizes the data by
shift and result. The table below shows these
results.
Lesson Quiz: Part I continued
Pass Fail Total
Morn. 0.28 0.1 0.38
After.
Eve.
Total
0.2 0.08 0.28
0.22 0.12 0.34
0.7 0.3 1
Lesson Quiz: Part 2
2. Find the probability that a bottle was
inspected in the afternoon given that it
failed the inspection.
≈
0.08
0.3
0.27
Lesson Quiz: Part 3
P(pass if in morning) ≈ 0.74,
P(pass if in afternoon) ≈ 0.71,
P(pass if in evening) ≈ 0.65,
so most likely to pass in the
morning
All rights belong to their
respective owners.
Copyright Disclaimer Under
Section 107 of the
Copyright Act 1976,
allowance is made for "fair
use" for purposes such as
criticism, comment, news
reporting, TEACHING,
scholarship, and research.
Fair use is a use permitted
by copyright statute that
might otherwise be
infringing.
Non-profit, EDUCATIONAL
or personal use tips the
balance in favor of fair use.

Algebra 302 unit 11.4

  • 1.
    Holt Algebra 2 UNIT11.4 CONDITIONALUNIT 11.4 CONDITIONAL PROBABILITYPROBABILITY
  • 2.
    Warm Up A bagcontains 4 red and 2 yellow marbles. A marble is selected, kept out of the bag, and another marble is selected. Find each conditional probability of selecting the second marble (create a tree diagram). 1. P(red | red) 2. P(red | yellow) 3. P(yellow | yellow) 4. P(yellow | red) 0.6 0.8 0.2 0.4
  • 3.
  • 4.
    Construct and interprettwo-way frequency tables of data when two categories are associated with each object being classified. Objectives
  • 5.
    joint relative frequency marginalrelative frequency conditional relative frequency Vocabulary
  • 6.
    A two-way frequencytable is a useful way to organize data that can be categorized by two variables. Suppose you asked 20 children and adults whether they liked broccoli. The table shows one way to arrange the data. The joint relative frequencies are the values in each category divided by the total number of values, shown by the shaded cells in the table. Each value is divided by 20, the total number of individuals.
  • 7.
    The marginal relativefrequencies are found by adding the joint relative frequencies in each row and column.
  • 9.
    Example 1: FindingJoint and Marginal Relative Frequencies The table shows the results of randomly selected car insurance quotes for 125 cars made by an insurance company in one week. Make a table of the joint and marginal relative frequencies.
  • 10.
    Example 1: Continued Divideeach value by the total of 125 to find the joint relative frequencies, and add each row and column to find the marginal relative frequencies. Teen Adult Total 0 acc. 0.12 0.424 0.544 1 acc. 2 + acc. Total 0.032 0.256 0.288 0.072 0.096 0.168 0.224 0.776 1
  • 11.
    Check It Out!Example 1 The table shows the number of books sold at a library sale. Make a table of the joint and marginal relative frequencies.
  • 12.
    Check It Out!Example 1 Continued Divide each value by the total of 210 to find the joint relative frequencies, and add each row and column to find the marginal relative frequencies. Fiction Nonfiction Total Hardcover 0.133 0.248 0.381 Paperback Total 0.448 0.171 0.619 0.581 0.419 1
  • 13.
    Example 2: UsingConditional Relative Frequency to Find Probability A reporter asked 150 voters if they plan to vote in favor of a new library and a new arena. The table shows the results.
  • 14.
    Example 2A Continued YesNo Total Yes 0.14 0.2 0.34 No Total 0.38 0.28 0.66 0.52 0.48 1 Library Arena A. Make a table of the joint and marginal relative frequencies.
  • 15.
  • 16.
    The classes ata dance academy include ballet and tap dancing. Enrollment in these classes is shown in the table. Check It Out! Example 2 2a. Copy and complete the table of the joint relative frequencies and marginal relative frequencies.
  • 17.
    2b. If youare given that a student is taking ballet, what is the probability that the student is not taking tap? Check It Out! Example 2 continued Yes No Total Yes 0.19 0.26 0.45 No Total 0.43 0.12 0.55 0.62 0.38 1 Ballet Tap ≈ 0.69 or 69% 0.43 0.62
  • 18.
    Example 3: ComparingConditional Probabilities Use conditional probabilities to determine for which method a customer is most likely to pay with a gift card.
  • 19.
    P(gift card ifin store) = 0.4 P(gift card if online) ≈ 0.41 P(gift card if by catalog) ≈ 0.38 so most likely if buying online. Example 3 Continued A customer is most likely to pay with a gift card if buying online. Gift Card Another Method TOTAL Store 0.12 0.18 0.30 Online 0.18 0.26 0.44 Catalog 0.10 0.16 0.26 TOTAL 0.40 0.60 1
  • 20.
    Check It Out!Example 3 Francine is evaluating three driving schools. She asked 50 people who attended the schools whether they passed their driving tests on the first try. Use conditional probabilities to determine which is the best school. Use conditional probabilities to determine which is the best school.
  • 21.
    Check It Out!Example 3 Continued Pass Fail TOTAL Al’s Driving 0.28 0.16 0.44 Drive Time 0.22 0.14 0.36 Crash Course 0.10 0.10 0.20 TOTAL 0.60 0.40 1 Al’s Driving has the best pass rate, about 64%, versus 61% for Drive Time and 50% for Crash Course.
  • 22.
    Lesson Quiz: PartI 1. At a juice-bottling factory, quality-control technicians randomly select bottles and mark them pass or fail. The manager randomly selects the results of 50 tests and organizes the data by shift and result. The table below shows these results.
  • 23.
    Lesson Quiz: PartI continued Pass Fail Total Morn. 0.28 0.1 0.38 After. Eve. Total 0.2 0.08 0.28 0.22 0.12 0.34 0.7 0.3 1
  • 24.
    Lesson Quiz: Part2 2. Find the probability that a bottle was inspected in the afternoon given that it failed the inspection. ≈ 0.08 0.3 0.27
  • 25.
    Lesson Quiz: Part3 P(pass if in morning) ≈ 0.74, P(pass if in afternoon) ≈ 0.71, P(pass if in evening) ≈ 0.65, so most likely to pass in the morning
  • 26.
    All rights belongto their respective owners. Copyright Disclaimer Under Section 107 of the Copyright Act 1976, allowance is made for "fair use" for purposes such as criticism, comment, news reporting, TEACHING, scholarship, and research. Fair use is a use permitted by copyright statute that might otherwise be infringing. Non-profit, EDUCATIONAL or personal use tips the balance in favor of fair use.