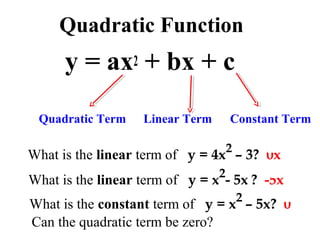
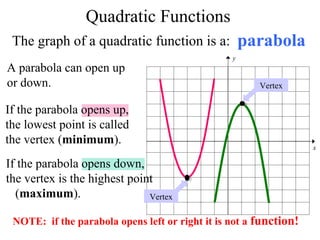
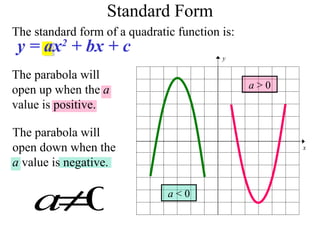
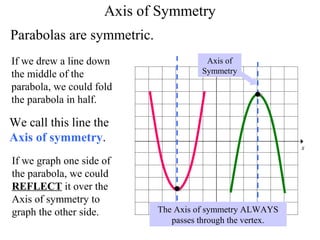
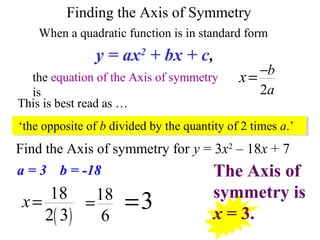
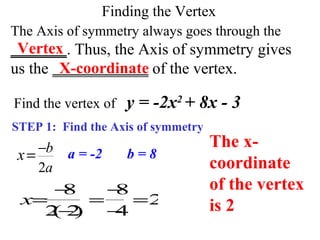
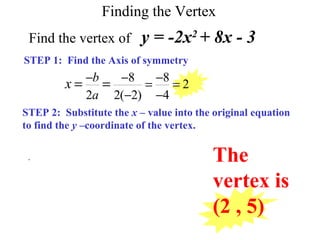
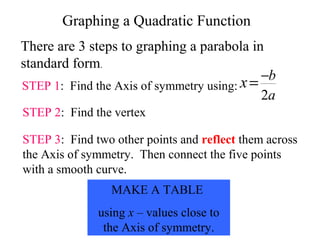
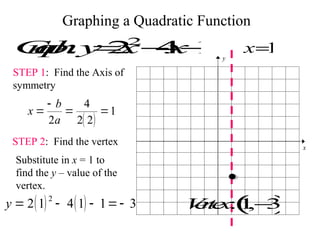
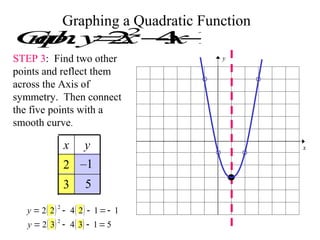
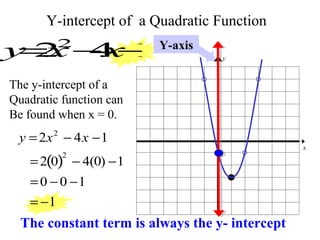
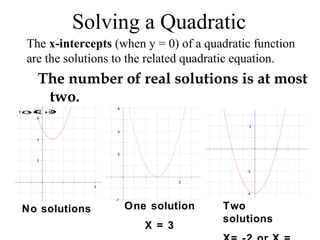
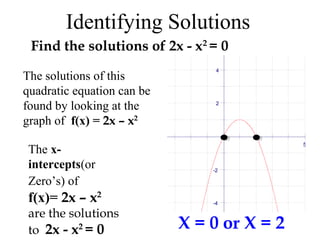
This document provides information about graphing quadratic functions. It defines the standard form of a quadratic function as y = ax^2 + bx + c and explains that the sign of a determines if the parabola opens up or down. It describes how to find the axis of symmetry, vertex, domain and range. The steps to graph a quadratic function are given as finding the axis of symmetry, the vertex, and then two other points to reflect across the axis and connect with a smooth curve. Methods for finding the axis of symmetry, vertex, y-intercept and solutions are demonstrated through examples.
This powerpoint presentation discusses or talks about the topic or lesson Functions. It also discusses and explains the rules, steps and examples of Quadratic Functions.
Finding the opening of the parabola, vertex, axis of symmetry, y-intercept, x- intercept, domain, range, and the minimum/maximum value including the illustration of the graph
We all have good and bad thoughts from time to time and situation to situation. We are bombarded daily with spiraling thoughts(both negative and positive) creating all-consuming feel , making us difficult to manage with associated suffering. Good thoughts are like our Mob Signal (Positive thought) amidst noise(negative thought) in the atmosphere. Negative thoughts like noise outweigh positive thoughts. These thoughts often create unwanted confusion, trouble, stress and frustration in our mind as well as chaos in our physical world. Negative thoughts are also known as “distorted thinking”.
Operation “Blue Star” is the only event in the history of Independent India where the state went into war with its own people. Even after about 40 years it is not clear if it was culmination of states anger over people of the region, a political game of power or start of dictatorial chapter in the democratic setup.
The people of Punjab felt alienated from main stream due to denial of their just demands during a long democratic struggle since independence. As it happen all over the word, it led to militant struggle with great loss of lives of military, police and civilian personnel. Killing of Indira Gandhi and massacre of innocent Sikhs in Delhi and other India cities was also associated with this movement.
How to Create Map Views in the Odoo 17 ERPCeline George
The map views are useful for providing a geographical representation of data. They allow users to visualize and analyze the data in a more intuitive manner.
Palestine last event orientationfvgnh .pptxRaedMohamed3
An EFL lesson about the current events in Palestine. It is intended to be for intermediate students who wish to increase their listening skills through a short lesson in power point.
This is a presentation by Dada Robert in a Your Skill Boost masterclass organised by the Excellence Foundation for South Sudan (EFSS) on Saturday, the 25th and Sunday, the 26th of May 2024.
He discussed the concept of quality improvement, emphasizing its applicability to various aspects of life, including personal, project, and program improvements. He defined quality as doing the right thing at the right time in the right way to achieve the best possible results and discussed the concept of the "gap" between what we know and what we do, and how this gap represents the areas we need to improve. He explained the scientific approach to quality improvement, which involves systematic performance analysis, testing and learning, and implementing change ideas. He also highlighted the importance of client focus and a team approach to quality improvement.
The Indian economy is classified into different sectors to simplify the analysis and understanding of economic activities. For Class 10, it's essential to grasp the sectors of the Indian economy, understand their characteristics, and recognize their importance. This guide will provide detailed notes on the Sectors of the Indian Economy Class 10, using specific long-tail keywords to enhance comprehension.
For more information, visit-www.vavaclasses.com
How to Split Bills in the Odoo 17 POS ModuleCeline George
Bills have a main role in point of sale procedure. It will help to track sales, handling payments and giving receipts to customers. Bill splitting also has an important role in POS. For example, If some friends come together for dinner and if they want to divide the bill then it is possible by POS bill splitting. This slide will show how to split bills in odoo 17 POS.
Students, digital devices and success - Andreas Schleicher - 27 May 2024..pptxEduSkills OECD
Andreas Schleicher presents at the OECD webinar ‘Digital devices in schools: detrimental distraction or secret to success?’ on 27 May 2024. The presentation was based on findings from PISA 2022 results and the webinar helped launch the PISA in Focus ‘Managing screen time: How to protect and equip students against distraction’ https://www.oecd-ilibrary.org/education/managing-screen-time_7c225af4-en and the OECD Education Policy Perspective ‘Students, digital devices and success’ can be found here - https://oe.cd/il/5yV
Unit 8 - Information and Communication Technology (Paper I).pdfThiyagu K
This slides describes the basic concepts of ICT, basics of Email, Emerging Technology and Digital Initiatives in Education. This presentations aligns with the UGC Paper I syllabus.
Cambridge International AS A Level Biology Coursebook - EBook (MaryFosbery J...
Graphing Quadratics
1. Graphing Quadratic Functions
MA.912.A.2.6 Identify and graph functions
MA.912.A.7.6 Identify the axis of symmetry,
vertex, domain, range, and intercept(s) for a
given parabola
2. Quadratic Function
y = ax2 + bx + c
Quadratic Term Linear Term Constant Term
What is the linear term of y = 4x2
– 3? 0x
What is the linear term of y = x2
- 5x ? -5x
What is the constant term of y = x2
– 5x? 0
Can the quadratic term be zero? No!
3. Quadratic Functions
The graph of a quadratic function is a:
A parabola can open up
or down.
If the parabola opens up,
the lowest point is called
the vertex (minimum).
If the parabola opens down,
the vertex is the highest point
(maximum).
NOTE: if the parabola opens left or right it is not a function!
y
x
Vertex
Vertex
parabola
4. y = ax2
+ bx + c
The parabola will
open down when the
a value is negative.
The parabola will
open up when the a
value is positive.
Standard Form
y
x
The standard form of a quadratic function is:
a > 0
a < 0
a≠0
5. y
x
Axis of
Symmetry
Axis of Symmetry
Parabolas are symmetric.
If we drew a line down
the middle of the
parabola, we could fold
the parabola in half.
We call this line the
Axis of symmetry.
The Axis of symmetry ALWAYS
passes through the vertex.
If we graph one side of
the parabola, we could
REFLECT it over the
Axis of symmetry to
graph the other side.
6. Find the Axis of symmetry for y = 3x2
– 18x + 7
Finding the Axis of Symmetry
When a quadratic function is in standard form
the equation of the Axis of symmetry
is
y = ax2
+ bx + c,
2
b
a
x −
=
This is best read as …
‘the opposite of b divided by the quantity of 2 times a.’
( )
18
2 3
x= 18
6
= 3=
The Axis of
symmetry is
x = 3.
a = 3 b = -18
7. Finding the Vertex
The Axis of symmetry always goes through the
_______. Thus, the Axis of symmetry gives
us the ____________ of the vertex.
STEP 1: Find the Axis of symmetry
Vertex
Find the vertex of y = -2x2
+ 8x - 3
2
b
a
x −
= a = -2 b = 8
x=
−8
2(−2)
=
−8
−4
=2
X-coordinate
The x-
coordinate
of the vertex
is 2
8. Finding the Vertex
STEP 1: Find the Axis of symmetry
STEP 2: Substitute the x – value into the original equation
to find the y –coordinate of the vertex.
8 8
2
2 2( 2) 4
b
a
x − − −
= =
− −
= =
The
vertex is
(2 , 5)
Find the vertex of y = -2x2
+ 8x - 3
y = −2 2( )
2
+8 2( )− 3
= −2 4( )+16 − 3
= −8+16 −3
= 5
9. Graphing a Quadratic Function
There are 3 steps to graphing a parabola in
standard form.
STEP 1: Find the Axis of symmetry using:
STEP 2: Find the vertex
STEP 3: Find two other points and reflect them across
the Axis of symmetry. Then connect the five points
with a smooth curve.
MAKE A TABLE
using x – values close to
the Axis of symmetry.
2
b
a
x −
=
10. STEP 1: Find the Axis of
symmetry
( )
4
1
2 2 2
b
x
a
-
= = =
y
x
Graph:y=2x2
−4x−1
Graphing a Quadratic Function
STEP 2: Find the vertex
Substitute in x = 1 to
find the y – value of the
vertex.
( ) ( )2
2 1 4 1 1 3y = - - =- Vertex:1,−3( )
x=1
11. 5
–1
( ) ( )2
2 3 4 3 1 5y = - - =
STEP 3: Find two other
points and reflect them
across the Axis of
symmetry. Then connect
the five points with a
smooth curve.
y
x
( ) ( )2
2 2 4 2 1 1y = - - =-
3
2
yx
Graphing a Quadratic Function
Graph:y=2x2
−4x−1
12. y
x
Y-intercept of a Quadratic Function
y=2x2
−4x−1Y-axis
The y-intercept of a
Quadratic function can
Be found when x = 0.
y =2x2
− 4x −1
=2 0( )2
− 4(0) −1
=0 −0 −1
= −1
The constant term is always the y- intercept
13. The number of real solutions is at most
two.
Solving a Quadratic
No solutions
6
4
2
-2
5
f x()= x2-2 ⋅x( )+5
6
4
2
-2
5
2
-2
-4
-5 5
One solution
X = 3
Two
solutions
The x-intercepts (when y = 0) of a quadratic function
are the solutions to the related quadratic equation.
14. Identifying Solutions
4
2
-2
-4
5
X = 0 or X = 2
Find the solutions of 2x - x2
= 0
The solutions of this
quadratic equation can be
found by looking at the
graph of f(x) = 2x – x2
The x-
intercepts(or
Zero’s) of
f(x)= 2x – x2
are the solutions
to 2x - x2
= 0
Editor's Notes
Ask students “Why is ‘a’ not allowed to be zero? Would the function still be quadratic?
Let students know that in Algebra I we concentrate only on parabolas that are functions; In Algebra II, they will study parabolas that open left or right.
Remind students that if ‘a’ = 0 you would not have a quadratic function.
Discuss with the students that the line of symmetry of a quadratic function (parabola that opens up or down) is always a vertical line, therefore has the equation x =#. Ask “Does this parabola open up or down?
Remind students that x-intercepts are found by setting y = 0 therefore the related equation would be ax 2 +bx+c=0. Also state that since the highest degree of a quadratic is 2, then there are at most 2 solutions. For the first graph ask “why are there no solutions?”-- there are no solutions because the parabola does not intercept the x-axis. 2 nd and 3 rd graph ask students to state the solutions. Additional Vocab may be itroduced: The x-intercepts are solutions, zero’s or roots of the equation.
Point out to students that the function can also be written as y = -x 2 +2x.