Download to read offline


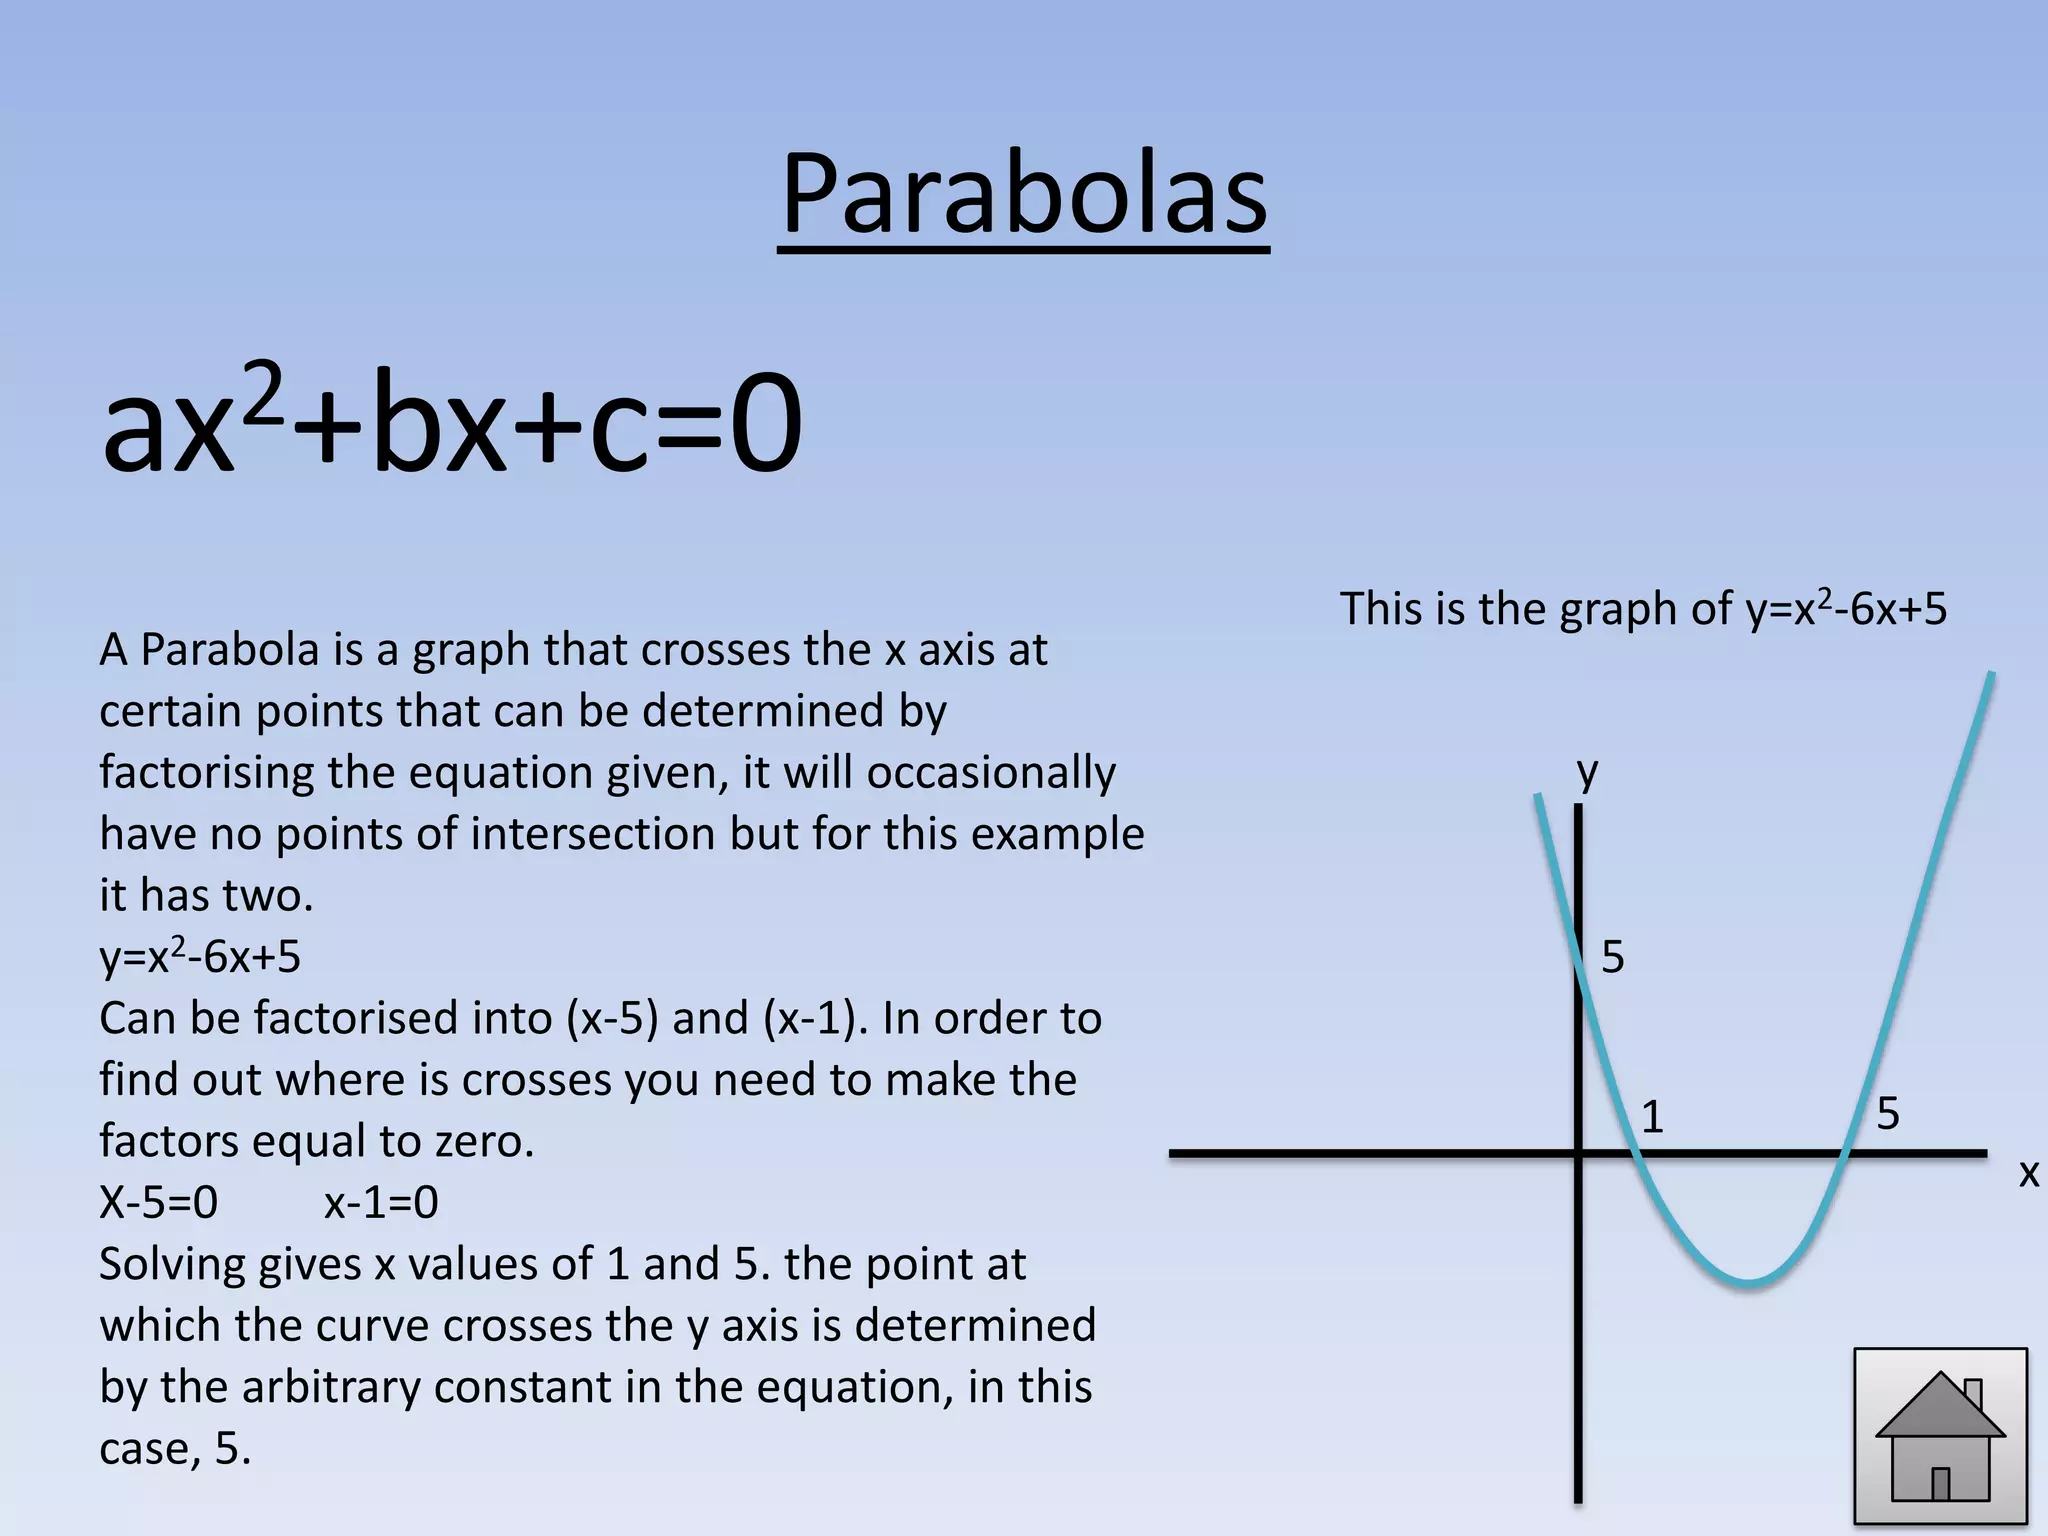

There are four types of conic sections: 1. Ellipses have an equation of the form (x^2/a^2) + (y^2/b^2) = 1. The values of a and b determine the shape and size. 2. Hyperbolas have a similar equation to ellipses but with a minus sign instead of plus, resulting in two branches that extend to infinity. 3. Circles have the equation (x-a)^2 + (y-b)^2 = r^2, where (a,b) are the coordinates of the center and r is the radius. 4. Parabolas have the general form ax


