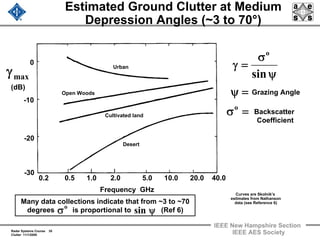
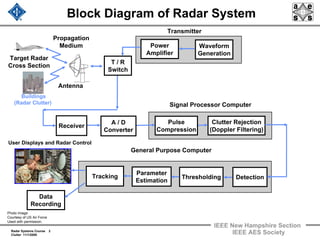
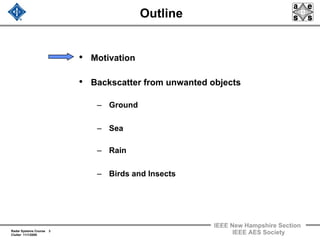
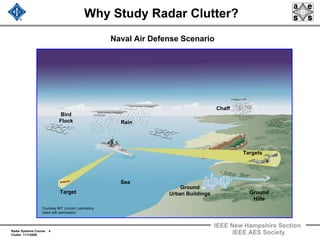
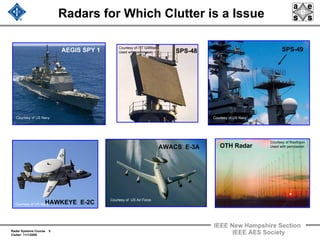
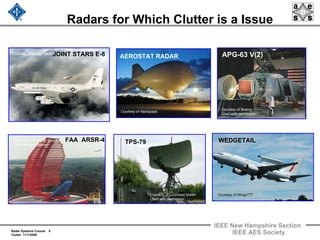
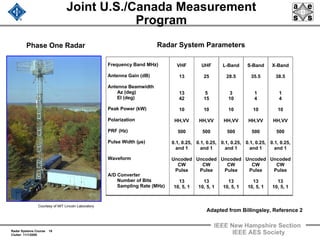
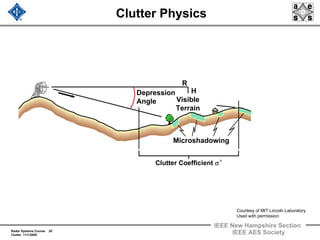
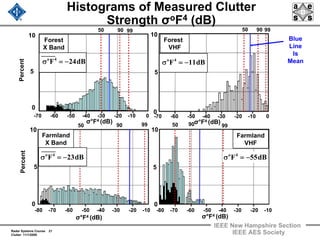
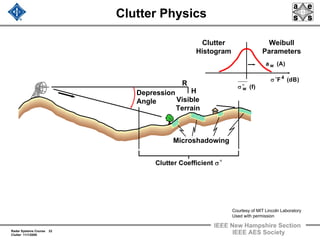
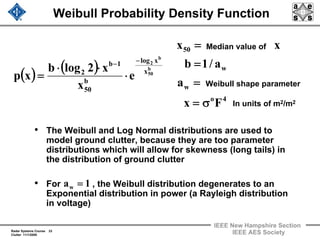
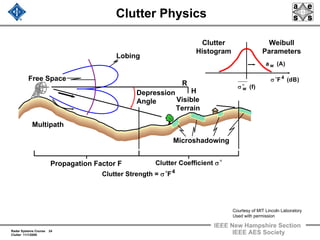
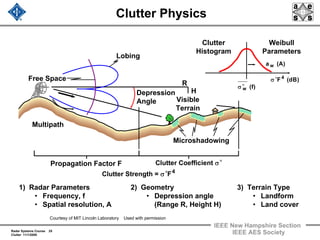
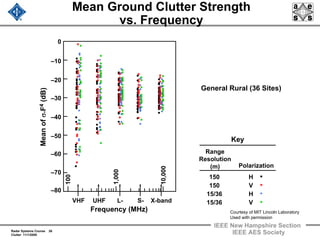
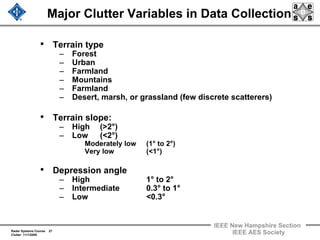
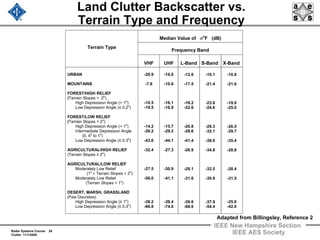
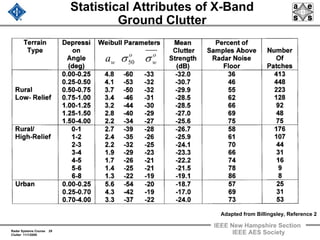
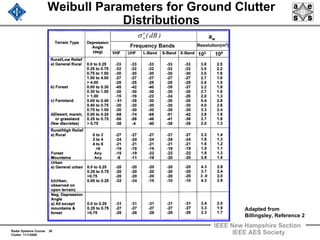
The document discusses radar clutter from unwanted objects like ground, sea, rain, and birds/insects. It provides examples of military radars for which clutter is an issue and outlines factors that affect ground clutter backscatter like terrain type, frequency, and depression angle. Median ground clutter strength values are shown for various terrain types and frequencies.
![Radar Systems Course 16
Clutter 11/1/2009
IEEE New Hampshire Section
IEEE AES Society
Geometry of Radar Clutter
Elevation View
Radar
h
φ
cT / 2
½ cT sec φ
Plan View
Radar
Clutter
BRθ
0
A
σ
σ =
Bθ
A = RθB [½ cT sec φ]
Courtesy of MIT Lincoln Laboratory
Used with permission](https://image.slidesharecdn.com/radar-2009-a10-radar-clutter1-160213204624/85/Radar-2009-a-10-radar-clutter1-16-320.jpg)
![Radar Systems Course 34
Clutter 11/1/2009
IEEE New Hampshire Section
IEEE AES Society
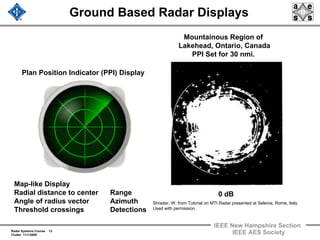
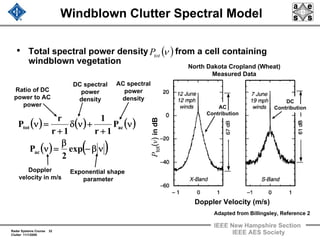
Modeled Rates of Exponential Decay in the
Tails of L-Band Spectra from Wind-Blown Trees
( ) ( )νβ−
β
=ν exp
2
Pac
Exponential shape
parameter
W
indy
β
=
10.7
0
L-Band
–20
–60
–40
RelativePower(dB)
0 0.5 1.0 1.5
Breezyβ=17.5
LightAirβ=23.5
Doppler Velocity (m/s)
s/m.v 20≥
• Exponential decay model agrees
very well with measured data
– X-Band to L-band
– Variety of wind conditions
Light thru heavy wind
– Over wide dynamic range
> 50 dB
• Previously used Gaussian and
power law models break down at
wide dynamic ranges
• Model parameter empirically
developed from measured data
[ ]4147.0wlog105.0 10
1
+=β−
Velocity of wind
(statute miles per hour)
β
Adapted from
Billingsley, Reference 2](https://image.slidesharecdn.com/radar-2009-a10-radar-clutter1-160213204624/85/Radar-2009-a-10-radar-clutter1-34-320.jpg)