This document provides an overview of synthetic aperture radar (SAR) basics and theory. It discusses key aspects of SAR including how it works, imaging geometry, spatial resolution, backscatter coefficients, common frequency bands, and advanced modes. SAR uses microwave radiation and can image the Earth's surface in all weather and light conditions, providing complementary data to optical remote sensing. It discusses concepts such as range and azimuth resolution, factors that influence backscatter, and challenges like speckle that SAR addresses through techniques like multi-look processing.
This content presents for basic of Synthetic Aperture Radar (SAR) including its geometry, how the image is created, essential parameters, interpretation, SAR sensor specification, and advantages and disadvantages.
How to better understand SAR, interpret SAR products and realize the limitationsNopphawanTamkuan
This content shows how to better understand SAR (how to interpret SAR images and read SAR interferogram ). Moreover, capacities and limitations of SAR are discussed for each disaster emergency mapping (Flood, Landslide and Earthquake).
SAR is a type of radar which works with antenna and receiver using radio waves which can create two dimension or three dimension of the objects . A synthetic-aperture radar is an imaging radar mounted on a moving platform. SAR gives high resolution data and works 24*7.
RADAR - RAdio Detection And Ranging
This is the Part 1 of 2 of RADAR Introduction.
For comments please contact me at solo.hermelin@gmail.com.
For more presentation on different subjects visit my website at http://www.solohermelin.com.
Part of the Figures were not properly downloaded. I recommend viewing the presentation on my website under RADAR Folder.
This course gives keys to understand the SAR image and specificities: geometry, speckle, penetration capabilities, layovers, multipath, dielectric properties.
Advanced modes: polarimetry, interferomety and POLINSAR are also presented.
A ~25 slide presentation that explains the underlying principles and some applications of InSAR, with a particular focus on the measurement of deformation due to earthquakes. The presentation could be used in a lecture or lab setting, or provided to students for review out of class. The slides are annotated with additional background information designed to assist instructors.
SBAS-DInSAR processing on the ESA Geohazards Exploitation PlatformEmmanuel Mathot
In the context of space-borne geodetic techniques, Differential Synthetic Aperture Radar Interferometry (DInSAR) has demonstrated its high performance in measuring surface displacements in different conditions and scenarios, both natural and anthropic. In particular, the advanced DInSAR time series processing method referred to as Small BAseline Subset (SBAS), that allows studying both the spatial and temporal variability of the surface displacements, has proven to be particularly suitable in different contexts, as for natural hazards (volcanoes, earthquakes and landslides) and human-induced deformation (subsidence due to aquifer exploitation, mining operations, and building of large infrastructures). Recently, an efficient implementation of this algorithm (referred to as P-SBAS approach) has been fully integrated within the ESA’s Grid Processing on Demand (G-POD) environment, which is part of the [Geohazards Thematic Exploitation Platform (GEP)](https://geohazards-tep.eo.esa.int/#!) of ESA. The GEP is devoted to the exploitation of EO data resources in the context of the Geohazard Supersites & Natural Laboratories as well as on the CEOS Pilots on Seismic Hazards and Volcanoes. The GEP is sourced with elements, data and processing, including P-SBAS, relevant to the geohazards theme. The integration of the P-SBAS algorithm within GEP resulted in a web-based tool freely available to the scientific community. This tool allows users to process, from their own laptops, the European SAR data archives (ERS, ENVISAT and Sentinel-1) for obtaining surface displacement maps and time series in a completely unsupervised way, without caring about data download and processing facility procurements. The workshop is organized in four parts. First, a short overview on the DInSAR processing methods allowing retrieving mean surface deformation maps and displacement time series will be provided, with a specific focus on the SBAS-DInSAR technique. Secondly, the GEP and G-POD environments will be introduced and the P-SBAS web tool will be presented. The third and the fourth parts are dedicated to the advanced features and to case studies and results achieved via the web tool, respectively.
This presentation is all about the wireless sensor networks, how they collect data using aggregation, and how they evaluate or calculate the parameters
Standard radar detection process requires that the sensor output is compared to a predetermined threshold. The
threshold is selected based on a-priori knowledge available and/or certain assumptions. However, any
knowledge and/or assumptions become in adequate due to the presence of multiple targets with varying signal
return and usually non stationary background. Thus, any predetermined threshold may result in either increased
false alarm rate or increased track loss. Even approaches where the threshold is adaptively varied will not
perform well in situations when the signal return from the target of interest is too low compared to the average
level of the background .Track-before-detect techniques eliminate the need for a detection threshold and provide
detecting and tracking targets with lower signal-to-noise ratios than standard methods. However, although trackbefore-
detect techniques eliminate
the need for detection threshold at sensor's signal processing stage, they often use tuning thresholds at the output
of the filtering stage .This paper presents a computerized simulation model for target detection process.
Moreover, the proposed model method is based on the target motion models, the output of the detection
process can easily be employed for maneuvering target tracking.
International Journal of Computational Engineering Research(IJCER)ijceronline
International Journal of Computational Engineering Research(IJCER) is an intentional online Journal in English monthly publishing journal. This Journal publish original research work that contributes significantly to further the scientific knowledge in engineering and Technology.
"Impact of front-end architecture on development cost", Viktor TurskyiFwdays
I have heard many times that architecture is not important for the front-end. Also, many times I have seen how developers implement features on the front-end just following the standard rules for a framework and think that this is enough to successfully launch the project, and then the project fails. How to prevent this and what approach to choose? I have launched dozens of complex projects and during the talk we will analyze which approaches have worked for me and which have not.
Software Delivery At the Speed of AI: Inflectra Invests In AI-Powered QualityInflectra
In this insightful webinar, Inflectra explores how artificial intelligence (AI) is transforming software development and testing. Discover how AI-powered tools are revolutionizing every stage of the software development lifecycle (SDLC), from design and prototyping to testing, deployment, and monitoring.
Learn about:
• The Future of Testing: How AI is shifting testing towards verification, analysis, and higher-level skills, while reducing repetitive tasks.
• Test Automation: How AI-powered test case generation, optimization, and self-healing tests are making testing more efficient and effective.
• Visual Testing: Explore the emerging capabilities of AI in visual testing and how it's set to revolutionize UI verification.
• Inflectra's AI Solutions: See demonstrations of Inflectra's cutting-edge AI tools like the ChatGPT plugin and Azure Open AI platform, designed to streamline your testing process.
Whether you're a developer, tester, or QA professional, this webinar will give you valuable insights into how AI is shaping the future of software delivery.
Slack (or Teams) Automation for Bonterra Impact Management (fka Social Soluti...Jeffrey Haguewood
Sidekick Solutions uses Bonterra Impact Management (fka Social Solutions Apricot) and automation solutions to integrate data for business workflows.
We believe integration and automation are essential to user experience and the promise of efficient work through technology. Automation is the critical ingredient to realizing that full vision. We develop integration products and services for Bonterra Case Management software to support the deployment of automations for a variety of use cases.
This video focuses on the notifications, alerts, and approval requests using Slack for Bonterra Impact Management. The solutions covered in this webinar can also be deployed for Microsoft Teams.
Interested in deploying notification automations for Bonterra Impact Management? Contact us at sales@sidekicksolutionsllc.com to discuss next steps.
Dev Dives: Train smarter, not harder – active learning and UiPath LLMs for do...UiPathCommunity
💥 Speed, accuracy, and scaling – discover the superpowers of GenAI in action with UiPath Document Understanding and Communications Mining™:
See how to accelerate model training and optimize model performance with active learning
Learn about the latest enhancements to out-of-the-box document processing – with little to no training required
Get an exclusive demo of the new family of UiPath LLMs – GenAI models specialized for processing different types of documents and messages
This is a hands-on session specifically designed for automation developers and AI enthusiasts seeking to enhance their knowledge in leveraging the latest intelligent document processing capabilities offered by UiPath.
Speakers:
👨🏫 Andras Palfi, Senior Product Manager, UiPath
👩🏫 Lenka Dulovicova, Product Program Manager, UiPath
UiPath Test Automation using UiPath Test Suite series, part 3DianaGray10
Welcome to UiPath Test Automation using UiPath Test Suite series part 3. In this session, we will cover desktop automation along with UI automation.
Topics covered:
UI automation Introduction,
UI automation Sample
Desktop automation flow
Pradeep Chinnala, Senior Consultant Automation Developer @WonderBotz and UiPath MVP
Deepak Rai, Automation Practice Lead, Boundaryless Group and UiPath MVP
Accelerate your Kubernetes clusters with Varnish CachingThijs Feryn
A presentation about the usage and availability of Varnish on Kubernetes. This talk explores the capabilities of Varnish caching and shows how to use the Varnish Helm chart to deploy it to Kubernetes.
This presentation was delivered at K8SUG Singapore. See https://feryn.eu/presentations/accelerate-your-kubernetes-clusters-with-varnish-caching-k8sug-singapore-28-2024 for more details.
Let's dive deeper into the world of ODC! Ricardo Alves (OutSystems) will join us to tell all about the new Data Fabric. After that, Sezen de Bruijn (OutSystems) will get into the details on how to best design a sturdy architecture within ODC.
Transcript: Selling digital books in 2024: Insights from industry leaders - T...BookNet Canada
The publishing industry has been selling digital audiobooks and ebooks for over a decade and has found its groove. What’s changed? What has stayed the same? Where do we go from here? Join a group of leading sales peers from across the industry for a conversation about the lessons learned since the popularization of digital books, best practices, digital book supply chain management, and more.
Link to video recording: https://bnctechforum.ca/sessions/selling-digital-books-in-2024-insights-from-industry-leaders/
Presented by BookNet Canada on May 28, 2024, with support from the Department of Canadian Heritage.
DevOps and Testing slides at DASA ConnectKari Kakkonen
My and Rik Marselis slides at 30.5.2024 DASA Connect conference. We discuss about what is testing, then what is agile testing and finally what is Testing in DevOps. Finally we had lovely workshop with the participants trying to find out different ways to think about quality and testing in different parts of the DevOps infinity loop.
JMeter webinar - integration with InfluxDB and GrafanaRTTS
Watch this recorded webinar about real-time monitoring of application performance. See how to integrate Apache JMeter, the open-source leader in performance testing, with InfluxDB, the open-source time-series database, and Grafana, the open-source analytics and visualization application.
In this webinar, we will review the benefits of leveraging InfluxDB and Grafana when executing load tests and demonstrate how these tools are used to visualize performance metrics.
Length: 30 minutes
Session Overview
-------------------------------------------
During this webinar, we will cover the following topics while demonstrating the integrations of JMeter, InfluxDB and Grafana:
- What out-of-the-box solutions are available for real-time monitoring JMeter tests?
- What are the benefits of integrating InfluxDB and Grafana into the load testing stack?
- Which features are provided by Grafana?
- Demonstration of InfluxDB and Grafana using a practice web application
To view the webinar recording, go to:
https://www.rttsweb.com/jmeter-integration-webinar
GraphRAG is All You need? LLM & Knowledge GraphGuy Korland
Guy Korland, CEO and Co-founder of FalkorDB, will review two articles on the integration of language models with knowledge graphs.
1. Unifying Large Language Models and Knowledge Graphs: A Roadmap.
https://arxiv.org/abs/2306.08302
2. Microsoft Research's GraphRAG paper and a review paper on various uses of knowledge graphs:
https://www.microsoft.com/en-us/research/blog/graphrag-unlocking-llm-discovery-on-narrative-private-data/
Essentials of Automations: Optimizing FME Workflows with ParametersSafe Software
Are you looking to streamline your workflows and boost your projects’ efficiency? Do you find yourself searching for ways to add flexibility and control over your FME workflows? If so, you’re in the right place.
Join us for an insightful dive into the world of FME parameters, a critical element in optimizing workflow efficiency. This webinar marks the beginning of our three-part “Essentials of Automation” series. This first webinar is designed to equip you with the knowledge and skills to utilize parameters effectively: enhancing the flexibility, maintainability, and user control of your FME projects.
Here’s what you’ll gain:
- Essentials of FME Parameters: Understand the pivotal role of parameters, including Reader/Writer, Transformer, User, and FME Flow categories. Discover how they are the key to unlocking automation and optimization within your workflows.
- Practical Applications in FME Form: Delve into key user parameter types including choice, connections, and file URLs. Allow users to control how a workflow runs, making your workflows more reusable. Learn to import values and deliver the best user experience for your workflows while enhancing accuracy.
- Optimization Strategies in FME Flow: Explore the creation and strategic deployment of parameters in FME Flow, including the use of deployment and geometry parameters, to maximize workflow efficiency.
- Pro Tips for Success: Gain insights on parameterizing connections and leveraging new features like Conditional Visibility for clarity and simplicity.
We’ll wrap up with a glimpse into future webinars, followed by a Q&A session to address your specific questions surrounding this topic.
Don’t miss this opportunity to elevate your FME expertise and drive your projects to new heights of efficiency.
UiPath Test Automation using UiPath Test Suite series, part 4DianaGray10
Welcome to UiPath Test Automation using UiPath Test Suite series part 4. In this session, we will cover Test Manager overview along with SAP heatmap.
The UiPath Test Manager overview with SAP heatmap webinar offers a concise yet comprehensive exploration of the role of a Test Manager within SAP environments, coupled with the utilization of heatmaps for effective testing strategies.
Participants will gain insights into the responsibilities, challenges, and best practices associated with test management in SAP projects. Additionally, the webinar delves into the significance of heatmaps as a visual aid for identifying testing priorities, areas of risk, and resource allocation within SAP landscapes. Through this session, attendees can expect to enhance their understanding of test management principles while learning practical approaches to optimize testing processes in SAP environments using heatmap visualization techniques
What will you get from this session?
1. Insights into SAP testing best practices
2. Heatmap utilization for testing
3. Optimization of testing processes
4. Demo
Topics covered:
Execution from the test manager
Orchestrator execution result
Defect reporting
SAP heatmap example with demo
Speaker:
Deepak Rai, Automation Practice Lead, Boundaryless Group and UiPath MVP
Smart TV Buyer Insights Survey 2024 by 91mobiles.pdf91mobiles
91mobiles recently conducted a Smart TV Buyer Insights Survey in which we asked over 3,000 respondents about the TV they own, aspects they look at on a new TV, and their TV buying preferences.
Unsubscribed: Combat Subscription Fatigue With a Membership Mentality by Head...
Synthetic aperture radar (sar) 20150930
1. 10/12/2015
1
Synthetic Aperture Radar (SAR)
Basics and Theory
Dr. M Jahanzeb Malik
B.E. (Civil Engg.), NED University, Pakistan
M.Sc (Geo information science and Earth Observation), ITC-UT, The Netherlands
PhD (Remote Sensing and Land Surface Modeling), ITC-UT, The Netherlands
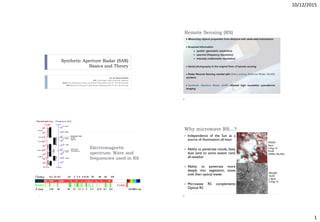
Remote Sensing (RS)
Electromagnetic
spectrum: Wave and
frequencies used in RS
Why microwave RS…?
Independence of the Sun as a
source of illumination:all-hour
Ability to penetrate clouds, haze,
dust (and to some extent rain):
all-weather
Ability to penetrate more
deeply into vegetation, snow,
soils then optical waves
Microwave RS complements
Optical RS
MODIS
Aqua
5-Aug, 10
R,G,B
5(NIR),1(R),4(G)
PALSAR
ALOS
L-Band
5-Aug, 10
2. 10/12/2015
2
Microwave RS complements Optical RS
ALOS: PALSAR, HH
ALOS:AVNIR, (R,G,B): (NIR,R,G)
Nawabshah/ Dadu,Sindh, Pakistan
Microwave RS complements Optical RS
Envisat,ASAR,WSM, C-Band,VV
01-Mar,2006
Tibet, China
Basic operation of RADAR
RADAR: RAdio Detection And Ranging
Spaceborne radar RS
Radar Altimeters: measure the round trip time delay to
targets to determine their distance from the sensor (e.g.,
SIRAL on CryoSat-2)
Radar Scattromters: make measurements of the amount of
energy backscattered from targets (e.g., Seawinds on
QuikSCAT)
Synthetic Aperture Radars (SAR): measure the round trip
time and amount of energy backscattered from targets (e.g.,
TerraSAR-X,COSMO-SkyMed,RADARSAT)
3. 10/12/2015
3
Imaging geometry of Side Looking RADAR
or pulse width
Bandwidth (B) = 1/τ
Common angles in radar imaging
slant range: the range along the radar line of sight, and
ground range: range from the nadir track along a smooth surface (the ground) to the
scatterer.
The incidence angle is the angle between the radar beam and ground surface
The look angle is the angle at which the radar looks at the surface
What does RADAR measure? Backscattering coefficient
units of m²
4. 10/12/2015
4
Spatial resolution
What is spatial resolution…?
the size of the smallest possible feature that can be
detected
RS in visible region:
For a homogeneous feature to be detected, its size
generally has to be equal to or larger than the IFOV.
If the feature is smaller than this, it cannot be detectable
as the average brightness of all features in that IFOV will
be recorded
Road
IFOVIFOV
Spatial resolution
SLAR Case:
Slant range resolution
Ground range resolution
Along-track (or azimuth)
resolution
=pulse duration
Range resolution
In designing the signal pattern for a radar sensor, there is
usually a strong requirement to have as much energy as
possible in each pulse in order to enhance the signal-to-
noise ratio (SNR)
This can be done by increasing the transmitted peak
power or by using a longer pulse
peak power is usually strongly limited by the available
power sources
an increased pulse length, which leads to a worse range
resolution
Spatial resolution vs range
5. 10/12/2015
5
Example: SLAR
X-band radar: 9.65 GHz (0.03 m); bandwidth: 150MHz
(pulse duration: 6.67 ns); speed of light: 2.9x10⁸ m/s;
Antenna length: 9 m; height: 3000 m; incidence angle: 20
deg
Slant range resolution: 1 m
Ground range resolution: 3 m
Azimuth resolution: 11 m
Height: 500 km;Azimuth resolution: around 2 km
For this reason,SLAR are not commonly used in spaceborne remote sensing
SAR
The main difference between
SLAR and SAR is the way in
which the azimuth resolution is
achieved.
The longer synthetic array
allows a larger Doppler
bandwidth and, hence, a finer
surface resolution.
The range resolution derived for
a real aperture radar is still valid
here.
SAR: azimuth resolution
The achievable azimuth resolution of a SAR is
approximately equal to one-half the length of the actual
(real) antenna and does not depend on
platform altitude (distance or range)
Wavelength
It shows that a smaller antenna gives better resolution
Power of the antenna is proportional to the square of its
aperture
So, Penalty in SNR must be paid to push antenna aperture
to very small dimension
SAR basic principle
Shorter pulse duration (Te ) higher bandwidth (Be) higher range resolution
Now, SAR bandwidth is selectable, e.g., PALSAR 2 (14/28/42/84 MHz), RADARSAT2 (11.6-
100 MHz),TerraSAR-X (150/300 MHz)
6. 10/12/2015
6
Spatial resolutions
ALOS PALSAR
(L-Band; ~23 cm)
TerraSAR-X
(X-Band; ~3 cm)
Spatial resolutions
ALOS PALSAR
(L-Band; ~23 cm)
TerraSAR-X
(X-Band; ~3 cm)
Topographic effects on reflectivity and map
geometry
For slopes facing the radar, the ground
range resolution will be poorer than that for slopes facing away
from the radar.
Geometric issues
7. 10/12/2015
7
Geometric issues Geometric issues
Envisat,ASAR,
WSM, C-Band,VV
13-Feb, 2006
Tibet, China
Backscattering coefficients
𝜎 𝑂=
𝜎
𝐴 𝐿
𝛽 𝑂=
𝜎
𝐴 𝛽
Backscattering coefficient
Example: for an object with an RCS of 10m2, and an image
pixel size of 10mx10m, = -10dB.
8. 10/12/2015
8
Backscattering coefficient
The value depends on:
Physical and electrical properties of the material
Shape, size, orientation, arrangement
Dielectric constant
Sensor parameters
Wavelength
Polarization
Incidence angle
Site parameters
Surface roughness
Topographic relief
Backscattering coefficient
Airborne SAR systems Spaceborne SAR systems
The Envisat mission ended on Apr 2012, following the unexpected loss of contact with the satellite,
and RADARSAT-1 in Mar, 2013.
2014ALOS-2/PalSAR-2 8 – 70 deg.
9. 10/12/2015
9
Surface Interaction with the Radar Beam
Surface Scattering
Specular Scattering
Bragg Scattering
Volume Scattering
Main scattering mechanism
Main scattering mechanism How trees are seen by RADARS
10. 10/12/2015
10
Surface scattering
surfaces appear “rougher” at larger angles
Surface Roughness
Roughness is a relative concept depending upon
wavelength and incidence angle.
According to the Rayleigh criterion, a surface is
considered smooth if:
and considered rough if:
Commonly used frequency bands Advanced SAR modes
Stripmap:The classic mode for side looking SAR
instruments
ScanSAR (Wide Swath Mode): Increased swath width
with loss in azimuth resolution
Spotlight Mode: Improved azimuth resolution; no
continious imaging can be achieved
11. 10/12/2015
11
Spackles
Inherent to coherent systems (i.e., phase information is
preserved)
Spackles make interpretation more difficult
Spackles : salt and paper effect
Speckle reduction
Multi-look processing
By averaging the looks incoherently
pixel by pixel the speckle reduced
image is obtained.
The speckle reduced image has an
improved radiometric resolution, but
the geometric resolution will be
worse.
Adaptive and non-adaptive filters
A moving window filter changes the
intensity of the central pixel
depending on the intensities of all
the pixels within the window