Downloaded 1,030 times

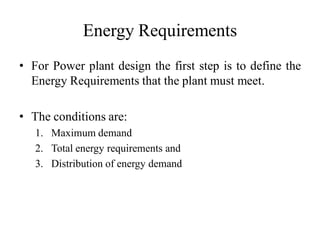
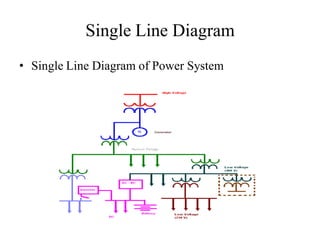


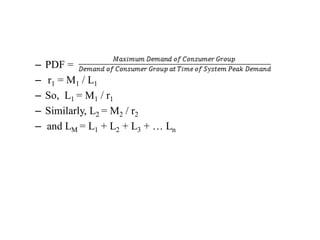
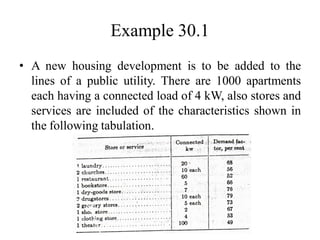
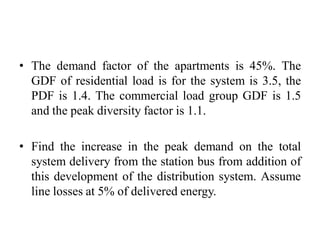
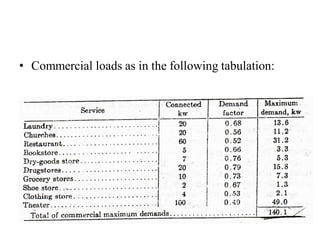
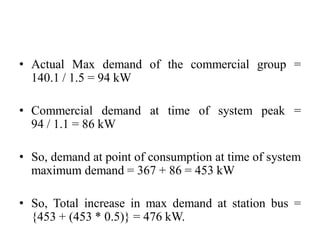
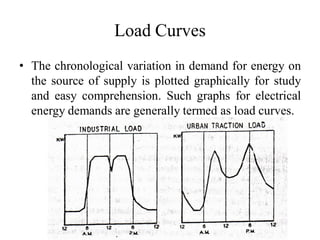
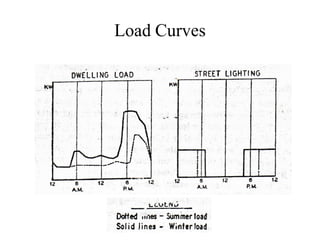
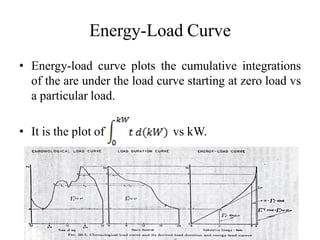
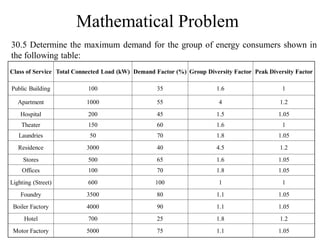
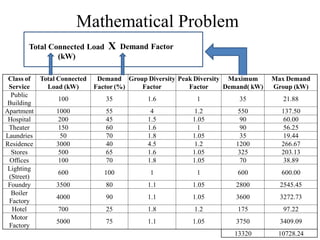
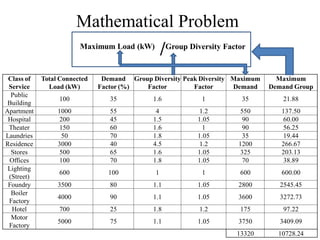

1) The document discusses key concepts for power plant design including energy requirements, maximum demand, single line diagrams, demand factor, group diversity factor, peak diversity factor, and maximum demand determination. 2) It provides an example of calculating the increase in peak demand from adding a new housing development to an existing distribution system. 3) The document also covers load curves, load duration curves, energy-load curves, load factor, capacity factor, and utilization factor as ways to analyze load and plant performance. It includes an example of calculating these metrics.


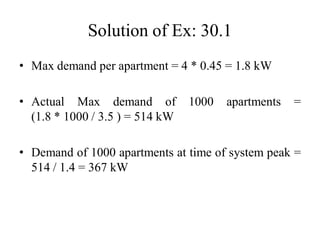
![Power system planning & operation [eceg 4410]](https://cdn.slidesharecdn.com/ss_thumbnails/powersystemplanningoperationeceg-4410-130607134359-phpapp01-thumbnail.jpg?width=640&height=640&fit=bounds)


