SlideShare a Scribd company logo
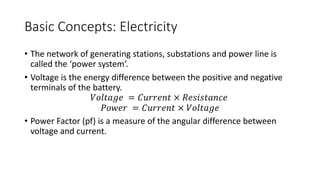
Basic Concepts: Electricity
• The network of generating stations, substations and power line is
called the ‘power system’.
• Voltage is the energy difference between the positive and negative
terminals of the battery.
𝑉𝑜𝑙𝑡𝑎𝑔𝑒 = 𝐶𝑢𝑟𝑟𝑒𝑛𝑡 × 𝑅𝑒𝑠𝑖𝑠𝑡𝑎𝑛𝑐𝑒
𝑃𝑜𝑤𝑒𝑟 = 𝐶𝑢𝑟𝑟𝑒𝑛𝑡 × 𝑉𝑜𝑙𝑡𝑎𝑔𝑒
• Power Factor (pf) is a measure of the angular difference between
voltage and current.
Load behaviour
• The power required by electrical equipment is called Load.
• Load curve is a graph showing the value of total active power load for
a utility at different points of time in a day.
• Load factor (LF) is the ratio between average load and maximum load.
It is given in percentage.
• Load Duration curve for a year shows the number of hours in a year
that the load is equal, or more than a given MW value. It is used to
analyse the power system over a longer period of time, say one year.
Input-Output Curve
• The Input-Output curve is a graph of the heat input rate in kcal/h
against power output in kW.
𝐻𝑒𝑎𝑡 𝑅𝑎𝑡𝑒 =
𝐼𝑛𝑝𝑢𝑡 𝑟𝑎𝑡𝑒 𝑖𝑛 𝑘𝑐𝑎𝑙/ℎ
𝑂𝑢𝑡𝑝𝑢𝑡 𝑖𝑛 𝑘𝑊
• The units of heat rate are kcal/kWh
Major Concepts of the Power System
• The Installed Capacity of a generating unit is its maximum MW
capacity at the time of installation.
• For many reasons, the maximum capacity may reduce a little over a
period of time. This reduced capacity is called the Derated Capacity.
• The Minimum Capacity is the minimum MW at which the generating
unit can operate in a stable way.
• Energy generated by a generating unit is measured by metering
instruments at the station and can also be calculated if one knows the
average hourly MW generation.
Major Concepts of the Power System
• Plant Load Factor (PLF) for a generating unit is calculated as the ratio of energy actually
generated, to the energy it would have generated if it were operating at its maximum
capacity.
𝑃𝐿𝐹 = 100 ×
Energy generated in a year
Max energy generation possible in a year
3
• Availability of a generating unit is the average of the declared generating capacity values
over a period of time (typically a year). It is expressed as a percentage of the Installed
capacity minus auxiliary consumption.
𝐴𝑣𝑎𝑖𝑙𝑎𝑏𝑖𝑙𝑖𝑡𝑦 = 100 ×
Hours for which the unit is available for generating power
Total Hours in the Year
Transmission Substation
• The transmission system consists of all the substations inter-
connected by transmission lines. It is like a mesh and is called the
transmission grid.
• A transmission substation is spread over a large area (a few 1000
square yards) with a lot of equipment. There will be:
• Transformers: used to convert one AC voltage to another
• Bus bars: a line at one voltage level to which many connections are made
• Circuit breakers: an elaborate switch used at high voltages and currents
• Isolators: A switch which cannot be operated when there is current flowing in
the circuit
• Protective relays: They are designed to sense when there are abnormal
voltages and currents
Protection System
• The equipment may damage when very high currents flow through it, due
to a fault.
• A Fault occurs when two transmission lines touch each other, or if one or
many lines touch the ground.
• The protection system starts acting when a fault happens.
• The relays detect the fault and give a signal to open the circuit breakers.
• The circuit breaker closes after some time and if the fault has disappeared,
the supply is restored.
• If the fault persists, the circuit breaker opens again. This cycle called “auto-
reclosing” is repeated till the fault goes away. Otherwise, the circuit
breaker is kept open till an operator attends to it.
How the power system works
• The power system has three sub-systems. The sub-systems are:
• Distribution system, which is the first link to the consumer
• Transmission system, which carries bulk power from generating stations to
the distribution substations
• Generation system, which is the production centre
Features of Distribution System
• The distribution is coordinated from a Distribution Control Centre
(DCC).
• The DCC will have the layout of the substations and feeders in the
area and specifications of various equipments in the distribution
system.
• It will also handle load management and routine load-shedding
operations.
• Emergency load shedding instructions are conveyed from the head
office to the DCC, which in turn instructs the field staff to open some
feeders to reduce the load.
Features of Transmission System
• At the state level, the operation of power system is co-ordinated from the
Load Dispatch Centre (LDC), typically located in the state capital.
• It is connected to three or four Sub Load Dispatch Centres (Sub-LDCs), which
in turn are connected to major substations and generating stations.
• The state LDC is connected to the Regional LDC (RLDC). The RLDC monitors a
whole region.
Generation System
• Generating stations are the production centres, which function under
the co-ordination of the LDC. Private and state owned utilities get
instructions from the state LDC whereas the central generating
stations are instructed by the regional LDC (RLDC).
• Types of Generating Stations:
• Hydro Station
• Coal Based Station
• Gas-based station
• Nuclear station
• Wind, Solar, Bio-Gas, Co-Generation
Transmission and Distribution Loss
• The losses occur due to:
• Technical Loss- It occurs due to its physical characteristics (power lines,
transformers, substation equipment etc)
• Non-technical loss- It occurs due to wrong measurement (billing, by the
utility) of energy supplied to consumers
• T&D loss usually refers to the Active Energy Loss, occurring between
an energy source and a consumer, over a period of time.

More Related Content

Similar to PRAYAS.pptx

Energy Efficiency in Electrical Systems.pptx
Energy  Efficiency in Electrical Systems.pptxEnergy  Efficiency in Electrical Systems.pptx
Energy Efficiency in Electrical Systems.pptx
PoojaAnupGarg
 
Electric-Traction-Railways.ppt
Electric-Traction-Railways.pptElectric-Traction-Railways.ppt
Electric-Traction-Railways.ppt
ssuserf805c8
 

Similar to PRAYAS.pptx (20)

Md.zafor sadak presentation 21/8/2017
Md.zafor sadak presentation 21/8/2017Md.zafor sadak presentation 21/8/2017
Md.zafor sadak presentation 21/8/2017
 
Switchgear, protection and measurement
Switchgear, protection and measurementSwitchgear, protection and measurement
Switchgear, protection and measurement
 
GENERATION, TRANSMISSION, DISTRIBUTION AND SCADA power point
GENERATION, TRANSMISSION, DISTRIBUTION AND SCADA  power pointGENERATION, TRANSMISSION, DISTRIBUTION AND SCADA  power point
GENERATION, TRANSMISSION, DISTRIBUTION AND SCADA power point
 
Energy Efficiency in Electrical Systems.pptx
Energy  Efficiency in Electrical Systems.pptxEnergy  Efficiency in Electrical Systems.pptx
Energy Efficiency in Electrical Systems.pptx
 
Load factor and demand factor
Load factor and demand factorLoad factor and demand factor
Load factor and demand factor
 
PPT_1_Electrical services_By group no. 1.pptx
PPT_1_Electrical services_By group no. 1.pptxPPT_1_Electrical services_By group no. 1.pptx
PPT_1_Electrical services_By group no. 1.pptx
 
PPT_1_Electrical services_By group no. 1.pptx
PPT_1_Electrical services_By group no. 1.pptxPPT_1_Electrical services_By group no. 1.pptx
PPT_1_Electrical services_By group no. 1.pptx
 
introduction on high voltage engineering
introduction on high voltage engineeringintroduction on high voltage engineering
introduction on high voltage engineering
 
Power System Protection (Primary & Backup)
Power System Protection (Primary & Backup)Power System Protection (Primary & Backup)
Power System Protection (Primary & Backup)
 
Charging & BMS.pptx
Charging & BMS.pptxCharging & BMS.pptx
Charging & BMS.pptx
 
Chapter 26
Chapter 26Chapter 26
Chapter 26
 
AEMC Webinar: Why Monitor Electrical Energy and How
AEMC Webinar: Why Monitor Electrical Energy and HowAEMC Webinar: Why Monitor Electrical Energy and How
AEMC Webinar: Why Monitor Electrical Energy and How
 
Electric-Traction-Railways.ppt
Electric-Traction-Railways.pptElectric-Traction-Railways.ppt
Electric-Traction-Railways.ppt
 
Module1-Power-System-operation and-control
Module1-Power-System-operation and-controlModule1-Power-System-operation and-control
Module1-Power-System-operation and-control
 
Unit 3
Unit 3Unit 3
Unit 3
 
Design methodology for pv
Design methodology for pvDesign methodology for pv
Design methodology for pv
 
Final ppt
Final pptFinal ppt
Final ppt
 
Phase 4
Phase 4Phase 4
Phase 4
 
ELECTRONICS AND ELECTRICAL DEVICES
ELECTRONICS AND ELECTRICAL DEVICES ELECTRONICS AND ELECTRICAL DEVICES
ELECTRONICS AND ELECTRICAL DEVICES
 
Lecture02.pdf
Lecture02.pdfLecture02.pdf
Lecture02.pdf
 

Recently uploaded

Article writing on excessive use of internet.pptx
Article writing on excessive use of internet.pptxArticle writing on excessive use of internet.pptx
Article writing on excessive use of internet.pptx
abhinandnam9997
 
一比一原版UTS毕业证悉尼科技大学毕业证成绩单如何办理
一比一原版UTS毕业证悉尼科技大学毕业证成绩单如何办理一比一原版UTS毕业证悉尼科技大学毕业证成绩单如何办理
一比一原版UTS毕业证悉尼科技大学毕业证成绩单如何办理
aagad
 
Living-in-IT-era-Module-7-Imaging-and-Design-for-Social-Impact.pptx
Living-in-IT-era-Module-7-Imaging-and-Design-for-Social-Impact.pptxLiving-in-IT-era-Module-7-Imaging-and-Design-for-Social-Impact.pptx
Living-in-IT-era-Module-7-Imaging-and-Design-for-Social-Impact.pptx
TristanJasperRamos
 

Recently uploaded (12)

Article writing on excessive use of internet.pptx
Article writing on excessive use of internet.pptxArticle writing on excessive use of internet.pptx
Article writing on excessive use of internet.pptx
 
1.Wireless Communication System_Wireless communication is a broad term that i...
1.Wireless Communication System_Wireless communication is a broad term that i...1.Wireless Communication System_Wireless communication is a broad term that i...
1.Wireless Communication System_Wireless communication is a broad term that i...
 
ER(Entity Relationship) Diagram for online shopping - TAE
ER(Entity Relationship) Diagram for online shopping - TAEER(Entity Relationship) Diagram for online shopping - TAE
ER(Entity Relationship) Diagram for online shopping - TAE
 
一比一原版UTS毕业证悉尼科技大学毕业证成绩单如何办理
一比一原版UTS毕业证悉尼科技大学毕业证成绩单如何办理一比一原版UTS毕业证悉尼科技大学毕业证成绩单如何办理
一比一原版UTS毕业证悉尼科技大学毕业证成绩单如何办理
 
BASIC C++ lecture NOTE C++ lecture 3.pptx
BASIC C++ lecture NOTE C++ lecture 3.pptxBASIC C++ lecture NOTE C++ lecture 3.pptx
BASIC C++ lecture NOTE C++ lecture 3.pptx
 
Latest trends in computer networking.pptx
Latest trends in computer networking.pptxLatest trends in computer networking.pptx
Latest trends in computer networking.pptx
 
History+of+E-commerce+Development+in+China-www.cfye-commerce.shop
History+of+E-commerce+Development+in+China-www.cfye-commerce.shopHistory+of+E-commerce+Development+in+China-www.cfye-commerce.shop
History+of+E-commerce+Development+in+China-www.cfye-commerce.shop
 
How to Use Contact Form 7 Like a Pro.pptx
How to Use Contact Form 7 Like a Pro.pptxHow to Use Contact Form 7 Like a Pro.pptx
How to Use Contact Form 7 Like a Pro.pptx
 
The AI Powered Organization-Intro to AI-LAN.pdf
The AI Powered Organization-Intro to AI-LAN.pdfThe AI Powered Organization-Intro to AI-LAN.pdf
The AI Powered Organization-Intro to AI-LAN.pdf
 
Living-in-IT-era-Module-7-Imaging-and-Design-for-Social-Impact.pptx
Living-in-IT-era-Module-7-Imaging-and-Design-for-Social-Impact.pptxLiving-in-IT-era-Module-7-Imaging-and-Design-for-Social-Impact.pptx
Living-in-IT-era-Module-7-Imaging-and-Design-for-Social-Impact.pptx
 
The+Prospects+of+E-Commerce+in+China.pptx
The+Prospects+of+E-Commerce+in+China.pptxThe+Prospects+of+E-Commerce+in+China.pptx
The+Prospects+of+E-Commerce+in+China.pptx
 
Multi-cluster Kubernetes Networking- Patterns, Projects and Guidelines
Multi-cluster Kubernetes Networking- Patterns, Projects and GuidelinesMulti-cluster Kubernetes Networking- Patterns, Projects and Guidelines
Multi-cluster Kubernetes Networking- Patterns, Projects and Guidelines
 

PRAYAS.pptx

  • 1. Basic Concepts: Electricity • The network of generating stations, substations and power line is called the ‘power system’. • Voltage is the energy difference between the positive and negative terminals of the battery. 𝑉𝑜𝑙𝑡𝑎𝑔𝑒 = 𝐶𝑢𝑟𝑟𝑒𝑛𝑡 × 𝑅𝑒𝑠𝑖𝑠𝑡𝑎𝑛𝑐𝑒 𝑃𝑜𝑤𝑒𝑟 = 𝐶𝑢𝑟𝑟𝑒𝑛𝑡 × 𝑉𝑜𝑙𝑡𝑎𝑔𝑒 • Power Factor (pf) is a measure of the angular difference between voltage and current.
  • 2. Load behaviour • The power required by electrical equipment is called Load. • Load curve is a graph showing the value of total active power load for a utility at different points of time in a day. • Load factor (LF) is the ratio between average load and maximum load. It is given in percentage. • Load Duration curve for a year shows the number of hours in a year that the load is equal, or more than a given MW value. It is used to analyse the power system over a longer period of time, say one year.
  • 3. Input-Output Curve • The Input-Output curve is a graph of the heat input rate in kcal/h against power output in kW. 𝐻𝑒𝑎𝑡 𝑅𝑎𝑡𝑒 = 𝐼𝑛𝑝𝑢𝑡 𝑟𝑎𝑡𝑒 𝑖𝑛 𝑘𝑐𝑎𝑙/ℎ 𝑂𝑢𝑡𝑝𝑢𝑡 𝑖𝑛 𝑘𝑊 • The units of heat rate are kcal/kWh
  • 4. Major Concepts of the Power System • The Installed Capacity of a generating unit is its maximum MW capacity at the time of installation. • For many reasons, the maximum capacity may reduce a little over a period of time. This reduced capacity is called the Derated Capacity. • The Minimum Capacity is the minimum MW at which the generating unit can operate in a stable way. • Energy generated by a generating unit is measured by metering instruments at the station and can also be calculated if one knows the average hourly MW generation.
  • 5. Major Concepts of the Power System • Plant Load Factor (PLF) for a generating unit is calculated as the ratio of energy actually generated, to the energy it would have generated if it were operating at its maximum capacity. 𝑃𝐿𝐹 = 100 × Energy generated in a year Max energy generation possible in a year 3 • Availability of a generating unit is the average of the declared generating capacity values over a period of time (typically a year). It is expressed as a percentage of the Installed capacity minus auxiliary consumption. 𝐴𝑣𝑎𝑖𝑙𝑎𝑏𝑖𝑙𝑖𝑡𝑦 = 100 × Hours for which the unit is available for generating power Total Hours in the Year
  • 6. Transmission Substation • The transmission system consists of all the substations inter- connected by transmission lines. It is like a mesh and is called the transmission grid. • A transmission substation is spread over a large area (a few 1000 square yards) with a lot of equipment. There will be: • Transformers: used to convert one AC voltage to another • Bus bars: a line at one voltage level to which many connections are made • Circuit breakers: an elaborate switch used at high voltages and currents • Isolators: A switch which cannot be operated when there is current flowing in the circuit • Protective relays: They are designed to sense when there are abnormal voltages and currents
  • 7. Protection System • The equipment may damage when very high currents flow through it, due to a fault. • A Fault occurs when two transmission lines touch each other, or if one or many lines touch the ground. • The protection system starts acting when a fault happens. • The relays detect the fault and give a signal to open the circuit breakers. • The circuit breaker closes after some time and if the fault has disappeared, the supply is restored. • If the fault persists, the circuit breaker opens again. This cycle called “auto- reclosing” is repeated till the fault goes away. Otherwise, the circuit breaker is kept open till an operator attends to it.
  • 8. How the power system works • The power system has three sub-systems. The sub-systems are: • Distribution system, which is the first link to the consumer • Transmission system, which carries bulk power from generating stations to the distribution substations • Generation system, which is the production centre
  • 9. Features of Distribution System • The distribution is coordinated from a Distribution Control Centre (DCC). • The DCC will have the layout of the substations and feeders in the area and specifications of various equipments in the distribution system. • It will also handle load management and routine load-shedding operations. • Emergency load shedding instructions are conveyed from the head office to the DCC, which in turn instructs the field staff to open some feeders to reduce the load.
  • 10. Features of Transmission System • At the state level, the operation of power system is co-ordinated from the Load Dispatch Centre (LDC), typically located in the state capital. • It is connected to three or four Sub Load Dispatch Centres (Sub-LDCs), which in turn are connected to major substations and generating stations. • The state LDC is connected to the Regional LDC (RLDC). The RLDC monitors a whole region.
  • 11. Generation System • Generating stations are the production centres, which function under the co-ordination of the LDC. Private and state owned utilities get instructions from the state LDC whereas the central generating stations are instructed by the regional LDC (RLDC). • Types of Generating Stations: • Hydro Station • Coal Based Station • Gas-based station • Nuclear station • Wind, Solar, Bio-Gas, Co-Generation
  • 12. Transmission and Distribution Loss • The losses occur due to: • Technical Loss- It occurs due to its physical characteristics (power lines, transformers, substation equipment etc) • Non-technical loss- It occurs due to wrong measurement (billing, by the utility) of energy supplied to consumers • T&D loss usually refers to the Active Energy Loss, occurring between an energy source and a consumer, over a period of time.